BeppoSAX observation of PSR B1937+21
We present the results of a BeppoSAX observation of the fastest rotating pulsar known: PSR B1937+21. The ks observation (78.5 ks MECS/34 ks LECS on-source time) allowed us to investigate with high statistical significance both the spectral properties and the pulse profile shape. The pulse profile is clearly double peaked at energies keV. Peak widths are compatible with the instrumental time resolution and the second pulse lags the main pulse 0.52 in phase, like is the case in the radio. In the 1.3–4 keV band we detect a DC component; conversely the 4–10 keV pulsed fraction is consistent with 100%. The on-pulse spectrum is fitted with an absorbed power-law of spectral index , harder than that of the total flux which is . The total unabsorbed (2–10 keV) flux is erg cm-2 s-1, implying a luminosity of ( kpc)2 erg s-1 and a X-ray efficiency of , where is the solid angle spanned by the emission beam. These results are in agreement with those obtained by ASCA and a more recent Rossi-XTE observation. The hydrogen column density cm-2 is times higher than expected from the radio dispersion measure and average Galactic density of e-. Though it is compatible (within ) with the Galactic (H i derived) value of cm-2, inspection of dust extinction maps reveal that the pulsar falls in a highly absorbed region. In addition, 1.4 GHz radio map shows that the nearby (likely unrelated) H ii source 4C21.53W is part of a circular emission region across.
Key Words.:
stars: neutron – stars: pulsars individual: PSR B1937+21 – X-rays: stars1 Introduction
The various X-ray satellites, from ROSAT to CHANDRA, observed about a dozen millisecond pulsars (MSPs) (see e.g. Becker 2001, Becker & Aschenbach 2002). Such observations demonstrate that the X-ray emission from MSPs is mainly not of thermal origin and those with the hardest spectra appear to be objects with strong magnetic fields at the light-cylinder radius ( where is the spin period of the MSP; see Saito et al. 1997, Kuiper et al. 1998, Kuiper et al. 2000, Becker 2001). However results, in the soft “ROSAT energy band” 0.1–2.4 keV from a Chandra observation of 47 Tuc, suggest that significant thermal emission (at energies keV) can be produced from MSPs (see Grindlay et al. 2002 for details). This appears not to be the case for PSR B182124 (see e.g. Becker et al. 2003). Correlation between spin-down energy loss and X-ray luminosity was investigated by several authors (e.g. Verbunt et al. 1996, Becker & Trümper 1997, Takahashi et al. 2001, Possenti et al. 2002), suggesting that the claimed law (2–10 keV) , with in the range 1.0–1.5, is valid for MSPs and “ordinary” pulsars in the same way.
Unfortunately, good spectral and temporal informations exist only for about half of the targeted sources. In fact (with the exception of the data collected by Rossi-XTE and, partially, by ASCA and BeppoSAX) MSP X-ray observations are usually affected not only by low statistics but sometimes also by insufficient time accuracy to perform detailed periodicity and timing analyses.
PSR B1937+21, with a period ms, is the first and still the fastest rotating MSP known. Its radio pulse profile is double peaked with phase separation of about 0.52. In spite of its low surface magnetic field strength of G, its magnetic field at the light-cylinder is the highest of all known pulsars: G (it is and the neutron star radius cm), very similar to that of the Crab pulsar. With a spin-down luminosity of erg s-1 ( g cm2, momentum of inertia), the derived spin-down flux density erg cm-2 s-1 is similar to that of PSR B182124 but it is 10 times larger than that of PSR J0218+4232, i.e. the other two MSPs detected in X-rays with good statistics which have high luminosities and show non-thermal emission only.
Analysis of a sensitive observation performed by Rossi-XTE has revealed that the X-ray peaks (see below) are almost perfectly aligned with the radio giant pulses (Cusumano et al. 2003). Such giant pulses are short bursts of emission with a flux density exceeding that of the whole profile by a factor of 10 to 100 or more. Having been discovered first for the Crab pulsar (Staelin & Reifenstein 1968), they have also been detected for PSR B1937+21 (Wolszczan et al. 1984, Backer 1995), and more recently for PSR B182124 (Romani & Johnston 2001), PSR B054069 (Johnston & Romani 2003) and PSR B1112+50 (Ershov & Kuzmin 2003). The observations suggest that the radio giant pulses are related to the high energy emission of these pulsars, possibly originating in outer gaps (Romani & Johnston 2001). Interestingly, Kinkhabwala & Thorsett (2000) report that the giant pulses of PSR B1937+21 appear in windows of s located after the main and interpulse peaks, with a typical duration of less than 10 s. Thereby, the location of the X-ray peak coincides with the giant pulses and not with the normal radio profile, strongly supporting the idea about a common origin of giant pulses and high energy emission.
In this paper we present the results of the temporal and spectral analysis of a BeppoSAX observation of PSR B1937+21. Compared to those performed with ASCA (Takahashi et al. 2001) our observation exploits the better instrumental sensitivity and a longer exposure time. This allows the detection of the pulse profile interpulse and source photons down to energies of 0.5 keV and enables us to put constraints on the toward the pulsar. Our results are compared with those obtained with ASCA and, more recently, with Rossi-XTE (Cusumano et al. 2003).
2 Observation and spatial analysis
BeppoSAX observed PSR B1937+21 on May 2001. Pointing coordinates were those from the radio timing. The ks observation time resulted in a total effective on-source time of ks and ks with the MECS (1.3–10 keV; Boella et al. 1997) and LECS (0.1–10 keV; Parmar et al. 1997), respectively. To extract the source photons from LECS and MECS we followed two alternative ways:
-
•
extraction of the photons from the circular region and in the energy range which optimize the signal to noise ratio: they were , 0.5–8 keV for the LECS and , 1.3–10 keV for the MECS, resulting in 106 and 385 collected photons, respectively. The local background (in a circular region in the field of view away from the pulsar) was compared to that obtained using archival data of blank sky observations. We found that the local background is higher for both LECS and MECS; background photons were 50 and 123, respectively.
-
•
a Maximum Likelihood (ML) approach to extract the number of counts assigned to the pulsar taking into account the presence of other sources and the background simultaneously (see e.g. Kuiper et al. 1998).
3 Temporal analysis
| Parameter | Value |
|---|---|
| Right Ascension (J2000) | 19h 39m 385600084(8) |
| Declination (J2000) | 21∘ 5913548(14) |
| Frequency (, Hz) | 641.928246349481(9) |
| Freq. derivative (, Hz s-1) | |
| Freq. deriv. (, Hz s-2) | |
| DMa (cm-3 pc) | 71.03998(6) |
| Epoch of ephemeris (MJD) | 52328.0 |
| Range of validity (MJD) | 45986 – 52764 |
| RA proper motion (mas yr-1 ) | |
| Dec proper motion (mas yr-1) | |
| Gal latitude () | 57.5215 |
| Gal longitude () | |
| Parallax (, mas) | |
| Distanceb ( – from DM, kpc) | 3.6 |
| Surface magnetic field (, G) | |
| Light-cylinder (, G) | |
| Spin-down energy loss (, erg s-1) | |
| (erg cm-2 s-1) |
-
Note: obtained from observations with the Effelsberg 100-m telescope and Arecibo archival data. Figures in parentheses represent uncertainties () in the last digits quoted.
-
a
Dispersion measure (DM) varies with time.
-
b
From NE2001 model (Cordes & Lazio 2002).
The arrival times of the extracted photons were converted to the Solar System Barycentric (SSB) frame using the BARYCONV111see www.asdc.asi.it/bepposax/software/saxdas/ code and then searched for periodicities by folding the MECS data with trial frequencies around the radio one222 Folding of the lower statistics LECS data did not reveal any modulation at level.. The timing ephemeris listed in Table 1 was obtained from observations with the Effelsberg 100-m radio telescope and archival Arecibo data. Details are reported in Cusumano et al. (2003). We found a clear signal, but the corresponding frequency Hz deviated from the radio value by Hz. This difference is about ten times the statistical error ( Hz). It could be ascribed to incorrect photon time markers, likely due to long term degradation of the on-board clock. This effect is relevant for long duration observations only (see Nicastro et al. 2002 for more details).

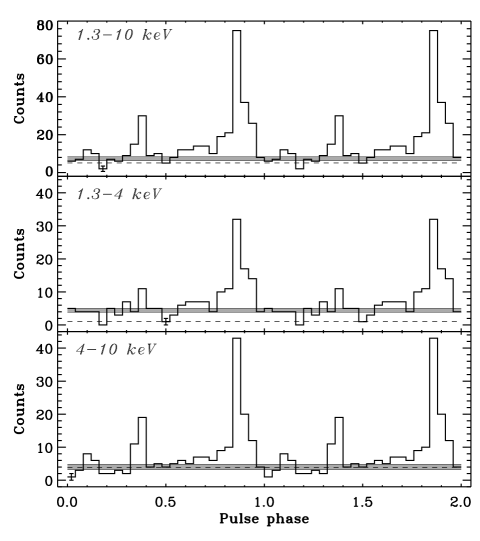
Figure 1 shows the folded light curve of the MECS data together with the radio one obtained with the 100-m Effelsberg radio-telescope. The X-ray profile is double peaked: the primary peak (P1) is detected at level, the secondary peak (P2) at . We performed a Gaussian fit on the two peaks. The derived phase widths are and , respectively. This values translate in s FWHM, fully compatible with the instrument time resolution limit. The phase separation of the two peaks (primary to secondary) is (90% confidence), where the error is derived from the statistical uncertainties in the peak position gaussian fits: and for P1 and P2, respectively, Figure 2 shows the X-ray pulse profile in 3 energy ranges. Non-detection of the interpulse in the ASCA data is explained by their lower statistical significance (227 total photons in 1.7–6.5 keV).
To quantify the pulsar DC component, we applied the bootstrap method proposed by Swanepoel et al. (1996), which allows us to estimate the off-pulse level (sky background plus unpulsed source component) in the pulse profile. We find that over the total energy range 1.3–10 keV the source has a pulsed fraction333It is the percentage of total counts above DC level with respect to the net total counts in the full profile above the background level (determined in the spatial analysis). of reducing to at energies 1.3–4 keV. In the 4–10 keV band the detected photons are pulsed. Changing the folding initial phase causes the pulse profile to change slightly but the detection level of the two peaks and the pulsed fraction remain well within the statistical error. The ASCA pulsed fraction of 59% is compatible with our results.
There is an indication for an increase of the strength of P2 compared to P1 with energy. Using the bins marked in Fig. 1 as on-pulse phases, for the band 1.3–4 keV and for the band 4–10 keV.
A joint analysis of radio data (Jodrell Bank) and X-ray data (ASCA) led Takahashi et al. (2001) to claim an alignment of the main X-ray peak with the radio interpulse. The BeppoSAX on-board clock absolute accuracy does not allow us to align our profile to the radio one. However we noticed earlier (Nicastro et al. 2002) that the radio and X-ray peaks have both a phase separation of (primary to secondary), then leading us to the conclusion that their result is likely incorrect. Results from a Rossi-XTE observation has confirmed this doubt showing that the X-ray peaks are almost perfectly aligned with the radio giant pulses (see Cusumano et al. 2003).
4 Spectral analysis
| Spectrum | ||||
|---|---|---|---|---|
| ( cm-2) | ||||
| Total | ||||
| Pulsedc | 0.33 |
-
Note: all quoted uncertainties are (95%) confidence. for both the Total and Pulsed spectra. Photons distribution law .
-
a
Normalization at 1 keV ( ph s-1 cm-2).
-
b
Unabsorbed flux in 2–10 keV ( erg cm-2 s-1).
-
c
MECS 1.3–10 keV (see marked bins in Fig. 1).
In spite of the lower exposure time and sensitivity of LECS we were able to detect a significant “unpulsed” signal in the 0.5–8 keV range for this instrument. Inclusion of these softer photons in the spectral fit allowed us to better constrain the toward the pulsar. In grouping the LECS and MECS data we applied the condition to have at least 20 and 30 counts per bin, respectively. The best fitting model (in the detection range 0.5–10 keV) was an absorbed power-law. A Black Body model did not fit the total flux data satisfactorily ( keV and , 13 d.o.f.). We then tried to fit the data with a broken power-law and a power-law + Black Body. For the latter case we also tried fixing the value of kT to various values in the range keV as higher values are unlikely for an MSP (Zavlin et al. (2002) found keV for PSR J04374715 and Grindlay et al. (2002) report keV for the MSPs in 47 Tuc). The F-test gives chance improvement probabilities of 90% for the broken power-law model and values around 50% for the power-law + Black Body, then we can reject these models. In the energy bands 0.1–2.4 and 2–10 keV we can estimate absorbed flux upper limits of and erg cm-2 s-1 for a Black Body component with keV. On-pulse analysis, subtracting the off-pulse counts, was also performed; phase bins used to extract the pulsed photons are marked in Fig. 1. Fit of the 1.3–10 keV MECS data alone gave cm-2 and ().
In Table 2 the best fit results (for the absorbed power-law model) are reported; in Fig. 3 the total (LECS+MECS) and pulsed spectra are shown together with the unabsorbed power-law and the fit residuals for both the total and the pulsed spectra. We also fitted the photons collected in the off-pulse region (DC level) which gave, though at lower statistics, a consistent and a photon index of . We note that the spectral index of 1.2 of the pulsed emission is harder than that obtained from the total emission. This is a typical value for magnetospheric emission and is fully consistent with the value obtained by Cusumano et al. (2003) using Rossi-XTE data. The total unabsorbed and absorbed fluxes of PSR B1937+21 in the 2–10 keV range are and erg cm-2 s-1, respectively. The derived (unabsorbed) luminosity is ( kpc)2 erg s-1 while the X-ray conversion efficiency is , where is the solid angle spanned by the emission beam. This result is confirmed by the Rossi-XTE 2.5–17 keV spectrum (Cusumano et al. 2003). We also note that the fit parameters are consistent with the non-detection (Verbunt et al. 1996) in the ROSAT HRI energy range (0.1–2.4 keV).

5 Discussion
5.1 Neutral hydrogen column density
Galactic can be estimated from radio/IR measurements in three different ways: 1. from the DM by assuming 10 H atoms for each e-; 2. from H i measurements, assuming there is no hydrogen at molecular state; 3. from dust extinction using the relation of Predehl & Schmitt (1995). When there are no direct pulsar measurements or three dimensional distribution models, points 2. and 3. make use of models of the integral content of H along a particular line of sight. They then only give upper limits for the atomic and total hydrogen content, respectively.
For PSR B182124 placed in the globular cluster M28, at a distance of kpc and galactic latitude of , one finds cm-2 which is consistent with the estimates from Galactic H i, dust and pulsar dispersion measure (Becker et al. 2003). Similarly consistent results are obtained for PSR J0218+4232. However, because of variable e-/ ratios in the various Galactic directions and the presence of more o less dense gas clouds along the line of sight, discrepancies would not be surprising.
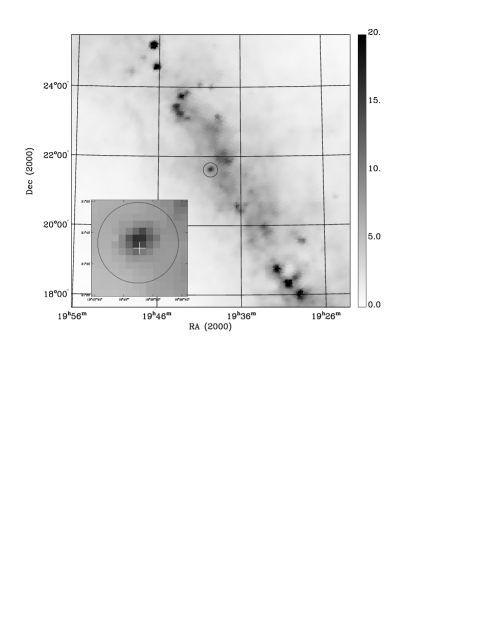
The column density we derive from the power-law fit is 10 times greater than the radio DM derived one and is only marginally consistent (within ) with the H i derived Galactic value cm-2 (Dickey & Lockman 1990). In addition, it is apparently totally inconsistent with the cm-2 obtained from the Schlegel, Finkbeiner & Davis (1998; SFD) dust extinction maps (Schlegel et al. (1998).
Being the line of sight to PSR B1937+21 tangent to the Galactic spiral arms (, , see e.g. Fig. 3 of Watson et al. 2003), one can invoke a particularly low e-/ ratio in that direction due to the lack of ionizing sources. H i maps report the integral Galactic column density but do not account for hydrogen in molecular form and then, in particular for objects in the Galactic plane, they must generally be regarded as lower limits. A more reliable check of the X-ray determined can come from the investigation of dust extinction maps. Using the afore mentioned Predehl & Schmitt (1995) relation, Verbunt at al. (1996) set an upper limit of cm-2 for the column density (i.e. in agreement with the DM value). From the more recent SFD map, as shown in Fig. 4, we note that PSR B1937+21 is almost at the center of an enhanced absorption region. The map has a pixel resolution of and spatial resolution of 61 (FWHM). The enhanced region is then consistent with a point source at coordinates RA (J2000) 395 Dec (J2000) 375. Given the mentioned spatial resolution, it is compatible with the position of PSR B1937+21. However at this position there is a strong radio and IR source: IRAS 19375+2130 ( 4C21.53W G570.27 G57.550.27). This source was extensively investigated since the discovery of PSR B1937+21 (see e.g. Becker & Helfand 1983). It is listed as an ultra-compact H ii region and selected by Wood & Churchwell (1989) as a candidate site of OB star formation. To estimate the visual Galactic extinction toward the pulsar, we used the map value of neighboring regions: it is E(BV) and a value of is derived, giving cm-2. This is some 50% higher than the X-ray derived for PSR B1937+21. The observed high dust/gas ratio can then be justified without requiring a very large distance to the pulsar. However it has to be larger than the NE2001 model derived one (Cordes & Lazio 2002) as 3.6 kpc is a lower limit derived from timing (see below). Considering that the SFD map predictions are not very reliable at galactic latitudes (Schlegel et al. 1998), the consistency with the X-ray derived value is remarkable.
5.2 The pulsar distance
Timing observations of the pulsar provide proper motion measurements and an upper limit on the timing parallax of mas (see Table 1). This information can be used to infer that the DM distance of 3.6 kpc is, in fact, a lower limit. An upper limit can be derived from the transversal velocity estimate given by the interstellar scintillation velocity km s-1 found by Cordes (1990). Anyway, given the timing derived pulsar proper motion, the resulting limit of kpc is not very constraining. While it has been shown that the scintillation velocity is indeed a good estimator for the true transversal velocity (Nicastro et al. 2001), for low velocities such as measured for MSPs (i.e. km s-1), systematic effects can result in large errors. A campaign of scintillation study could lead to a more reliable estimate, but it is unlikely that a value lower than 30 km s-1 can be measured and therefore it can only be useful to set the Galactic upper limit distance of kpc. On the other hand, regular multi-frequency observations can help to remove the effects of “interstellar weather”, which degrades the timing precision of PSR B1937+21 significantly (e.g. Backer & Wong 1996). If these effects can be modeled, higher timing precision is obtainable in the future, possibly helping in setting tighter limits on the parallax measurements.
Heiles et al. (1983) studied the H i absorption spectra toward PSR B1937+21, 4C21.53W and another close-by source. By setting the Galactic tangent point to 5.4 kpc, a comparison of position and intensity of the lines for these three objects allowed them to conclude that 4C21.53W is at kpc and the pulsar at kpc from us. Frail & Weisberg (1990) revised this result using a new model for the rotation of the Galaxy. They adopt the tangent point distance as the pulsar distance lower limit: kpc. Watson et al. (2003) have recently confirmed the position of the H ii region in the Perseus arm. Assuming a tangent point at a distance of 4.6 kpc, they derive a distance of 8.6 kpc by studying H2CO absorption and H110 emission lines (H110 is the 4874.1570 MHz radio recombination line). However the data are inconclusive on the position of the intervening molecular cloud, giving either 3.6 or 5.5 kpc as possible distances, for the two sides of the tangent point, respectively. With the pulsar at a distance kpc, it is possible that the cloud contributes significantly to the absorption of the low energy X-rays.
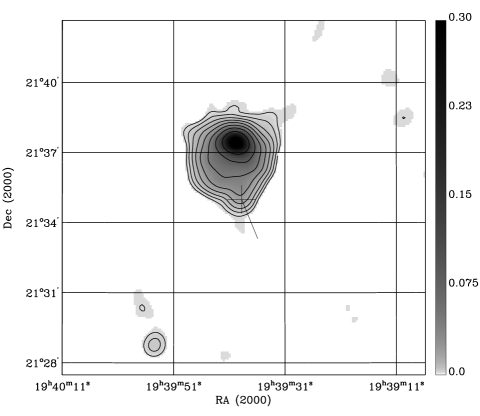
We also investigated the 1.4 GHz NVSS data (Condon et al. 1998). Figure 5 shows the region around the pulsar position. PSR B1937+21 lies on the edge of a diffuse circular region (flux is mJy/beam) and is moving away from it as indicated by the proper motion vector shown in Fig. 5. Incidentally, the vector orientation along the Galactic plane can explain why PSR B1937+21 has the lowest z-height of all MSPs. The strong source to the North is the aforementioned 4C21.53W and has a flux density of mJy, compared to the mJy of PSR B1937+21. The non-detection of the diffuse region in the VLA maps by Becker & Helfand (1983) can be explained by their use of a different array configuration. They used the B-array rather than the D-configuration as used for the NVSS, resulting in a much degraded sensitivity for diffuse emission. Though the circular shape of the region and the pulsar velocity vector could be suggestive of an association, the curved (externally “compressed”) shape of the H ii region indicates a relation with the latter (see Fig. 1 of Becker & Helfand 1983). A possible way to estimate the chance coincidence of PSR B1937+21 with the H ii “complex” is to select the sources of Watson et al. (2003) away from the inner arms, i.e. and , and assume that they all have an associated “region” of diameter (we recall that those H ii regions were selected from the IRAS point source catalogue, i.e. they have FWHM at 100 m). The ratio of the total area of the selected 20 sources to square degrees is . We note also that in the same area there are 15 known pulsars, two of which are MSPs444 http://www.atnf.csiro.au/research/pulsar/psrcat/. The coincidence at this galactic longitude of a peculiar pulsar with such a small region (at a distance of 8.6 kpc the region would be pc across, pc at 3.6 kpc) remains then remarkable.
5.3 Spectral index and magnetospheric emission
Table 3 lists the main emission properties of the three MSPs which show non-thermal emission only. In order to account for the contribution to the DC flux by the field source listed by Becker et al. (2003), but unresolved by the BeppoSAX MECS, we re-analysed the BeppoSAX observation of B182124. The pulsed fraction was compatible with 100%. This is consistent with the result by Danner et al. (1997) using ROSAT HRI data in the 0.1–2 keV band and explains the similar indices of the on-pulse BeppoSAX spectrum and the total CHANDRA spectrum, for which no pulse phase selection could be performed. As can be seen from Table 3, the “total” flux photon index of PSR B1937+21 is significantly softer than that measured for PSR J0218+4232 and PSR B182124. Also, we found that the spectrum of the pointlike DC component of PSR B1937+21 is softer than its pulsed spectrum. It is interesting to note that high-resolution CHANDRA observations of PSR J0218+4232 (Kuiper et al. 2002) confirmed the presence of a DC component of this source, earlier noted in Kuiper et al. (1998) and Mineo et al. (2000). The spectrum of the DC component of PSR J0218+4232 appeared to be softer than its pulsed component, like we found here for PSR B1937+21. Kuiper et al. (2000) concluded that we do not expect thermal emission from the surface of an old, recycled MSP due to cooling, and that the soft DC component is most likely due to reheating of the polar cap area by backflowing accelerated particles. This has to be investigated further for PSR B1937+21. A high spatial resolution observation may reveal field sources and/or diffuse emission also in the PSR B1937+21 field. Such information would allow us to better constrain both its total and pulsed emission properties as compared to those of PSR B182124 and PSR J0218+4232 for which higher resolution observations already exist. In spite of the large difference between PSR B1937+21 and B182124, the X-ray production efficiencies of these two pulsars are similar; and similar are their and pulsed emission spectral indices. PSR J0218+4232 is a factor of 10 more efficient even though its is the weakest of the three; on the other hand it has the hardest spectrum. We finally note that using 4.6 kpc as the distance to PSR B1937+21 and as the distance to PSR J0218+4232 the 4 kpc upper limit recently set by Bassa et al. (2003), the “pulsed” X-ray luminosities of the three pulsars are almost identical. Identical are also the pulsed spectral indices if for PSR J0218+4232 we adopt the statistically more significant value of from Kuiper et al. (2003).
All together these figures are not inconsistent with the claiming of a single law for MSPs and ordinary pulsars suggesting that a common magnetospheric emission process could be responsible for most, if not all, of the emitted X-ray flux in the band 2–10 keV. It is not clear if pulsar in 47 Tuc could be peculiar in this respect given that they have been studied only in the soft energy range 0.1–2.4 keV (Grindlay et al. 2002).
| Parameter | B1937+21a | B1821b | J0218c |
|---|---|---|---|
| Period (, ms) | 1.558 | 3.054 | 2.323 |
| ( s Hz) | 1.0 | 16 | 0.77 |
| ( erg s-1) | 1.1 | 2.2 | 0.25 |
| ( G) | 1.0 | 0.77 | 0.32 |
| Distance (, kpc) | 3.6 (4.6) | 5.5 | 5.7 (4.0) |
| () | 7.1 (4.3) | 6.1 | 0.64 (1.3) |
| total | |||
| pulsed | |||
| Pulsed frac.e (, %) | 86 | 98 | 73 |
| () | 0.37 (0.60) | 0.62 | 1.3 (0.64) |
| 6.4 (10) | 12 | 16 (7.9) | |
| 5.7 | 16 | 0.67 | |
| () | 0.34 (0.55) | 0.28 | 4.8 (2.4) |
| () | 5.8 (9.5) | 5.6 | 65 (32) |
-
Note: luminosity (erg cm-2 s-1) and flux (erg s-1) in 2–10 keV.
-
a
In parenthesis figures for kpc.
-
b
See Becker et al. (2003); Kawai & Saito (1999).
-
c
See Mineo et al. (2000). In parenthesis figures for kpc (Bassa et al. 2003). Using Rossi-XTE, Kuiper et al. (2003) find over the range 2 to keV for pulsed.
-
d
Spin-down flux (erg cm-2 s-1).
-
e
In 1.6–10 keV as derived by BeppoSAX observations.
-
f
Luminosity: P = pulsed (), I = isotropic total, E = isotropic expected from the relation (Takahashi et al. 2001).
6 Conclusions
We detected the double peak profile of the fastest rotating pulsar known. The 1.3–10 keV pulsed fraction is 85% which becomes 100% in the 4–10 keV band. The DC component is significantly detected only in the low energy band 1.3–4 keV ( unpulsed photons). The pulse phase resolved spectral analysis confirms this result. The secondary (X-ray) peak is detected at high significance above 3–4 keV and the ratio primary/secondary decreases with energy. This suggests that the secondary peak has a harder spectrum. It was not possible to perform an absolute phase comparison with the radio profile, but phase separation comparison indicates, contrarily to the ASCA finding by Takahashi et al (2001), that the main radio and X-ray peaks are aligned. This indeed was confirmed by a Rossi-XTE observation which shows that the X-ray peaks are almost perfectly aligned with the radio giant pulses (Cusumano et al. 2003).
We measure a hard power-law spectral index for the pulsed photons. This is similar to the value found for PSR B182124 and PSR J0218+4232 (Kuiper et al. 2003). We find a column density of cm-2 toward PSR B1937+21. It is marginally consistent with the integral Galactic value obtained by the Dickey & Lockman (1990) H i model of cm-2 but in agreement with the SFD map prediction, and gives a e-/ ratio of 1/100.
From the NVSS maps we note that the pulsar is located on the edge of a diffuse circular region with the strong radio/IR source 4C21.53W and the pulsar located at opposite edges. The pulsar also seems to move away from this region with a transverse speed vector along the Galactic plane. Emission/absorption line observations have shown that 4C21.53W is very likely located in the Perseus arm at 8–9 kpc away from us (Watson et al. 2003) whereas it is unlikely the pulsar to be too far away from the Galactic tangent point, i.e. 4.6 kpc (Frail & Weisberg 1990). These results and the morphology of 4C21.53W/diffuse region suggest they are associated, with the pulsar aligned by chance.
A detailed study of the ISM toward the pulsar could possibly help modeling the (relatively) high timing noise of PSR B1937+21 and consequently further constrain the parallax mesurement. However, we consider kpc to be a good distance estimate.
A high spatial resolution CHANDRA X-ray observation can help both to verify the high value and to study the continuum X-ray emission properties of its close surroundings. A better resolved 1.4 GHz radio map (obtainable from C configuration VLA archival data) can help to study the morphology of the “4C21.53 complex” and to confirm the chance alignment of the diffuse emission region with the pulsar.
Acknowledgements.
This research is supported by the Italian Space Agency (ASI) and Consiglio Nazionale delle Ricerche (CNR). BeppoSAX was a major program of ASI with participation of the Netherlands Agency for Aerospace Programs (NIVR). Its unburned pieces sinked in the Pacific Ocean on April 30, 2003, exactly on the date of its birthday. We would like to thank the anonymous referee whose comments and suggestions improved the clarity of the paper.References
- (1) Backer, D. C., & Wong, T. 1996, in Proc. of Pulsars: problems and progress, IAU 160, ASP Conf. Series 105, ed. S. Johnston, M. A. Walker & M. Bailes, 87
- (2) Bassa, C. G., van Kerkwijk, M. H., & Kulkarni, S. R. 2003, A&A, 403, 1067
- (3) Backer, D. C. 1995, JA&A, 16, 165
- (4) Becker, R. H., & Helfand, D. J. 1983, Nat, 302, 688
- (5) Becker, W., & Trümper, J. 1997, A&A, 326, 682
- (6) Becker, W. 2001, in Proc X-ray Astronomy ’99: Stellar Endpoints, AGN & the Diffuse X-ray Background, ed. N. White et al., AIP Conference Proceedings 599, 13
- (7) Becker, W., & Aschenbach, B. 2002, in Proc. of Neutron Stars, Pulsars and Supernova Remnants, MPE-Report 278, 64, ed. W. Becker, H. Lesch & J. Trümper
- (8) Becker, W., Swartz, D. A., Pavlov, G. G., et al. 2003, ApJ, in press, astro-ph/0211468
- (9) Boella, G., Chiappetti, L., Conti, G., et al. 1997, A&AS, 122, 327
- (10) Condon, J. J., Cotton , W. D., Greisen, E. W., et al. 1998, AJ, 115, 1693
- (11) Cordes, J. M. 1990, ApJ, 349, 245
- (12) Cordes, J. M., & Lazio, T. J. W. 2002, in preparation, astro-ph/0207156
- (13) Cusumano, G., Mineo, T., Massaro, E., et al. 2003, A&A, submitted
- (14) Danner, R., Kulkarni, S. R., Saito, Y., & Kawai, N. 1997, Nat, 388, 751
- (15) Dickey, J. M., Lockman, F. J. 1990, ARA&A, 28, 215
- (16) Frail, D. A., & Weisberg, J. M. 1990, AJ, 100, 3
- (17) Ershov, A. A., & Kuzmin, A. D. 2003, AstL, 29, 91
- (18) Grindlay, J. E., Camilo, F., Heinke, C. O., et al. 2002, ApJ, 581, 470
- (19) Heiles, C., Kulkarni, S. R., Stevens, M. A., Backer, D. C., Davis, M. M., & Goss, W. M. 1983, ApJ, 273, L75
- (20) Lundgren, S. C., Cordes, J. M., Ulmer, M., et al. 1995, ApJ, 453, 433
- (21) Johnston, S., & Romani, R. W. 2003, ApJ, accepted, astro-ph/0305235
- (22) Kawai, N., Saito, Y. 1999, in Proc. 3rd INTEGRAL Workshop, Taormina, Astroph. Lett. & Comm. Vol. 38, I, p.1.
- (23) Kinkhabwala, A., & Thorsett, S. E. 2000, ApJ, 535, 365
- (24) Kuiper, L., Hermsen, W., Verbunt, F., & Belloni, T. 1998, A&A, 336, 545
- (25) Kuiper, L., Hermsen, W., Verbunt, F., et al. 2000, A&A, 359, 615
- (26) Kuiper, L., Hermsen, W., Verbunt, F., et al. 2002, ApJ, 577, 917
- (27) Kuiper, L., Hermsen, W., & Stappers, B. 2003, in Proc. of Pulsars, AXPs and SGRs observed with BeppoSAX and other Observatories, in press
- (28) Mineo, T., Cusumano, G., Kuiper, L., et al. 2000, A&A, 355, 1053
- (29) Nicastro, L., Nigro, F., D’Amico, N., Lumiella, V., & Johnston, S. 2001, A&A, 368, 1055
- (30) Nicastro, L., Cusumano, G., Kuiper, L., et al. 2002, in Proc. of Neutron Stars, Pulsars and Supernova Remnants, MPE-Report 278, ed. W. Becker, H. Lesch & J. Trümper, 87
- (31) Possenti, A., Cerutti, R., Colpi, M., & Mereghetti, S. 2002, A&A, 387, 993
- (32) Parmar, A. N., Martin, D. D. E., Bavdaz, M., et al. 1997, A&AS, 122, 309
- (33) Predehl, P., & Schmitt, J. 1995, A&A, 293, 889
- (34) Romani, R. W., & Johnston, S. 2001, ApJ, 557, L93
- (35) Saito, Y., Kawai, N., Kamae, T., et al. 1997, ApJ, 477, L37
- (36) Schlegel, D. J., Finkbeiner D. P., & Davis, M. 1998, ApJ, 550, 525
- (37) Staelin, D. H., & Reifenstein III, E. C. 1968, Sci, 162, 1481
- (38) Swanepoel, J. W. H., de Beer, C. F., & Loots, H. 1996, ApJ, 467, 261
- (39) Takahashi, M., Shibata, S., Torii, K., et al. 2001, ApJ, 554, 316
- (40) Verbunt, F., Kuiper, L., Belloni, T., et al. 1996, A&A, 311, L9
- (41) Watson, C., Araya, E., Sewilo, M., et al. 2003, ApJ, in press, preprint: www.astro.wisc.edu/sirtf/watson.arecibo.pdf
- (42) Wolszczan, A., Cordes, J. M., & Stinebring, D. R. 1984, in Proc. of the NRAO Workshop, Birth and Evolution of Neutron Stars: Issues Raised by Millisecond Pulsars, p63, ed. S. P. Reynolds & D. R. Stinebring
- (43) Wood, D. O. S., & Churchwell, E. 1989, ApJ, 340, 265
- (44) Zavlin, V. E., Pavlov, G. G., Manchester, R. N., et al. 2002, ApJ, 569, 894