00 \Year0000 \Month00 \Pagespan000000 \lhead[0]A.N. S.F.Sánchez: The merging/AGN connection \rhead[Astron. Nachr./AN XXX (200X) X]0 \headnoteAstron. Nachr./AN 32X (200X) X, XXX–XXX
The merging/AGN connection: A case for 3D spectroscopy
Abstract
We discuss an ongoing study of the connection between galaxy merging/interaction and AGN activity, based on integral field spectroscopy. We focus on the search for AGN ionization in the central regions of mergers, previously not classified as AGNs. We present here the science case, the current status of the project, and plans for future observations.
keywords:
galaxies: active – galaxies: irregular – galaxies: nuclei – galaxies: starburstssanchez@aip.de
1 Introduction
It is known that interactions between galaxies can deeply affect their evolution and stellar populations. Interacting galaxies are more active in the UV ([Larson & Tinsley 1978]), in the near-infrared ([Joseph & Wright 1985]), in optical emission-line strength ([Kennicutt & Keel 1984]), and in radio emission ([Stocke 1978]; [Hummel 1981]). It is also known that ultraluminous infrared galaxies (ULIRGs), a class of objects with luminosities above 1012L⊙ in the Far Infrared (FIR), are interacting or merging systems ([Sanders et al. 1988]; [Clements et al. 1996]).
There is also growing evidence that merging processes could be the triggering/fuelling mechanism of AGN activity ([Canalizo & Stockton 2001]; [Jahnke 2002]; [Sánchez & González-Serrano 2003]). Some studies found that Seyfert galaxies are often interacting systems (e.g. [Keel et al. 1985]), although this is not always the case ([Dahari 1985]; [Bushouse 1986]). Quasars often inhabit rich galaxy environments and/or have nearby companions (e.g. [Sánchez & González-Serrano 2002]) and quasar hosts exhibit signs of encounters and mergers in the form of tidal debris and multiple nuclei ([Canalizo & Stockton 2001]; [Sánchez & González-Serrano 2003]). Merging and interactions appear to be an efficient process for transferring material to the inner kpc or even pc of a galaxy (e.g. [Mihos & Hernquist 1996]).
An evolutionary scenario has been suggested, in which major mergers between galaxies trigger intense star formation processes, and may allow the infall of gas into the nuclear regions. Both the AGN and the starburst heat the dust, and the object is observed as a ULIRG. It is known that ULIRGs have the same bolometric luminosities and space densities as QSOs, which supports the hypothesis of being their progenitors ([Sanders et al. 1988]). The presence of both starburst and AGN activity in ULIRGs naturally raises the question of their evolutionary connection. It is expected that a family of transition objects between ULIRGs and AGNs exists. These transition objects would be either AGNs with host galaxies showin strong evidence of recent interaction/merging or merging systems, luminous in the FIR, with strong star formation which harbor a faint AGN in the inner regions. This AGN could be obscured ([Sanders et al. 1988]; [Komossa et al. 2003]), or blurred by the surrounding star forming region ([Donzelli & Pastoriza 2000]; [Lutz et al., 1999]).
For the most violent cases of AGN activity, i.e., the QSOs, the results are not conclusive. Many authors claim to find possible interaction/merger traces in QSO hosts (e.g., [Hutchings et al. 1994]; [Bahcall et al. 1997]; [Sánchez & González-Serrano 2003]). However, Dunlop et al. (2003) show no evidence for a connection between ULIRGs and their sample of low- AGN hosts. Their hosts present a pure elliptical surface brightness profile, with no evidence of interactions, and they are located in a different region of the fundamental plane from the ULIRGs. This makes improbable an evolution from the latter to the former population based on merging processes. On the other hand, Canalizo & Stockton (2001) found via an imaging and spectroscopic analysis that all transition QSOs are undergoing tidal interactions or are major mergers. They selected their sample of QSOs to have similar FIR properties to the ULIRGs (see below). They conclude that at least a family of AGNs evolves from a ULIRG progenitor, formed by a merger of galaxies. It is still an open question whether the host galaxies of these transition QSOs evolve later to galaxies without trace of recent interactions, or if the two families are different.
2 The Project
We have started a project with the aim of looking for transition objects between merger galaxies and AGNs. We selected a sample of merging galaxies from the IRAS catalogue of 472 sources with known morphological properties ([JISWG 1998]; [Fullmer & Lonsdale 1989]). Of these, we have selected the 312 sources with published redshifts. This sample contains galaxies whose morphology shows evidences of recent merger events, i.e., tails, plumes, rings or other morphological features consistent with strong tidal interaction. These systems are being observed at late phases of the interaction, since severe morphological disturbances, such as long tidal tails, require 108 yr to develop ([Toomre & Toomre 1972]; [Mihos & Hernquist 1996]).
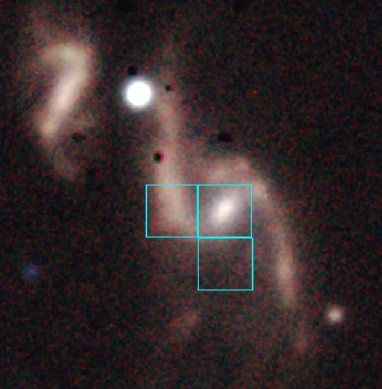
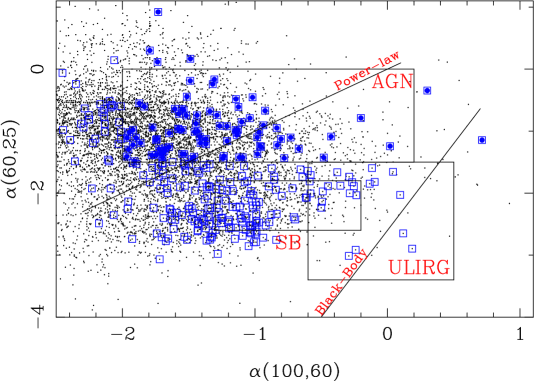
Figure 1 shows the distribution of far infrared (FIR) spectral indices for the IRAS catalogue ( vs. ), together with our selected sample (see below). We overplotted the location of the AGNs, ULIRGs and galaxies with large starformation rate (SFR) and the location of two typical spectral energy distributions of the FIR emission, power-law, typical for AGNs, and black-body thermal emission, typical for ULIRGs and galaxies with large SFR. The FIR emission is produced by dust that absorbs optical-UV flux produced by recently formed stars and/or AGNs. The close association of these stars (or AGNs) with the gas and dust from which they formed (or feed), assures that much of the luminosity of the group of young stars (or AGN) will emerge in the infrared. Therefore, the FIR emission traces the most violent processes of activity in galaxies ([Soifer et al. 1984]; [Kennicutt et al. 1987]; [Sanders et al. 1988]; [Bushouse et al. 1988]; [Sanders & Mirabel 1996]).
| IRAS Name | -mag | Class. | f12 | f25 | f60 | f100 | Instrument | |
|---|---|---|---|---|---|---|---|---|
| 10219-2828 | 0.02677 | 15.1 | Double | 0.25 | 0.93 | 4.82 | 5.78 | VIMOS LR Red |
| 10484-0153 | 0.01450 | 12.9 | Peculiar | 0.34 | 0.57 | 4.74 | 9.67 | VIMOS LR Blue/Red |
| 11096-4738 | 0.01438 | Double? | 0.36 | 0.25 | 0.66 | 1.80 | VIMOS LR Blue/Red | |
| 11500-0211 | 0.00345 | 14.1 | Peculiar | 0.28 | 0.34 | 1.01 | 1.00 | VIMOS LR Blue/Red |
| 12042-3140 | 0.02309 | Double | 0.29 | 0.73 | 7.30 | 12.39 | VIMOS LR Blue/Red | |
| 12110-3412 | 0.00924 | 14.2 | Double | 0.35 | 0.38 | 1.71 | 2.82 | VIMOS LR Blue/Red |
| 12110+1624 | 0.02379 | 14.8 | Mult. system | 0.40 | 0.27 | 0.52 | 1.13 | PMAS Mosaic V300 |
| 12193-3942 | 0.07454 | Double | 0.53 | 0.25 | 0.83 | 1.37 | VIMOS LR Blue/Red | |
| 12447-5316 | 0.00606 | Double? | 0.26 | 0.26 | 2.37 | 3.99 | VIMOS LR Blue/Red | |
| 12583-3619 | 0.01622 | 15.5 | Double? | 0.25 | 0.28 | 0.62 | 1.00 | VIMOS LR Blue/Red |
| 13031-5717 | 0.01961 | Double | 0.25 | 0.42 | 2.92 | 5.16 | VIMOS LR Blue/Red | |
| 13473-4801 | 0.01075 | Double? | 0.25 | 0.95 | 5.64 | 6.36 | VIMOS LR Blue/Red | |
| 13477-4848 | 0.01010 | 12.6 | Double? | 0.67 | 1.67 | 13.09 | 23.05 | VIMOS LR Blue/Red |
| 14442-1902 | 0.07403 | Double | 0.25 | 0.40 | 0.97 | 2.04 | VIMOS LR Blue/Red | |
| 15305-0127 | 0.00927 | 14.5 | S-Irregular | 0.25 | 0.27 | 0.84 | 2.28 | VIMOS LR Blue/Red |
| 16109+6042 | 0.01376 | 14.5 | Double system | 0.25 | 0.36 | 0.38 | 1.33 | PMAS Mosaic V300 |
| 16176-6325 | 0.01721 | Double | 0.35 | 0.79 | 3.86 | 5.21 | VIMOS LR Blue/Red | |
| 16229-6640 | 0.02179 | Triple | 0.27 | 0.50 | 4.73 | 9.53 | VIMOS LR Blue/Red | |
| 16330-6820 | 0.04697 | Double | 0.19 | 0.74 | 7.16 | 12.37 | VIMOS LR Blue/Red | |
| 16365+4202 | 0.02707 | 15.5 | Double system | 0.25 | 0.25 | 0.51 | 1.61 | PMAS Mosaic V300 |
Columns list: (1) the IRAS name of the object, (2) the redshift, (3) the -band magnitude, (4) the classification in the IRAS catalogue, (5-8) the IRAS flux at 12m, 25m, 60m and 100m and (9) the instrument/setup with which it was observed.
The degree of activity (SFR or AGN activity) increases with and the thermal emission ([Bushouse et al. 1988]). Therefore, we selected the 88 objects with warm emission in the far infrared in a similar way to Canalizo & Stockton (2001), but focused on the interacting systems, i.e. excluding all the objects previously classified as AGNs. The final sample comprises the interacting/merging objects with 2 and 1.5 111Spectral index defined as (solid squares on Fig. 1). We have started to study these objects using Integral Field Spectroscopy (IFS), looking for AGN activity and trying to understand the connection of this activity and galaxy merging/interaction.
There have been several attempts to disentangle the relation between galaxy interactions and galaxy activity (if any). Many of these studies were focused on the understanding of the triggering of starformation by tidal interaction ([Larson & Tinsley 1978]; [Kennicutt et al. 1987]; [Bushouse et al. 1988]; [Sanders & Mirabel 1996]), and most of them were based on optical/NIR imaging and slit-spectroscopy ([Kennicutt et al. 1987]; [Bushouse et al. 1988]; [Bushouse et al. 2002]; [Donzelli & Pastoriza 2000]). They all found an increase of the SFR for merger/interacting galaxies, especially in the nuclear regions (see [Bergvall et al. 2003] for a counter-example). The specific problem of the AGN/interaction relation has been partially addressed by these studies. Contrary to expectations, they found a deficiency of AGNs among interacting or merging systems compared to isolated galaxies ([Dahari 1985]; [Keel et al. 1985];[Bushouse et al. 1988]; [Donzelli & Pastoriza 2000]; [Sekiguchi & Wolstencroft 1992]; [Liu & Kennicutt 1995]). The fraction of AGNs increases with FIR luminosity, being about 30% for the extreme case of the ULIRGs ([Bushouse et al. 2002]).
The lack of AGN-like emission detected could be due to the fact that some of the galaxies have strong circumnuclear star-forming regions ([Keel et al. 1985]; [Kennicutt et al. 1987]; [Donzelli & Pastoriza 2000]). Therefore, the HII-region spectra would dilute the AGN spectra when the observations are made at a low spatial resolution, as is the case in nearly all the previous studies. Even in the case of good spatial resolution, the uncertainty of the location of the nucleus, makes slit spectroscopy a dangerous method to search for faint AGN activity possibly diluted by nearby star formation. This problem can easily be addressed by IFS. Our study will yield spatially resolved spectroscopic information of the objects, together with better spatial resolution than previous studies.
The number of IFS studies over representative samples of merger galaxies is small (e.g. [Chatzichristou et al. 1998]). To our knowledge, only one large systematic program is currently ongoing, focused on the study of the evolution of ULIRGs from cool and warm infrared emitters ([Arribas & Colina 2003], and references therein), and the overall properties of these objects. The different selection criteria for our sample, and the different focus, make the two studies complementary for the overall undertanding of the connection between interactions and AGN activity.
3 Current State of the Project
We have started an observational program using different telescopes and instruments, to obtain low-resolution IFS of a representative subsample of our selection. The wavelength ranges of interest are around H and H, in order to obtain line ratios (e.g. [O]/H and [N]/H) which allow us to determine the origin of the ionization ([Veilleux & Osterbrock 1987]). Dust extinction will be estimated from the H/H ratio. Fitting models to the strongest emission lines, spaxel to spaxel, would allow us to determine the kinematic 2D structure with an accuracy of 20 km s-1 (for low-resolution spectroscopy, 6Å). This accuracy is good enough to detect gas inflows/outflows induced by the interaction (on the order of 100-200 km s-1), which could trigger starformation/AGN activity in the nuclear regions (e.g. [Arribas & Colina 2002]).
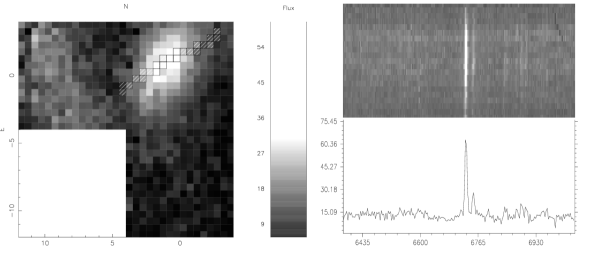
The average projected size of our objects is 40, larger than the field-of-view of actual Integral Field Units (IFUs), apart from VIMOS. This forces us to do mosaic pointings around the central areas. Figure 2 shows an example of this mosaicing technique. This true-color image of IRAS 12110+1624, was created using , and band images obtained with the PMAS A&G camera. This camera is a unique feature of PMAS, that allows one to obtain 33 field of view CCD images centred on the target ([Roth et al. 2000]). The three squares show the position of the PMAS mosaic pointings for the object. Figure 3 shows the same regions observed with the PMAS spectrograph as a polychromatic cut of the H region together with a pseudo slit-spectrum created by selecting certain spaxels across the central region of the object222We define spaxel as an spatial element of an IFU: lens, fiber, …. The data were reduced using P3d ([be01]). This figure, created using the Euro3D visualization tool ([Sánchez 2003]), shows the unique possibilities of IFS for the analysis of these objects. A complete analysis of these data will be presented elsewhere ([Sánchez et al. 2003]).
Table 1 summarizes the current state of the project. To date we have obtained IFS of 20 objects of the sample, 17 of them with VIMOS at the VLT, and 3 more observed using PMAS at the 3.5m CAHA telescope. We have 3 nights allocated on the WHT next semester for further observations using INTEGRAL ([Arribas et al. 1998]).
Acknowledgements.
This project is founded by the Euro3D Training Network on Integral Field Spectroscopy, funded by the European Commission under contract No. HPRN-CT-2002-00305. L.Christensen acknowledges support by the German Verbundforshung associated with the ULTROS project, grant no. 05AE2BAA/4.References
- [Arribas et al. 1998] Arribas S. et al.: 1998, Proc. SPIE, 3355, 821
- [Arribas & Colina 2002] Arribas S., Colina L.: 2002, ApJ, 573, 576
- [Arribas & Colina 2003] Arribas S., Colina L.: 2003, ApJ, 591, 791
- [Bahcall et al. 1997] Bahcall J. et al.: 1997, ApJ, 479, 642
- [Becker 2002] Becker T.: 2001, PhD Thesis, Potsdam Universität, Germany
- [Bergvall et al. 2003] Bergvall N., Laurikainen E., Aalto S.: 2003, A&A, 405, 31
- [Bushouse 1986] Bushouse H.A.: 1986, AJ, 91, 255
- [Bushouse et al. 1988] Bushouse H.A., Lamb S.A., Werner M.: 1988, ApJ, 355, 74
- [Bushouse et al. 2002] Bushouse H.A., Borne K.D., Colina L., Lucas R.A., Rowan-Robinson M., Baker A.C., Clements D.L., Lawrence A., Oliver S.: 2002, ApJSS, 138, 1
- [Canalizo & Stockton 2001] Canalizo G. & Stockton A.: 2001, ApJ, 555, 719
- [Chatzichristou et al. 1998] Chatzichristou E.T., Vanderriest C., Lehnert M.: 1998, A&A, 330, 841
- [Clements et al. 1996] Clements D.L. et al.: 1996, MNRAS, 279, 477
- [Dahari 1985] Dahari O.: 1985, ApJS, 57, 643
- [Donzelli & Pastoriza 2000] Donzelli C.J. & Pastoriza M.G.: 2000, AJ, 120, 189
- [Dunlop et al. 2003] Dunlop J.S., McLure R.J., Kukula M.J., et al.: 2003, MNRAS, 340, 1095
- [Fullmer & Lonsdale 1989] Fullmer L. & Lonsdale C.J.: 1989, Cataloged galaxies and quasars observed in the IRAS survey. Version 2.
- [Hummel 1981] Hummel E.: 1981, A&A, 96, 111
- [Hutchings et al. 1994] Hutchings J.B., et al.: 1994 ApJL, 429, 1
- [Jahnke 2002] Jahnke K.: 2002, PhD Thesis, University of Hamburg
- [JISWG 1998] Joint Iras Science Working Group, Infrared Astronomical Satellite Catalogs: 1998. The Point Source Catalog, version 2.0, NASA RP-1190
- [Joseph & Wright 1985] Joseph R.D. & Wright G.S.: 1985, MNRAS, 214, 87
- [Keel et al. 1985] Keel S.M., Kennicutt R.C., Hummel E., van der Hulst J.M.: 1985, AJ, 90, 708
- [Kennicutt & Keel 1984] Kennicutt R.C. & Keel S.M. : 1984, ApJ, 279, 5
- [Kennicutt et al. 1987] Kennicutt R.C., Keel S.M., van der Hulst J.M., Hummel E., Roettiger K.A.: 1987, AJ, 93, 1011
- [Komossa et al. 2003] Komossa S., Burwitz V., Hasinger G., Predehil P., Kaastra J.S., Ikebe Y.: 2003, ApJL, 582, 15
- [Larson & Tinsley 1978] Larson R.B. & Tinsley B.M.: 1978, ApJ, 219, 46
- [Liu & Kennicutt 1995] Liu C.T., Kennicutt R.C.: 1995, ApJSS, 100, 325
- [Lutz et al., 1999] Lutz D., Veilleux S., Genzel R.: 1999, ApJ, 517, L13
- [Mihos & Hernquist 1996] Mihos J.C. & Hernquist L.: 1996, ApJ, 464, 641
- [Roth et al. 2000] Roth M.M., Bauer S., Dionies F., et al.: 2000, in Proc. SPIE, Vol. 4008, 277-288
- [Sánchez & González-Serrano 2002] Sánchez S.F. & González-Serrano J.I.: 2002, A&A, 396, 773
- [Sánchez & González-Serrano 2003] Sánchez S.F. & González-Serrano J.I.: 2003, A&A, 406, 435
- [Sánchez 2003] Sánchez S.F.: 2003, AN, submitted
- [Sánchez et al. 2003] Sánchez S.F., Christensen L., Becker T., Kelz A., Jahnke K., Benn C.R., García-Lorenzo B.: 2003, A&A, in preparation
- [Sanders & Mirabel 1996] Sanders D.B., Mirabel I.F.: 1996, ARAA&A, 34, 749
- [Sanders et al. 1988] Sanders D.B. et al. : 1988, ApJ, 328, 35
- [Sekiguchi & Wolstencroft 1992] Sekiguchi K. & Wolstencroft R.D.: 1992, MNRAS, 255, 581
- [Soifer et al. 1984] Soifer B.T. et al.: 1984, ApJL, 278, 71
- [Stocke 1978] Stocke J.T.: 1978, AJ, 83, 248
- [Toomre & Toomre 1972] Toomre A., Toomre J.: 1972, ApJ, 178, 623
- [Veilleux & Osterbrock 1987] Veilleux S. & Osterbrock D.E.: 1987, ApJSS, 63, 295