Nuclear pasta structure in hot neutron stars
Abstract
Structure of cold and hot dense matter at subnuclear densities is investigated by quantum molecular dynamics (QMD) simulations. Obtained phase diagrams show that the density of the phase boundaries between the different nuclear structures decreases with increasing temperature due to the thermal expansion of nuclear matter region.
aDepartment of Physics, University of Tokyo, Tokyo 113-0033, Japan
bRIKEN, Saitama 351-0198, Japan
cNORDITA, Blegdamsvej 17, DK-2100 Copenhagen Ø, Denmark
dRESCEU, University of Tokyo, Tokyo 113-0033, Japan
eDepartment of Mechanical Engineering, Keio University, Yokohama 223-8522, Japan
At subnuclear densities, nuclear matter exhibits the coexistence of a liquid phase with a gas phase. Just below the density where nuclei melt into uniform matter, it is expected that, at sufficiently low temperatures ( MeV), the energetically favorable configuration of the mixed phase possesses interesting spatial structures such as rodlike and slablike nuclei, etc., which are called nuclear “pasta” (Hashimoto, Seki, & Yamada 1984; Ravenhall, Pethick, & Wilson 1983). While nuclear “pasta” at zero temperature is studied by several authors, “pasta” phases at finite temperatures relevant to supernova cores and crusts of young hot neutron stars have not been studied yet except for some limited cases (Lassaut et al. 1987; Watanabe, Iida, & Sato 2000, 2001, 2003).
In the present work, we study the structure of hot dense matter at subnuclear densities by QMD. Simulations of the system at proton fraction and 0.5 are performed with 2048 nucleons in a cubic periodic box. The relativistic degenerate electrons are regarded as a uniform background and the Coulomb interaction is calculated by the Ewald method. The effective Hamiltonian used in this work is that developed by Maruyama et al. (1998).
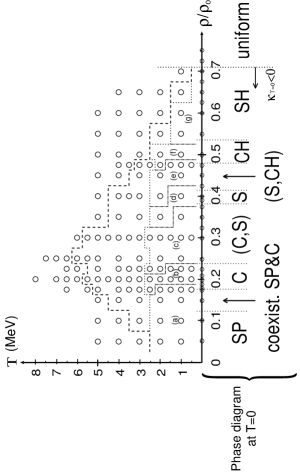
We show the resultant phase diagram for on the nucleon density vs temperature plane in Fig. 1. Phase separation line is determined by disappearance of the long-range correlation of the nucleon distribution detected by the two-point correlation function. Nuclear surface is identified by plateau of the Euler characteristic density as a function of threshold density for isodensity surface. In the density region of interest, nuclear surface cannot be observed typically at MeV, even in the phase-separating region. At temperatures where nuclear surface can be identified, we characterise the nuclear shape changes with increasing the density by using averaged mean curvature and : (a) (b) (c) (d) (e) (f) (g) uniform. Critical point for the phase separation locates at and MeV. It is noted that the density of each phase boundary between the different structures decreases as increases, which is due to the thermal expansion of the nuclear matter region.
Our result suggests that the “pasta” phases, and in addition, “spongelike” phases with negative values of exist in hot neutron star crusts and supernova cores at MeV.
References
Hashimoto, M., Seki, H., & Yamada, M. 1984, Prog. Theor. Phys., 71, 320
Lassaut, M., Flocard, H., Bonche, P., Heenen, P. H., & Suraud, E. 1987, A&A, 183, L3
Maruyama, T., Niita, K., Oyamatsu, K., Maruyama, T., Chiba, S., & Iwamoto, A. 1998, Phys.Rev.C, 57, 655
Ravenhall, D. G., Pethick, C. J., & Wilson, J. R. 1983, Phys.Rev.Lett, 50, 2066
Watanabe, G., Iida, K., Sato, K. 2000, Nucl. Phys. A676, 455; 2001, Nucl. Phys. A687, 512; 2003, Nucl. Phys. A726, 357
Watanabe, G., Sato, K., Yasuoka, K., & Ebisuzaki, T. 2002, Phys.Rev.C, 66, 012801(R); 2003, Phys.Rev.C, 68, 035806 (nucl-th/0308007)