THE ANGULAR MOMENTUM EVOLUTION OF 0.1-10 M⊙ STARS FROM THE BIRTHLINE TO THE MAIN SEQUENCE
Abstract
Projected rotational velocities (vsini) have been measured for a sample of 145 stars with masses between 0.4 and 10 M⊙ (median mass 2.1 M⊙) located in the Orion star-forming complex. These measurements have been supplemented with data from the literature for Orion stars with masses as low as 0.1 M⊙. The primary finding from analysis of these data is that the upper envelope of the observed values of angular momentum per unit mass (J/M) varies as M0.25 for stars on convective tracks having masses in the range 0.1 to 3 M⊙. This power law extends smoothly into the domain of more massive stars (3 to 10 M⊙), which in Orion are already on the ZAMS. This result stands in sharp contrast to the properties of main sequence stars, which show a break in the power law and a sharp decline in J/M with decreasing mass for stars with M < 2 M⊙. A second result of our study is that this break is seen already among the PMS stars in our Orion sample that are on radiative tracks, even though these stars are only a few million years old. A comparison of rotation rates seen for stars on either side of the convective-radiative boundary shows that stars do not rotate as solid bodies during the transition from convective to radiative tracks.
As a preliminary demonstration of how observations can be used to constrain the processes that control early stellar angular momentum, we show that the broad trends in the data can be accounted for by simple models that posit that stars: 1) lose angular momentum before they are deposited on the birthline, plausibly through star-disk interactions; 2) undergo additional braking as they evolve down their convective tracks; and 3) are subject to core-envelope decoupling during the convective-radiative transition.
1 INTRODUCTION
Substantial progress has been made over the past several years in characterizing the evolution of angular momentum of low mass (M < 0.5 M⊙) pre-main-sequence (PMS) stars as they evolve toward the main sequence (e. g. Herbst, Bailer-Jones, & Mundt 2001; Rebull 2001 and references therein). In this paper, we report new observations of angular momentum in intermediate-mass PMS stars in the mass range 0.4-3 M⊙ and ZAMS stars for a coeval population at masses 4 M⊙, ranging up to 10 M⊙. Our first goal is to establish for stars in this mass range the values of angular momentum (J) for stars with ages of < 1 Myr, which we will take as an estimate of the initial angular momentum. Our second goal is to compare these values with older stars to examine how angular momentum changes as a function of time.
To place our observational results in context, we will adopt what has become the standard framework for early stellar evolution, i.e. that stars acquire a significant fraction of their final mass through rapid accretion via disks. If protostars end the phase of rapid accretion quickly, that is on a time scale that is short relative to the time scale for contraction, then it is possible to derive a relationship between mass and radius and to use this relationship to define a locus of points in the temperature-luminosity plane where the rapid accretion stops, stars become visible, and begin their quasi-static contraction to the main sequence. This locus is the birthline (Stahler 1983). Stars may then continue to accrete material at a low rate as they evolve from the birthline down convective tracks.
Stars that form as a result of accretion of high angular momentum material through a disk should in principle be rotating at nearly the breakup speed (Durisen et al. 1989), but the typical rotational velocities of the youngest visible stars are instead observed to fall an order of magnitude or so below this critical velocity (Stauffer & Hartmann 1986; Rhode et al. 2001). The low rotational velocities have been explained by positing that stars are locked to their surrounding disks via magnetic fields and that the disk applies a braking torque (Uchida & Shibata 1984; Königl 1991; Shu et al. 1994). Therefore, a second key element of the overall framework is that accreting protostars lose angular momentum through interaction with an accretion disk before they arrive at the birthline.
In order to account for subsequent changes in angular momentum and surface rotation as PMS stars evolve from the birthline onto the main sequence, a number of additional factors must be taken into account: 1) continued loss of angular momentum via coupling to disks at the lower accretion rates characteristic of T Tauri stars; 2) changes in the moment of inertia as a result of changes in stellar radius and internal structure; and 3) possible decoupling within the star between rotation of its core and rotation of its envelope.
In the sections that follow, we first describe observations designed to determine the angular momenta of extremely young intermediate mass stars. These data provide an estimate of the initial angular momentum as a function of mass. We then compare these observations with older stars and with the above theoretical framework in order to learn whether these basic ideas can account for the observed changes in stellar rotation as a function of time and mass.
2 OBSERVATIONS
2.1 Sample Selection
An ideal sample for our purposes is one that (1) contains a statistically significant number of young stars having M > 0.5 M⊙; and (2) includes objects born in multiple star-forming episodes so that stars of identical mass can be observed in a variety of evolutionary states. The Orion OB association is one of the nearest star-forming regions that satisfy these criteria. The ages of the stars in this region range from less than 1Myr to 10 Myr (Walker 1969; Warren & Hesser 1978; Brown, deGeus, & deZeeuw 1994; McNamara, et. al. 1989).
A sample of stars brighter than magnitude B=14 with proper motion membership probabilities larger than 50% was selected from the studies of McNamara et al. (1989), van Altena et al. (1988), and Jones & Walker (1988). This sample is spread over a diameter of about 2.75 degrees located within the Orion Ic/Id association.
For each sample object, we require photometric and spectroscopic data sufficient to determine: (1) the star’s location in the HR diagram; (2) its projected rotational velocity; (3) whether or not the star is surrounded by a circumstellar accretion disk, which might “lock” a star to a fixed rotation period (e.g. Königl 1991); and (4) whether or not a star is a short-period spectroscopic binary in which each member’s rotational velocity could be tidally locked to the orbital velocity.
We obtained spectra of resolution and wavelength coverage sufficient to determine spectral types and also to measure projected rotational and radial velocity values. We also obtained near-infrared photometry (JHK), which in combination with derived spectral types and extant optical photometry enables estimates of excess emission above photospheric levels and serves as a diagnostic of circumstellar accretion disks. We culled from the literature optical (UBVI) photometry as well as spectral types and vsini for a few stars for which we obtained IR photometry but no spectroscopy.
The databases for our sample are given in Tables 1 and 2. In general, Table 1 includes the observations, while Table 2 includes such derived quantities as visual extinction (AV), effective temperature (Teff), luminosity (Lbol), radius (R), moment of inertia (I), mass (M), age (A), and infrared excess (). The entries in the tables are described in the sections that follow.
2.2 Spectroscopic Measurements
High-resolution (R20,000) spectroscopic data were obtained in November 1992 and January 1993 with the Hydra multi-object spectrograph mounted on the KPNO 4-m telescope. The “heart of Hydra” is a robotic fiber-positioning device that permits the observer to locate as many as 97 fibers at locations within a 45 arc minute field to sub-arcsecond precision. Typically, we were able to optimize fiber placements to enable simultaneous observation of 40 to 60 object spectra and 30 to 40 sky spectra. Priority in the assignment of fibers was given to Orion stars that had been shown to have excess emission at near infrared wavelengths by our JHK photometry. Two echelle settings with a spectral range of were used. The first was centered at 4450 and included He I 4471 and Mg II 4481. The second was centered at 4861 and included the H line. Spectra centered on the He/Mg region enable rotational velocity measurements for stars spanning a wide range in spectral type, while those centered on H provide a complementary measure of rotational velocity for stars of type A5 and later.
Our observing strategy was to obtain the He/Mg and the H settings on different nights of the observing runs in order to enable the identification of spectroscopic binaries via radial velocity variations. On each night, the data were obtained in two steps, first by taking a series of exposures with the telescope and fibers aligned on our target positions, and then by offsetting the telescope by 5 arcsec to obtain a “sky” exposure. This procedure (as opposed to the more standard practice of achieving sky subtractions by averaging several “sky” fibers) was necessitated by the large and spatially variable background of the Orion Nebula, which was assessed empirically via comparison between sky fibers from “on-target” to “offset” telescope positions.
We also obtained spectra of a grid of relatively bright stars to be used as rotational velocity standards. For spectral types later than A0 these were stars in the Pleiades cluster (Anderson, Stoeckly, & Kraft 1966) and field stars (Soderblom, Pendleton, & Pallavicini 1989) for which accurate rotational velocities are known. For hotter stars, the standards were taken from Slettebak, et al. (1975).
The Hydra data were reduced with the IRAF script dohydra developed by Frank Valdes at NOAO. The first step in the reduction procedure requires removal of a low spatial frequency pattern, which is superposed on the spectra and results from the summed contributions of light emerging from the object and sky fibers and then scattered by the optical train. The scattered light background is removed using the IRAF task apscatter by (1) measuring its contribution outside the regions occupied by object and sky spectra; (2) fitting a two-dimensional surface to the scattered light pattern; and (3) subtracting the surface fit.
The next steps involve extraction of the object and sky spectra and wavelength calibration. The latter step is accomplished by extracting spectra of a Th-Ar arc source taken with the same fiber configuration used to record stellar and sky spectra and deriving individual dispersion solutions for the arc spectrum corresponding to each fiber. The resulting wavelength vs. pixel fits are then applied to the intensity/pixel relationship for the corresponding object or sky spectrum. The final step requires subtraction of a sky spectrum from each object spectrum. Typical sky corrections were less than 10% of the stellar signal even for the faintest stars in our sample. The resulting typical signal-to-noise per resolution element is between 30 (for the faintest stars) and 150 (for the brightest stars).
Spectral types were derived via comparison with our grid of spectral standards. For stars of types mid-G and earlier, our classifications enable placement on a standard sequence to within 1 subclass. For stars of later type (which are also fainter on average), the uncertainties are somewhat higher, perhaps 2 subclasses on average, owing to the difficulties inherent in classifying spectra for which the number of decisive classification features contained within the relatively short wavelength span sampled is small and for which the S/N ratio is modest (30/1).
Rotational and radial velocities were measured with a cross-correlation technique. By cross-correlating an object spectrum of unknown line width with that of a template spectrum of known line width (usually taken to be a slowly rotating star with vsini smaller than the instrumental resolution), one can measure the width of the resulting cross-correlation function. The width of this function is proportional to broadening introduced by rotation and thus to vsini. Tonry & Davis (1979) originally developed this technique in an astronomical context in order to derive velocity dispersions in galaxies. The IRAF rv package contains a script fxcor which incorporates the Tonry and Davis formalism.
Our observations span a very wide temperature range, and the appearance and particularly the density of absorption lines changes dramatically over this spectral range. Therefore, we have used spectral type dependent techniques to estimate apparent rotational velocities.
For stars with spectral types earlier than A5, where the number of lines contained within our spectral windows is too small to enable accurate vsini and v(radial) measures from cross-correlation techniques, projected rotational velocities were obtained via visual comparison with artificially broadened slowly rotating templates of comparable spectral types (from O9-A5) and crosschecking with standard stars having known rotational velocity. Radial velocities were obtained from measurements of line centroids and then placed on the internal HYDRA system for the later-type stars from comparison of radial velocity values derived from line centroids and cross-correlation peak measurements for a selection of stars in the spectral type range A5 to F5. Our estimated uncertainty in vsini for stars A5 and earlier is 50 km/s, for typical vsini values 100-200 km/s. Our estimated uncertainty in v(radial) is 10 km/s. To be listed as a candidate spectroscopic binary, a star with spectral type A5 or earlier must have a velocity which differs by 20 km/s from the cluster mean.
For stars later than A5, the first step in our procedure was to fit a function to the stellar continuum level and subtract this function from both the object and the template spectra. We then filtered the object and template spectra with a function tailored to reject low spectral frequencies (i.e. contributions to the power spectrum deriving from broad blends of atomic or molecular features). For the F, G, and K stars in our sample for which the rotational velocities were typically vsini < 100 km/s, we rejected frequencies corresponding to features with widths 200 km/s or greater; the expectation that the line widths were less than 200 km/s was verified by visual inspection of the spectra. For the A stars in our sample, we used a filter that rejected only those features with widths 400 km/s or greater. The object and template spectra were then cross-correlated. By fitting a gaussian to the resulting function, we determined both its peak (which measures the relative radial velocity of object and template stars) and its full-width half-maximum (which provides a measure of the rotational velocity of the object). This procedure closely follows that described by Hartmann et al. 1986, who used a similar technique to derive rotational velocities for solar-type PMS stars.
In practice, we chose a template star, SAO 217014 (G5 V; vsini < 5 km/s), which was used as the cross-correlation template for all object stars with spectral types F0-K5. For stars with 2 or more independently measured spectra, the agreement between the full-width half-maxima (FWHM) of the best-fit gaussians to the cross-correlation function is generally better than 5% for FWHM < 60 km/s and better than 10% for broader lines.
The relationship between FWHM and projected rotational velocity for the stars later than A5 is established via comparison with published vsini values for the Pleiades stars included in our Hydra sample. Figure 1 shows the relationship between FWHM and vsini for the 34 stars used to establish the functional relationship between these quantities. With the exception of three obviously discrepant points, the scatter about the adopted calibration curve is <10% at all values of vsini. We estimate typical precision of 20 km/s and 3 km/s for rotational and radial velocities, respectively, for stars of spectral type A5 and later.
Our measurements of vsini are listed in Table 1 along with previous measurements by other authors. A number of the stars have been measured in other studies, but in order to make the data set as homogenous as possible, we have adopted (see Table 2) our own measurements of vsini rather than averaging our measurements with those in the literature. We have, however, supplemented our data by using values of vsini from the literature for a few stars for which we had photometry (see below) but no spectroscopy. In adopting values from the literature we have confined ourselves to a few large datasets (see the notes in Table 2) that had some stars in common with the current survey and for which there was good agreement with our measurements.
Our data set also permits a search for spectroscopic binaries. Because Hydra records spectra for a large sample of cluster members simultaneously, we can compare the velocities derived from the location of the cross-correlation peak for each star with the mean velocity for all stars in a given Hydra exposure. We tested this procedure for our Pleiades cluster standard stars of spectral types A5 and later and find that the scatter about the mean is typically 2.5 km/s (1 ) for these high S/N spectra. For our Orion data, the scatter is 4 km/s. Stars in our sample with spectral types A5 and later that deviate by more than 2 (8 km/s) from the mean in any of our Orion sample Hydra exposures are tagged in column 15 of Table 1 as candidate spectroscopic binaries, along with the observed range in velocity in km/s. We emphasize that confirmation of candidates as true spectroscopic binaries (as opposed to field star interlopers sharing the proper motion but not the radial velocity of the Orion association) will require additional observations.
The 12 candidate binaries include convective as well as radiative stars and both high and low mass objects. The binaries do not occupy a special location in any of the diagrams relating angular momentum to mass. Accordingly, we do not treat them separately in the discussion that follows.
2.3 Infrared Observations
In planning our overall program, we believed that IR measurements might lead to discovery of a significant number of disks around the stars in our sample. The quantity (H-K), the difference between reddening-corrected H-K color and underlying photospheric color, provides a strong discriminant between disked and diskless stars (Hillenbrand, et al. 1992; Edwards et al. 1993; Hillenbrand et al. 2004, in preparation).
Near-infrared (JHK) observations were obtained for several hundred stars in the Orion Ic/Id association that met the proper motion criteria defined above. The observations were made in November and December, 1991 with the OTTO photometer mounted on the KPNO 50-inch telescope. The data were taken using a standard beam-switching pattern (source/sky/sky/source) through a 15 arcsec beam with a 30 arcsec throw. Calibration was performed with the standards of Elias et al. (1982), thus placing the data on the CIT photometric system within color terms of order 5% (Kenyon 1988). Some measurements were adopted from the SQIID and NICMASS imaging photometry described by Hillenbrand, et al. (1998). The infrared data are summarized in Table 1.
Values of (H-K) are listed in Table 2; stars with (H-K) 0.1 mag are considered disk candidates. Our results show that only 20% of the stars in our sample show excesses this large and only 14 of these stars lie on convective tracks where we might expect the stellar magnetic fields required for disk-locking to be present. Given the small number of stars with excesses, it was impossible to effect a statistically meaningful comparison of N(vsini) between stars which show, and those which lack, inner accretion disk signatures, given the broad intrinsic range of rotational velocities characterizing stars in this mass range. While we have made no further use of the IR data, we provide the measurements here for completeness.
2.4 Optical Photometry
The optical measurements in Table 1 were culled from the literature (Walker 1969; Warren & Hesser 1977; Penston 1973; McNamara 1976; Rydgren & Vrba 1984; Penston, Hunter, & O’Neill 1975; McNamara et al. 1989). Measurements of I magnitudes and V-I colors are available for a subset of the sample, largely from the study by Hillenbrand (1997), but also from the above references, which have been converted from Johnson to Cousins system photometry.
2.5 Effective Temperatures and Stellar Luminosities
Effective temperatures are listed in Table 2 and were derived from the spectral types listed in Table 1 and the effective temperature scale of Chlebowski & Garmany (1991) for O-type stars and Humphreys & McElroy (1984) for B0-B3 stars. For stars with later spectral types, we used the temperature scales of Cohen & Kuhi (1979) and Bessell (1991). We estimate typical uncertainties in log Teff to be 0.05 for stars A5 and earlier; 0.03 for stars A5 to G5; and 0.02 for stars G5 to K5.
For low mass PMS stars of type K and later, veiling emission at V-band can be significant, and it is preferable to use I- or J-band measurements to derive luminosities. For stars in the current sample, which have much earlier spectral types, veiling contributions at V-band are negligible. Therefore, in order to derive stellar luminosities, we first derive extinction estimates, Av (Table 2), based on spectral types and the observed B-V colors compared to intrinsic stellar colors (Johnson 1966). Next, we derive apparent bolometric luminosities from reddening-corrected V magnitudes and bolometric corrections tabulated by Code, et al. (1976); Massey, Parker, & Garmany (1989); and Bessell (1991). The bolometric corrections for the PMS stars in our sample are all less than 0.25 mag. We estimate that the standard errors in apparent bolometric magnitude are 0.15 magnitude.
Conversion of apparent bolometric magnitude to luminosity requires a distance modulus. Studies of the Orion association suggest that members of the star-forming complex may span distances ranging from 350 to 500 pc (Brown, et al. 1994). Most of the stars comprising our sample fall in two well-studied regions of the association: Orion Id, a region of size 2pc centered on the Trapezium cluster, and Orion Ic, also centered on the Trapezium but extending 10 pc in projection from 1C. The best distance estimates for these sub-regions of the association are 480 pc for Orion Id (based on water maser proper motion and radial velocity measurements; Genzel & Stutzki 1989) and 400 pc for Orion Ic (based on careful photometric study of ZAMS B-stars; Warren & Hesser 1978). Assignment of a sample star to the Orion Ic or Id subregions (see column 20 of Table 1) is based on its projected location on the plane of the sky in relationship to the Ic/Id boundaries delineated in the map published by Warren & Hesser (1977). This procedure means that a modest fraction of the stars assigned as Id could actually be Ic stars seen in projection on Id.
The values of log L listed in Table 2 have estimated uncertainties of 0.2 dex, resulting from uncertainties in the assigned distances, temperatures, and bolometric corrections. Given values of log L and Teff, we can derive the stellar radius, which is also given in Table 2.
2.6 Masses, Ages, and Moments of Inertia
The luminosities and effective temperatures listed in Table 2 enable determination of masses, ages, and stellar moments of inertia via comparison with PMS evolutionary tracks. The tracks published by Swenson et al. (1994; hereafter SFRI) are used here because (1) they span the range of masses encompassed by our sample; (2) they include not only luminosity (L) and effective temperature (Teff) but also moments of inertia (I) as a function of age; and (3) they provide the best matches to open cluster loci (Hillenbrand, 2004, in preparation). The derived values of mass (M), age (log A), and moment of inertia (log I) are listed in Table 2. Based on the values of L and Teff and the evolutionary tracks, we also specify whether the star is on the convective (C) or radiative (R) portion of its evolutionary track, or at the convective/radiative transition (C/R) in column 9.
Uncertainty in transforming Lbol and Teff to mass and age for PMS stars is dominated by systematic effects between different sets of pre-main sequence evolutionary tracks, rather than by random errors associated with the luminosity and Teff derivations. Unfortunately there are few model-independent determinations of masses for stars above the ZAMS (e.g. Mathieu et al. 2000). We also note that the SFRI tracks do not take into account the effects of accretion during early PMS phases. Accretion can dramatically alter both the evolutionary path of PMS stars and the radius at which a star of a given final mass joins conventional PMS tracks. In particular, accreting PMS stars follow paths (birthlines) roughly parallel to the ZAMS, at distances above the ZAMS that depend on the mass accretion rate (e.g. Palla & Stahler 1992). For example, a young star can in principle reach the same point in the HR diagram (a) by following a high accretion rate birthline at large radius and then contracting toward smaller radii along a conventional convective track; or (b) by following a low accretion rate birthline that deposits it directly at relatively low radius. Because of the different possible approaches to the main sequence, the ages assigned to non-accreting PMS stars and both the ages and masses assigned to accreting PMS stars from comparisons of observed luminosities and effective temperatures with conventional tracks should be regarded with caution.
3 THE RELATIONSHIP BETWEEN SPECIFIC ANGULAR MOMENTUM AND MASS
3.1 Overview
Our measurements of the Orion stars provide for the first time a snapshot of the distribution of angular momenta among a sample of very young (1-10 Myr) stars, presumably formed under similar initial conditions, spanning a mass range from less than 1 M⊙ to slightly more than 10 M⊙, and including a sample of fully convective stars with masses in the range 1-2 M⊙. The mean and median masses within our sample are 2.9 and 2.1 M⊙. These data allow us to assess systematic trends in stellar angular momenta with mass and time.
In this section we first plot our entire sample in the HR diagram and describe the systematic trends between surface rotational velocity and mass. We then separate the data into two groups: 1) those stars that are still on their convective tracks and provide us with the best estimates of the initial values of specific angular momentum (J/M); and 2) more evolved stars that are on PMS radiative tracks or on the main sequence. We then compare the observationally derived initial values of J/M with those of stars at later phases of their evolution and identify the processes that most plausibly control the evolution of angular momentum.
3.2 The Data
Figure 2 summarizes the rotation data for the Orion stars observed as part of this survey. We see that the distribution of stars in the HR diagram is what we expect for objects that range in age from less than one million years to nearly ten million years. The more massive stars (M > 4 M⊙) are already on the main sequence. Intermediate mass stars (2 M⊙ < M < 4 M⊙) occupy a variety of positions along the radiative tracks; theory (e.g. Palla & Stahler 1992; Behrend & Maeder 2001) predicts that, depending on the accretion rate, stars with M > 2-4 M⊙ will already be radiatively stable when they reach their birthlines and begin quasi-static contraction. Most of the Orion stars with M < 2 M⊙ are still on their convective tracks.
3.3 Specific Angular Momentum as a Function of Mass
The specific angular momentum of a star is given by the relationship
| (1) |
where J is the total angular momentum, M is the mass of the star, I is the moment of inertia, and is the angular velocity. What we measure is vsini, and so we can calculate only Jsini. For a large sample of stars and a random distribution of axes, J = (4/)Jsini (for derivation see Chandrasekhar & Munch 1950).
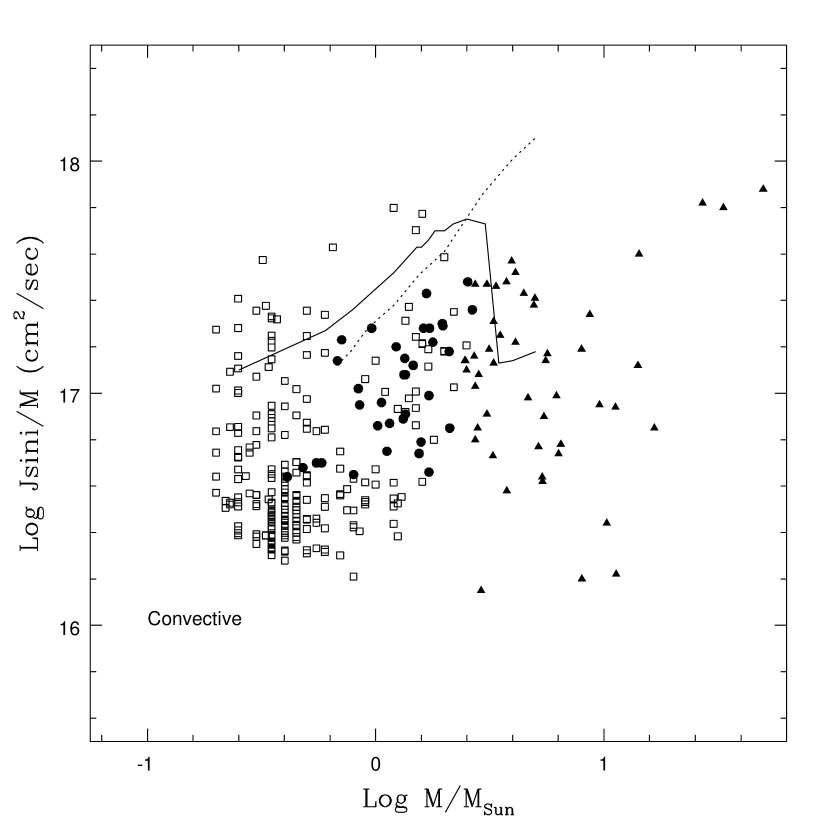
Figure 3a shows the plot of projected specific angular momentum as a function of mass for stars that are still on their convective tracks along with stars hotter than log Teff = 4.0, which are already on the ZAMS. To extend the data to lower masses, we have also plotted Jsini values derived from the vsini study of low mass ONC stars on convective tracks by Rhode, Herbst, & Mathieu (2001). We have used the SFRI models to derive values of I for each of their stars.
PMS stars on convective tracks rotate well below the critical velocity where centrifugal and gravitational forces balance—the so-called breakup velocity. To show this, we have plotted in Figure 3a the specific angular momentum that corresponds to rotation at the critical velocity for stars on the Palla & Stahler (1993) birthline (hereafter, the PS birthline). The PS birthline intersects SFRI convective tracks for masses below 3 M⊙ and intersects radiative tracks for masses above 3.5 M⊙. The discontinuity in the breakup velocity curve for stars on the birthline with masses between 3 M⊙ and 3.5 M⊙ comes about because I, the moment of inertia, becomes significantly smaller once stars join their radiative tracks, at which point they become much more centrally condensed.
Figure 3a shows that there is a fairly smooth and slowly varying upper bound to Jsini/M defined by fully convective stars with masses less than 2.5 M⊙; since these stars are expected to rotate as solid bodies, their surface rotation rates should reflect true values of J. This upper bound then merges continuously with the upper bound determined by higher mass stars that have already reached the ZAMS. The five stars that lie well above the upper bound shown in Figure 3a also lie at the tops of their convective tracks and are more luminous than most of the other Orion stars in our sample. It may be that, because of depth effects in the cluster, the luminosities and hence the radii and angular momenta of these five stars are overestimated or it may be that they are indeed very young and rotating more rapidly than the remaining Orion stars (see the discussion in Section 6).
There is about an order of magnitude scatter below the upper bound shown in Figure 3a. The scatter is too large to be accounted for by projection effects alone because there is only a 14% chance of observing a rotation rate that is less than 50% of the true equatorial velocity. Physical factors that may also contribute to the observed scatter are discussed in Section 4.
Kraft (1970) looked at a sample of mature main sequence stars and found that a power-law describes the relationship between <J/M> and M for main sequence stars with M > 2 M⊙ (but not those with smaller masses). Specifically, he found that <J/M> varies as M0.57, and this relationship is referred to as the “Kraft law.” Kawaler (1987) found the same basic relationship but with <J/M> proportional to M1.02. Kraft and Kawaler both found a marked steepening in the slope below about 2 M⊙. In Figure 3a we see that the power law relationship for PMS stars on convective tracks extends to masses at least as low as 0.1 M⊙. The slope of the relationship for PMS convective stars does not change at 2 M⊙ and the value of the slope is about 0.25, somewhat shallower than found by Kraft for main sequence stars with M 2 M⊙.
Figure 3b shows the same plot, but this time for Orion stars that are either on their PMS radiative tracks or on the ZAMS. Orion is not old enough to contain stars with M < 1 M⊙ on radiative tracks. (The data for ZAMS stars with log Teff > 4.0 are repeated from Figure 3a.) We have 42 stars in Orion with M > 3 M⊙, which is a small number to define the average behavior over a large mass range, and these stars may not be fully representative, including as they do at least one He-strong magnetic star (HD 37017) and several other peculiar and emission line stars. Therefore, we also show in Figure 3b the average values of <Jsini/M> for larger sample of main sequence field stars as a function of mass. We obtained these values by using <vsini> data from Abt, Levato, & Grosso (2002), Abt & Morrell (1995), and Wolff & Simon (1997); moments of inertia from the SFRI models for ZAMS stars (we extrapolated these models to obtain I for masses > 5 M⊙); temperatures derived from spectral types for the B- and early A-type stars (Cox 2000); and masses as a function of temperature from the models of SFRI and Maeder & Meynet (1988). For the F-type stars, we adopted the calibrations used by Wolff and Simon.
¿From Figure 3b we see that the PMS stars on radiative tracks in Orion scatter fairly reasonably around the mean values for field stars (see also Figure 3c). There is also a strong similarity in the overall behavior of the Orion PMS stars on radiative tracks and the main sequence field stars. Both groups show a relatively slow decline in specific angular momentum over a mass range of a factor of 10 (from 30 to 3 M⊙). From 3 M⊙ to about 1 M⊙ (Orion) or 1.4 M⊙ (field stars), the specific angular momentum declines by an additional order of magnitude for both groups. Below about 1.4 M⊙, but not at higher masses, stars are believed to lose angular momentum through magnetic winds during the first several hundred million years after they reach the ZAMS (e.g. Kraft 1970; Wolff and Simon 1997), and so the slope for M < 1.4 M⊙ depends on the age of the main sequence stars in the sample. Comparison of PMS stars with main sequence field stars at M < 1.4 M⊙ is therefore not relevant.
These trends in angular momentum as a function of mass are well known for main sequence stars. What is new here is the discovery that the overall trend of steep decline in average values of angular momentum for masses between 1 and 2 M⊙ is already present in PMS stars on their radiative tracks and that are typically no more than a few million years old. As Wolff and Simon (1997) suspected from their study of main sequence stars, an overall decline in angular momentum along the main sequence from 2 M⊙ to at least 1 M⊙ is apparently imposed during the PMS phase of evolution, and this pattern changes little during subsequent main sequence evolution. This point is illustrated more clearly in Figure 3c, which magnifies the critical region of Figure 3b. Here we see that with decreasing mass below 2 M⊙ both the Orion PMS stars on radiative tracks and the field stars fall progressively farther away from the power law relationship that described the upper bound for PMS convective stars (Figure 3a).
In the sections that follow, we compare the data in Figure 3a on initial angular momenta with a very simple model of star formation to illustrate the feasibility of using angular momentum as an additional constraint on such models. We then examine what physical processes might account for the changes in angular momentum as stars evolve from their convective tracks, as seen in Figure 3a, onto their radiative tracks, as seen in Figure 3b.
4 INITIAL ANGULAR MOMENTUM: A CONSTRAINT ON MODELS OF STAR FORMATION
The continuity of the upper bound for J/M in Figure 3a suggests that the origin of stellar angular momenta is likely similar for stars with masses spanning at least two orders of magnitude, from 0.1-10 M⊙. To illustrate the feasibility of relating this observation to theories of star formation, we consider the implications of one very simple model, which attributes the observed slow rotation of PMS stars to a magnetic field that is rooted in the central star and intercepts the disk (e.g. Königl 1991). The net consequence of this star-disk interaction is that stellar angular velocity will be locked to the Keplerian angular velocity at a co-rotation radius until the accretion phase ends and the star is deposited on the birthline. According to Königl, the angular velocity of a star locked to its disk is given by:
| (2) |
where < 1 is the ratio between the stellar angular velocity and the Keplerian velocity at Rin, i.e. at the radius where the disk is disrupted. This radius in turn is given by
| (3) |
where is a parameter less than or equal to 1 (with = 1 corresponding to the classical Alfven radius for spherical accretion), is the stellar dipole moment, and is the mass accretion rate. Using these equations plus the relationship that the surface magnetic field B = /R3, we then find that
| (4) |
In order to evaluate this expression, we must make a number of assumptions. If we set = = 1, then we will obtain an upper limit for J/M. We used the SFRI models to obtain values of I and R at the birthline. Since these models do not extend above 5 M⊙, we have not calculated J/M beyond this mass limit. We have adopted B = 2500 G, which is typical of the limited measurements to date for T Tauri stars (e.g. Guenther, et. al. 1999; Johns-Krull, Valenti, & Koresko 1999). The number of observational constraints on this assumption is minimal (magnetic fields have been measured in fewer than 10 T Tauri stars). However, the observed constancy of magnetic field surrogates, such as Lx/Lbol, over a wide range of PMS star rotation rates (Feigelson et al. 2003) suggests that this assumption may be acceptable as a first guess.
We have carried out the calculation for two birthlines. The first is the PS birthline for (Palla & Stahler 1993). The second was calculated by Behrend & Maeder (2001), which we will refer to as the BM birthline, and is parameterized in terms of luminosity. The BM birthline yields results very close to a birthline (Norberg & Maeder 2000) calculated for an accretion rate given by , whichever is larger.
The comparison of the predicted values of J/M with the observed Jsini/M values of PMS stars on their convective tracks (i.e. the youngest stars in our sample, which are shown in Figure 3a) is illustrated in Figure 4. It is remarkable that the very simple assumptions made here yield both a zero point and a slope that are reasonably close to what is observed. Within the framework of the disk-locking model, star-to-star differences in magnetic field strength, accretion rates, or in the length of time that disk-locking is effective, in addition to projection effects, may all contribute to the broad scattering of stars below the upper bound.
Virtually all details of putative disk-locking mechanisms are currently under debate: from the linkage of stellar magnetic fields to the disk to the basic mechanism for angular momentum loss, i.e. through the disk or through a wind (Shu et al.1994). For example, within the past year, Johns-Krull & Gafford (2002) have extended the Shu et al. model to include complex, non-dipole field topologies, which they argue provide a more realistic representation of currently available observations. While this model has many attractive features, it and other more complex formulations introduce additional parameters, which must be derived empirically and which have not yet been well established. Nevertheless, the approximate coincidence between the observed J/M vs. M relationship and the predictions of this very simple model should serve as a challenge to theorists to develop a truly predictive theory of angular momentum loss during the disk accretion phase.
5 FROM THE BIRTHLINE TO THE MAIN SEQUENCE
Next we turn to the question of what happens to angular momentum as intermediate-mass PMS stars evolve from convective to radiative tracks and finally onto the main sequence. The observable diagnostic is the surface rotational velocity, which in turn depends on the initial angular momentum plus any modifications caused either by the transport of angular momentum from the stellar interior or by external forces, including mass accretion and mass loss, particularly when the stellar magnetic field is strong. In the sections that follow, we first look for evidence relating to the question of whether or not external forces are likely to alter the initial stellar angular momentum of pre-main-sequence stars. We then look at the issue of how structural changes affect the observed rotational velocities. Informed by this discussion, we predict ZAMS rotational velocities for the stars in our sample, and compare these predictions with observations of stellar rotation among young field stars. This provides the basis for evaluating how well trends of rotation with mass along the main sequence can be predicted from patterns already present during early PMS evolution.
5.1 External Forces: Disk Regulation on Convective Tracks
If no external forces were acting, pre-main-sequence stars should spin up as they contract toward the zero-age main sequence because of structural changes: a decrease in radius and an increase in central concentration. Some stars may also lose angular momentum as they evolve down their convective tracks, possibly as a consequence of magnetic torques that transfer angular momentum away from the star to a surrounding disk. Our current sample does not allow us to search for systematic changes in J/M as stars with M > 1 M⊙ evolve down their convective tracks. The reasons are two: 1) our sample spans a relatively large mass range but has relatively few stars at any given mass that are still on their convective tracks, and we cannot subdivide the sample according to mass and position along the convective track and retain sufficient numbers to average out star-to-star fluctuations in v and sini; and 2) these relatively massive stars evolve down only a truncated portion of the convective track (Palla & Stahler 1992) and do not, therefore, change in radius by more than about a factor of 2 ; as a result, any systematic changes in vsini will be small relative to the dispersion in v at a given position along the convective tracks. As we discuss in Section 6, however, the systematic differences in J/M for stars on convective and radiative tracks do appear to require some loss of angular momentum as stars with M < 2 M⊙ evolve down their convective tracks.
5.2 External Forces: Mass Loss
Stellar winds loaded onto open magnetic field lines can exert a spindown torque on stars. This mechanism has, however, been shown to be ineffective for fully convective stars because the PMS timescale for spindown exceeds the evolutionary timescale by a few orders of magnitude (e. g. MacGregor & Charbonneau 1994). Fully convective stars are assumed to rotate as solid bodies, and the wind must slow down the entire star—which fact precludes significant spindown during the relatively short PMS convective phase.
Mass loss is also unlikely to have a significant effect on the angular momentum of most stars with M > 1 M⊙ that are evolving along their radiative tracks. The majority of these stars are hotter than log Teff = 3.8, do not have surface convective zones, and are not expected to have dynamo-generated magnetic fields. This expectation is borne out by observations of x-rays from PMS stars in Orion. X-ray emission can serve as a proxy indicator of magnetic fields. Observations show that the ratio of x-ray to bolometric luminosity drops by more than two orders of magnitude when PMS stars become fully radiative (Flaccomio, et al. 2003), and x-ray observations of PMS Orion stars show that strong x-ray emission is present only in stars cooler than log Teff = 3.8 (Gagne, et al. 1995; Feigelson et al 2002). About 10 percent of the stars with spectral types around A0 and earlier, including the He-rich star HD 37017 in our sample, do have large (several thousand gauss) magnetic fields which are thought to be fossil rather than dynamo-generated fields, and it is not known how these large fields might affect either the initial angular momentum or the subsequent evolution of angular momentum. However, the number of such peculiar stars is small enough that, even if some are included in the sample, they should not affect the overall trends shown in Figure 3.
For the purposes of this paper, we will assume very few stars hotter than log Teff = 3.8 have strong surface fields, and they are therefore unlikely to experience strong braking torques caused by stellar winds.
5.3 Internal Effects: Changes in the Moment of Inertia
Even if external forces play no role, we do expect that changes in the moment of inertia will affect stellar rotation. As a star contracts and moves down its convective track and then along a radiative track, its radius decreases and its central concentration increases. Both effects should increase the rotation rate. Whether or not increasing central concentration has an effect on the rotation rate at the stellar surface depends on the time scale for the transport of angular momentum from the stellar core to the surface of the star. Since the theory of this process has substantial uncertainties, we will bracket the true situation by considering two extreme cases for how angular momentum might be conserved: 1) conservation of angular momentum in shells; and 2) solid body rotation.
If angular momentum cannot be efficiently transported across adjacent spherical shells or from the radiative core to the convective envelope, then at any given time t the rotational velocity v is given by
| (5) |
where R is the radius of the star and v0 and R0 refer to initial values.
If, on the other hand, angular momentum is transported efficiently throughout the star, and the star effectively rotates as a solid body, then
| (6) |
where I is the stellar moment of inertia.
Figure 5 compares these two cases for four different stellar masses, based on the models by SFRI. We have assumed arbitrarily a rotation of 10 km/s for the starting point on the tracks. Three different regions should be distinguished in this figure: 1) the fully convective phase, which we will take to be the evolution that takes place at nearly constant Teff to the point of minimum luminosity; 2) the transition from the convective to the radiative tracks, which we will take to be the portion of the evolutionary tracks from minimum luminosity to log Teff = 3.8, at which temperature all of the stars in our sample are on radiative tracks; and 3) the remainder of the radiative track to the main sequence.
As Figure 5 shows, during the fully convective phase, the two extreme cases for angular momentum conservation predict essentially the same evolution of surface rotation rate. As stars evolve down their convective tracks, contraction is nearly homologous, and changes in I directly track changes in R2. Along the radiative tracks, the two extreme cases yield nearly parallel tracks in this logarithmic plot (or for the lowest mass case, predict a relatively small change in surface rotation). Therefore observations of samples comprising either fully radiative or fully convective stars alone cannot be used to determine empirically how angular momentum is conserved. In fact, either assumption (solid body rotation or conservation of angular momentum in shells) can be used to predict how the surface rotation will change either along radiative or along convective tracks. Because of the simplicity of the calculation, we will assume that angular momentum varies inversely with radius along both convective and radiative tracks.
The situation is very different during the transition from convective to radiative tracks. It is at this point in its evolution that a star begins to develop a highly concentrated radiative core, and this core can in principle store much of the initial stellar angular momentum. Therefore, it is during this transition that major differences develop in the predicted surface rotation rates depending on how angular momentum is conserved. If the star were to rotate as a solid body during this phase of evolution, the rotation rate would increase by a factor of 4 or more relative to the rate observed on the convective track (cf. Figure 5).
The observed increase is, however, less than a factor of 4. In our own sample, there are 21 stars on convective tracks with masses greater than 1.2 M⊙, and for these stars <vsini> = 32 3 km/s. There are 11 stars in this mass range with 3.775 < log Teff < 3.826, i.e. at the beginning of their radiative tracks. For these 11 stars, <vsini> = 65 14 km/s. The observed spin up is only a factor of two or so, much smaller than predicted for solid body rotation. Most of the convective stars have log Teff in the range 3.65-3.70, and reference to Figure 5 shows that, if angular momentum is conserved in shells, the spinup as stars evolve from this temperature range to log Teff = 3.8 is about a factor of two for stars with M > 1.2 M⊙ in agreement with the observations.
Therefore, we conclude that “core-envelope decoupling” occurs as PMS stars evolve from convective to radiative tracks. That is, stars that start their post-birthline evolution along convective tracks develop rapidly rotating radiative cores and slowly rotating envelopes as they transition from PMS convective to radiative tracks. A number of studies of stars with mass of a solar mass and lower have also concluded that core-envelope decoupling must occur at some point during PMS evolution. These papers have addressed the question of why there are a large number of slowly rotating stars with masses near 1 M⊙ in young clusters and have argued that core-envelope decoupling provides the best explanation (e.g. Krishnamurthi, et al. 1997; Allain 1998; Barnes, Sofia, & Pinsonneault 2001; and Soderblom, Jones, & Fischer 2001). Our observations of PMS stars that span the transition from convective to radiative phases provide direct confirmation of these inferences, but as we shall see in the next section, core-envelope decoupling accounts for only part of the loss of angular momentum that occurs between the birthline and the main sequence.
6 COMPARISON OF PREDICTED AND OBSERVED ZAMS ROTATIONAL VELOCITIES
6.1 Stars on PMS Convective Tracks
The preceding discussion argues that stars evolving from convective to radiative PMS tracks develop rapidly rotating cores and decoupled, slowly rotating envelopes. We expect that changes in observed surface rotation will therefore track the changes in stellar radius. We can check this conclusion by predicting the rotation rates that stars in our sample on convective tracks will have when they reach the ZAMS. The average mass of the stars on convective tracks in our sample is 1.74 M⊙. A good comparison sample is the group of stars closest to the ZAMS with masses in the range 1.5-2 M⊙ studied by Wolff & Simon (1997). In order to predict the rotation rates that the PMS Orion stars will have when they reach the ZAMS, we have used SFRI models to obtain both the ZAMS radii and the moments of inertia as a function of mass. Figure 6 shows the results, where we have predicted the ZAMS rotation rates for conservation of angular momentum in shells (that is, assuming core-envelope decoupling), and for solid body rotation. We see that the assumption of solid body rotation produces a ZAMS distribution that has, as anticipated from the above discussion, essentially no overlap with what is observed for field stars. There is, however, good agreement between the predicted and observed distributions if we assume that the rotation rate varies inversely with stellar radius as expected for core-envelope decoupling.
6.2 Stars on Radiative Tracks
We have identified no mechanisms that would cause loss of angular momentum after stars reach log Teff = 3.8 as they evolve toward hotter temperatures and smaller radii. These stars should therefore conserve angular momentum as they complete their evolution to the main sequence. In order to check this prediction, we will take as our initial condition the range of vsini values observed for stars with temperatures in the range log Teff = 3.75-3.85. Note that this temperature range encompasses the region of the HR diagram within which stars of masses 1.5-3.5 M⊙ transition from convective to radiative tracks. The data in Table 2 show that the Orion stars reach this temperature with a range of rotation rates from <20 km/s to nearly 200 km/s, with the majority of stars having rotations less than 150 km/s (see Figure 7). In accord with our previous discussion, we will assume that the rotation rates of these stars then vary inversely with the radius (see also Hartmann, et al. 1986).
In Figure 8 we have plotted the predicted changes in vsini as stars evolve along radiative tracks to the main sequence. This figure illustrates several points. First, the rotational velocities of most of the stars in the current sample lie between the bands defined by evolving models for initial values of vsini equal to 20 and 150 km/s. Therefore the range of rotational velocities observed at the end point of the contraction, namely along the ZAMS, is fully consistent with the range seen among pre-main-sequence stars. Hence, as expected, there is no evidence for significant loss of angular momentum along radiative tracks.
Second, on the basis of these simple models we would expect vsini on average to increase with increasing mass because more massive stars contract more as they traverse their longer radiative tracks, and this expectation is consistent with the observations up to about 3 M⊙.
Figure 8 shows the prediction that rotation will continue to increase to values in excess of 400 km/s for stars with masses greater than 4 M⊙ is not borne out by the observations. While our sample is small, this conclusion is supported by much larger surveys (e.g Abt, Levato, & Grosso 2002; Wolff, Edwards, & Preston 1982). This result has a natural explanation in terms of the birthline. Stars with masses greater than 3.5 M⊙, given our particular choice of models, are already on radiative tracks when accretion stops. The portion of the radiative track that they traverse decreases with increasing mass, and the corresponding spin-up from the initial conditions when they are released at the birthline will also decrease, thereby limiting the maximum observed rotational velocity.
6.3 The Break in the Power Law
We now turn to an explanation of why J/M decreases sharply with M for stars with masses less than about 2 M⊙ that have completed the convective phase of evolution. We have noted already that core-envelope decoupling during the transition from convective to radiative tracks will account for some apparent loss of observed surface angular momentum. Core-envelope decoupling cannot, however, account for the sharp downturn in J/M. The effects of core-envelope decoupling are predicted to be largest for stars around 2 M⊙ and to diminish toward lower masses (see Figure 5). This prediction is in the opposite sense to the trend seen in the observations: the differences between the angular momenta of stars on convective tracks and the values for stars on radiative tracks (compare Figures 3a and 3b) are much larger at 1 M⊙ than at 2 M⊙.
An additional mechanism is apparently required to explain the observations, and we suggest that this mechanism is braking while stars with M < 2 M⊙ evolve down their convective tracks. Stars on convective tracks have accretion rates on the order of 10-8 M⊙ per year (e. g. Valenti, Basri, & Johns 1993; Gullbring et al. 1998). If these stars are locked to their disks, then the disks could in principle act as a brake and cause additional loss of angular momentum.
Hartmann (2002) has pointed out that three factors will determine the amount of spindown for a PMS star: 1) the time spent on the convective track; 2) the time scale for disk-braking; and 3) the lifetime of the disk. He has estimated that the disk-braking time scale is given by
| (7) |
where the mass and accretion rate parameters are scaled to values typical of low mass T Tauri stars (Gullbring et al. 1998; Hartmann et al. 1998), and f is the ratio of the actual velocity to the breakup velocity. We will take, following Hartmann (see also Figure 3a), f = 0.2. We can then calculate the ratio of to the time a contracting star spends moving down the convective track from the birthline to the transition to the radiative track, after which we expect braking to be minimal because of the absence of magnetic fields. In order to estimate the convective lifetime, we have used the SFRI models to determine the time that elapses as a star moves from the PS birthline to the bottom of the convective track.
The results are shown in Figure 9. The shape of this curve mimics the shape of the relationship between J/M and mass for PMS Orion stars on radiative tracks. The lower the mass of a star, the longer the time it spends evolving down its convective track and the more angular momentum it can lose, provided of course that the disk lifetime is also long enough. Stars with masses close to 2 M⊙ enter the radiative phase before disks can remove significant stellar angular momentum. Therefore braking on the convective track provides a very natural explanation for the break in the power law seen for post-convective-track stars with M < 2 M⊙. Analysis of data for Orion and several hundred other PMS stars with masses in the range 0.5-1 M⊙ shows that these stars on average reduce their rotational velocities by about a factor of three while contracting by about a factor of three as they evolve down convective tracks, thereby reducing their angular momentum by about an order of magnitude (Rebull et al. 2002; Rebull et al. 2003, in preparation). Quantitatively, this is just what is required in order to account for the break in the J/M power law (see Figure 3b).
7 CONCLUSIONS
We have presented new measurements of rotational velocities for a sample of stars with masses in the range 0.4-14 M⊙ (median mass 2.1 M⊙) and considered literature data for stars 0.5 M⊙. Observations of the youngest stars in Orion show that the specific angular momentum of stars on convective tracks increases slowly and continuously with stellar mass over the mass range from 0.1 M⊙ to nearly 3 M⊙ and merges smoothly with the J/M vs. M relationship for young main sequence stars with masses between 3 and 10 M⊙. The power law relationship between J/M and M for newly formed stars suggests a common mechanism for establishing J/M throughout this entire range, which spans a factor of 100 in mass. The power law relationship between J/M and M for convective PMS stars differs significantly from what is observed for both older PMS stars, which have evolved from convective to radiative tracks, and main sequence stars. For these older stars, J/M follows the same power law relationship as the convective stars for M > 2 M⊙ but decreases sharply with decreasing mass for stars with M < 2 M⊙.
These observations establish the basic trends in angular momentum as a function of time and mass that models must explain. Comparison with very simple models shows that these overall trends can be explained by five distinct processes that are effective at different stages of evolution: 1) an angular momentum loss process, possibly disk-locking, that operates before stars reach the birthline and applies to all stars with masses between 0.1 and 10 M⊙; 2) braking of stars with M < 2 M⊙ as they evolve down their convective tracks, with the amount of braking increasing with time spent in this phase of evolution and hence with decreasing mass; 3) decoupling of the angular momentum seen at the surface of the star from the angular momentum in the interior when stars with M < 2-4 M⊙ make the transition from convective to radiative PMS evolution; 4) conservation of angular momentum as stars evolve along their radiative tracks; and 5) additional spindown by magnetic winds of stars with M < 1.4 M⊙ after these stars reach the main sequence.
While much more sophisticated models may eventually be required to explain the trends observed here, these results show the potential power of observations of stellar rotation as probes of fundamental processes that occur during the formation and early evolution of stars.
References
- (1) Abt, H.A. & Hunter, 1962
- (2) Abt, H. A., & Morrell, N. I. 1995, ApJS, 99, 135
- (3) Abt, H.A., Levato, H., & Grosso, M. 2002, ApJ, 573, 359
- (4) Abt, H.A., Muncaster, & Thompson, 1970
- (5) Allain, S. 1998, A&A, 333, 629
- (6) Anderson, C.M., Stoeckly, R., & Kraft, R. P. 1966, ApJ, 143, 299
- (7) Barnes, S., Sofia, S., & Pinsonneault, M. 2001, ApJ, 548, 1071
- (8) Behrend, R., & Maeder, A. 2001, A&A, 373, 190
- (9) Bessell, M.S. 1991, AJ, 101, 662
- (10) Brown, A.G.A., de Geus, E.J., deZeeuw, P. T., 1994, A&A, 289, 101
- (11) Chandrasekhar, S., & Munch, G. 1950, ApJ, 111, 142
- (12) Chlebowski, T., & Garmany, C. D. 1991, ApJ, 368, 241
- (13) Code, A.D., Bless, R.C., Davis, J., & Brown, R.H. 1976, ApJ, 203, 417
- (14) Cohen, M., & Kuhi, L.V. 1979, ApJS, 41, 743
- (15) Conti, P.S., & Ebbets, D. 1977, 213, 438
- (16) Cox, A. N. 2000, Allen’s Astrophysical Quantities, 4th edition (AIP Press: New York), p. 388
- (17) Duncan, D. 1993, ApJ, 406, 172
- (18) Durisen, R.H., Yang, S., Cassen, P., & Stahler, S. W. 1989, ApJ, 345, 959
- (19) Edwards, S., et al. 1993, AJ, 106, 372
- (20) Elias, J.H., Frogel, J.A., Matthews, K., & Neugebauer, G. 1982, AJ, 87, 1029
- (21) Feigelson, E. D., Gaffney, J.A., Garmire, G., Hillenbrand, L. A., & Townsley, L. 2003, ApJ, 584, 911
- (22) Feigelson, E.D., Broos, P., Gaffney, J.A., Garmire, G., Hillenbrand, L.A., Pravdo, S.H., Townsley L, & Tsuboi, Y. 2002, ApJ, 574, 258.
- (23) Flaccomio, E., Damiani, F., Micela, G., Sciortino, S., Harnden, F.R., Murray, S.S., & Wolk, S.J. 2003, ApJ, 582, 398
- (24) Gagne, J., Caillault, J.-P., & Stauffer, J. R. 1995, ApJ, 445, 280
- (25) Genzel, R., & Stutzki, J. 1989, ARA&A, 27, 41
- (26) Guenther, E. W., Lehmann, H., Emerson, J. P., & Staude, J. 1999, A&A, 341, 768
- (27) Gullbring, E., Hartmann, L., Briceno, C., & Calvet, N. 1998, ApJ, 492, 323
- (28) Hartmann, L. 1996, private communication
- (29) Hartmann, L. 2002, ApJ, 566, L29
- (30) Hartmann, L., Calvet, N., Gullbring, E., & D’Alessio, P. 1998, ApJ, 495, 385
- (31) Hartmann, L., Hewett, R., Stahler, S., & Mathieu, R.D. 1986, ApJ, 309, 275
- (32) Herbst, W., Bailer-Jones, C.A.L., & Mundt, R. 2001, ApJ, 554, L197
- (33) Hillenbrand, L. A. 1997, AJ, 113, 1733
- (34) Hillenbrand, L.A., Strom S.E., Vrba, F.J., & Keene, J. 1992, ApJ, 397, 613
- (35) Hillenbrand, L. A., Strom, S. E., Calvet, N., Merrill, K. M., Gatley, I., Makidon, R. B., Meyer, M.R., & Skrutskie, M.F. 1998, AJ, 116, 1816
- (36) Humphreys, R.M., & McElroy, D. B. 1984, 284, 565
- (37) Johns-Krull, C.M., & Gafford, A. D. 2002, ApJ, 573, 685
- (38) Johns-Krull, C. M., Valenti, J. A., & Koresko, C. 1999, ApJ, 516, 900
- (39) Johnson, H.L. 1966, ARA&A, 4, 193
- (40) Jones, B.F., & Walker, M.F. 1988, AJ, 95,1755
- (41) Kawaler, S. D. 1987, PASP, 99. 1322
- (42) Kenyon, S. J., 1988, AJ, 96, 337
- (43) Königl, A. 1991, ApJ, 370, L39
- (44) Kraft, R. P. 1970, in Spectroscopic Astrophysics, ed. G. H. Herbig (Berkeley: U. of Cal. Press), 385
- (45) Krishnamurthi, A., Pinsonneault, M.H., Barnes, S., & Sofia, S. 1997, ApJ, 480, 303
- (46) MacGregor, K. B., & Charbonneau, P. 1994 in ASP conf. Ser. 64, Cool Stars, Stellar Systems, and the Sun, Eighth Cambridge Workshop, ed. J.-P. Caillaut (San Francisco: ASP), 174
- (47) McNamara, B.J. 1976, AJ, 81, 845
- (48) McNamara, B.J., Hack, W.J., Olson, R.W., & Mathieu, R. D. 1989, AJ, 97, 1427
- (49) McNamara, D.H., 1963, ApJ, 137,316
- (50) McNamara, D.H., & Larsson, H.J. 1962, ApJ, 135, 748
- (51) Maeder, A., & Meynet, G. 1988, A&A Suppl., 76, 411
- (52) Massey, P., Parker, J. W., & Garmany, C. D. 1989, AJ, 98, 1305
- (53) Mathieu, R. D., Ghez, A.M., Jensen, E. L. N., & Simon, M. 2000, in Protostars and Planets IV, ed. V. Mannings, A. Boss, & S. S. Russell (Tucson: Univ. Arizona Press), 703
- (54) Mundt, T. & Bastien, U. 1980, AA Supp. 39, 245
- (55) Norberg, P., & Maeder. A. 2000, A&A, 359, 1025
- (56) Palla, F., & Stahler, S. W. 1992, ApJ, 392, 667
- (57) Palla, F., & Stahler, S. W. 1993, ApJ, 418, 414
- (58) Parenago, P.P. 1954, Trudy Sternberg Astron. Inst., 25
- (59) Penston, M.V. 1973, ApJ, 183, 505
- (60) Penston, M.V., Hunter, J.K., & O’Neill, A. 1975, MNRAS, 171, 219
- (61) Rebull, L.M. 2001, AJ, 121, 1676
- (62) Rebull, L.M., Wolff, S.C., Strom, S.E., & Makidon, R.B. 2002, AJ, 124, 546
- (63) Rhode, K.L., Herbst, W., & Mathieu, R.D. 2001, AJ, 122, 3258
- (64) Rydgren, A.E., & Vrba, F.J., 1984, AJ, 89, 399
- (65) Shu, F., Najita, J., Ostriker, E., Wilkin, F., Ruden, S., & Lizano, S. 1994, ApJ, 429, 781
- (66) Slettebak, A., Collins, G.W.,II, Parkinson, T. D., Boyce, P.B., & White, N.M. 1975, ApJS, 29, 137
- (67) Smith, M.A., Beckers, J.M., & Barden, S. C. 1983, ApJ, 271, 237
- (68) Soderblom, D.R., Jones, B.F., & Fischer, D. 2001, ApJ, 563, 334
- (69) Soderblom, D. R., Pendleton, J., & Pallavicini, R. 1989, AJ, 97, 539
- (70) Stahler, S. W. 1983, ApJ, 274, 822
- (71) Stauffer, J.R., & Hartmann, L.W. 1986, PASP, 98, 1233
- (72) Swenson, F.J., Faulkner, J., Rogers, F. J., & Iglesias, C. A. 1994, ApJ, 425, 286 (SFRI)
- (73) Tonry, J., & Davis, M. 1979, AJ, 84, 1511
- (74) Uchida, Y. & Shibata, K. 1984, PASJ, 36, 105
- (75) Valenti, J.A., Basri, G., & Johns, C.M. 1993, AJ, 106, 2024
- (76) van Altena, W.F., Lee, J.T., Lee, J.-F., Lu, P.K., & Upgren, A.R. 1988, AJ, 95, 1744
- (77) Walker, M.F. 1969, ApJ, 155, 447
- (78) Walker, M.F. 1983, ApJ, 271, 642
- (79) Walker, M.F. 1990, PASP, 102, 726
- (80) Warren, W.H., & Hesser, J.E. 1977, ApJS, 34, 115
- (81) Warren, W.H., & Hesser, J.E. 1978, ApJS, 36, 497
- (82) Wolff, S.C., 1990, AJ, 100, 1994
- (83) Wolff, S. C., & Simon, T. 1997, PASP, 109, 759
- (84) Wolff, S.C., Edwards, S., & Preston, G.W. 1982, ApJ, 252, 322
- (85)
| Par. | V | B-V | U-B | UBV aaUBV references: (1) Walker, 1969; (2) Warren and Hesser, 1977; (3) Penston, 1973; (4) McNamara, 1976; (5) McNamara et al., 1989; (6) Penston, Hunter, & O’Neill, 1973; (7) Rydgren & Vrba, 1984; (8) Mundt & Bastien, 1980; (9) Parenago, 1954. | Ic | V-Ic | VI bbVI references: (1) Hillenbrand, 1997; (2) Penston, 1973 transformed from johnson system to cousins system; (3) Penston, Hunter, & O’Neill, 1973 transformed to cousins system; (4) McNamara, 1976 transformed to cousins system; (5) Rydgren & Vrba, 1984. | J | J-H | H-K | JHK ccJHK references: (1) this paper, 1991 nov/dec OTTO observations; (2) this paper, 1992 SQIID observations; (3) this paper, 1993 NICMASS observations; (4) literature. | SpT | SpT ddSpectral Type references: (1) this paper; (2) Hillenbrand, 1997; (3) Walker, 1969; (4) Walker, 1983; (5) Duncan, 1993; (6) Smith, Beckers, & Barden, 1983; (7) Wolff, Edwards, & Preston, 1982; (8) Penston, Hunter, & O’Neill, 1973; (9) Cohen & Kuhi, 1979; (10) reference in Warren and Hesser, 1977; (11) Brown et al, 1994; (12) Wolff, 1990. | vsini eeThe notation (SB:) in this column indicates a candidate spectroscopic binary with corresponding to the amplitude of the radial velocity variation among our different observations of the star. (SB1) indicates an SB1 candidate identified in previous literature; see vsini references column. | vsini ffvsini references: (1) this paper; (2) Hartmann, 1996, private communication; (3) Duncan, 1993; (4) Wolff, Edwards, & Preston, 1982; (5) Walker, 1990; (6) Walker, 1983; (7) Smith, Beckers, & Barden, 1983; (8) McNamara, 1963 (old slettebak system); (9) Abt, Muncaster, & Thompson, 1970; (10) McNamara & Larsson, 1962 (old slettebak system); (11) Hartmann et al, 1986; (12) Abt, & Hunter, 1962; (13) Conti & Ebbets, 1977; (14) Rhode, Herbst, & Mathieu, 2000. | Brun | HD | HR | Group |
|---|---|---|---|---|---|---|---|---|---|---|---|---|---|---|---|---|---|---|---|
| mag | mag | mag | ref | mag | mag | ref | mag | mag | mag | ref | ref | km/s | ref | # | # | # | |||
| 82 | 7.97 | -0.04 | -0.35 | 2 | 7.98 | -0.01 | – | – | B8-B9,B9 | 10,11 | 200 | 8 | – | 36120 | – | C | |||
| 378 | 8.65 | -0.06 | -0.38 | 2 | 8.75 | -0.10 | – | 8.79 | -0.03 | -0.04 | 1 | B8-A0,A0 | 10,11 | 15 | 8 | – | 36234 | – | C |
| 597 | 8.18 | 0.05 | -0.04 | 2 | 8.07 | 0.11 | – | – | B9 | 10,11 | 25 | 8 | – | 36366 | – | C | |||
| 679 | 6.22 | -0.18 | -0.75 | 2 | – | 6.66 | -0.06 | -0.07 | 1 | B2.5,B2 | 12,7,11 | 15,10,40 | 4,10,12 | – | 36430 | 1848 | C | ||
| 854 | 7.69 | -0.08 | -0.45 | 2 | 7.74 | -0.05 | – | 7.88 | -0.03 | -0.04 | 1 | B5.5,B8 | 12,11 | 190 | 8 | – | 36541 | – | C |
| 908 | 8.81 | -0.04 | -0.22 | 2 | 8.85 | -0.04 | – | 8.89 | -0.01 | -0.04 | 1 | B8-B9 | 10,11 | 135 | 8 | – | 36559 | – | C |
| 1044 | 7.69 | 0.01 | -0.65 | 1 | – | 7.58 | 0.01 | -0.01 | 1 | B2-B3 | 1,3,11 | 50 | 1 | 25 | 36629 | – | C1 | ||
| 1049 | 11.87 | 1.60 | 1.54 | 1 | – | 8.78 | 0.05 | 0.89 | 1 | K5-K7 | 1 | 4-20 (SB:50) | 1 | 29 | – | – | C1 | ||
| 1076 | 12.60 | 0.47 | 5 | – | 10.26 | 0.61 | 0.45 | 1 | K1 | 9 | 22 | 11 | 42 | – | – | C | |||
| 1097 | 8.63 | -0.04 | -0.08 | 1 | – | 8.62 | 0.06 | 0.00 | 1 | B8,B9 | 3,11 | 150 | 8 | 50 | 36655 | – | C | ||
| 1126 | 8.98 | 0.01 | -0.06 | 1 | – | 8.97 | 0.00 | -0.03 | 1 | B9-A0 | 1,3,11 | 80 | 1 | 62 | 36670 | – | C1 | ||
| 1179 | 11.52 | 0.53 | -0.02 | 1 | – | 10.42 | 0.24 | 0.03 | 1 | F5,F8 | 1,3 | 114 | 1 | 89 | – | – | C1 | ||
| 1270 | 12.11 | 0.92 | 0.68 | 1 | 11.01 | 1.10 | 4 | 10.28 | 0.58 | 0.27 | 1 | K1 | 9 | 16 | 11 | 141 | – | – | C |
| 1319 | 12.58 | 1.11 | 0.53 | 1 | – | 10.29 | 0.54 | 0.15 | 1 | F5-G0,K0 | 1,4 | 187,279 | 1,6 | 166 | – | – | C3 | ||
| 1322 | 11.70 | 0.85 | 0.33 | 1 | 10.76 | 0.94 | 4 | 10.12 | 0.40 | 0.10 | 1 | G8 | 1 | 70 | 1 | 168 | – | – | C2 |
| 1326 | 11.34 | 1.46 | 1.31 | 2 | – | 8.45 | 0.64 | 0.17 | 1 | K5 | 1 | 4-20 (SB:13) | 1 | 172 | – | – | C1 | ||
| 1345 | 12.00 | 1.26 | 5 | – | 9.19 | 0.70 | 0.17 | 1 | K5 | 1 | 4-20 | 1 | – | – | – | C1 | |||
| 1360 | 13.81 | 0.94 | 0.42 | 1 | – | – | G8 | 4 | 15 | 3 | 182 | – | – | C2 | |||||
| 1374 | 10.31 | 0.56 | 0.10 | 4 | 9.66 | 0.65 | 4 | 9.14 | 0.27 | 0.04 | 1 | F6 | 1 | 77 | 1 | 203 | – | – | D1 |
| 1391 | 10.63 | 0.49 | 0.04 | 1 | 10.11 | 0.51 | 2 | 9.68 | 0.23 | 0.06 | 1 | F7 | 1,3 | 15 (SB:30) | 1 | 211 | – | – | C3 |
| 1393 | 12.16 | 0.78 | 0.37 | 4 | 11.08 | 1.04 | 1 | 10.32 | 0.53 | 0.08 | 2 | K0,G6 | 1,2 | 10 | 3,1 | 213 | – | – | D1 |
| 1394 | 10.29 | 0.55 | -0.01 | 1 | 9.44 | 0.69 | 2 | 9.00 | 0.37 | 0.30 | 1 | F6 | 1,3 | 60 | 1 | 216 | – | – | D1 |
| 1404 | 11.51 | 0.84 | 0.34 | 1 | 10.56 | 0.95 | 5 | 9.81 | 0.60 | 0.47 | 1 | G5 | 3,5 | 34,27,14 | 3,11,7 | 220 | – | – | D1 |
| 1408 | 14.40 | -0.75 | 5 | – | 10.45 | 0.59 | 0.14 | 1 | K5-K7 | 1 | 21 | 1 | 219 | – | – | C1 | |||
| 1409 | 11.60 | 0.85 | 0.28 | 1 | 10.59 | 1.01 | 5 | 9.72 | 0.69 | 0.57 | 1 | G4:F8 | 1,4 | 29,45,60 | 1,5,6 | 224 | – | – | C3 |
| 1414 | 11.48 | 0.64 | 0.11 | 1 | 10.72 | 0.70 | 5 | 10.27 | 0.28 | 0.03 | 1 | F8,G5 | 1,3 | 29,38,14 | 1,3,7 | 225 | – | – | C1 |
| 1425 | 12.00 | 0.91 | 0.34 | 1 | 11.01 | 1.00 | 4 | 10.15 | 0.41 | 0.15 | 1 | G7 | 1 | 26,33 | 1,3 | 233 | – | – | C1 |
| 1440 | 12.73 | 0.96 | 0.49 | 1 | – | 11.17 | 0.48 | 0.07 | 1 | K5-7,K0-2 | 1,4 | 16-20 | 1 | 244 | – | – | C2 | ||
| 1445 | 8.15 | -0.09 | -0.45 | 1 | – | 8.33 | -0.02 | -0.03 | 1 | B6,B7 | 1,3,11 | 280,245 | 1,8 | 246 | 36842 | – | C1 | ||
| 1455 | 10.89 | 0.64 | -0.16 | 4 | 10.08 | 0.76 | 1 | 9.56 | 0.35 | 0.11 | 1 | G0 | 1,2 | 21 | 1 | 252 | – | – | D1 |
| 1484 | 12.20 | 1.08 | 5 | 10.97 | 1.04 | 1 | 10.27 | 0.49 | 0.11 | 1 | K1 | 1 | 49,44 | 1,3 | 283 | – | – | D1 | |
| 1491 | 7.44 | -0.06 | -0.39 | 1 | – | 7.54 | 0.01 | 0.00 | 1 | B8-B9 | 1,3,11 | 225,220 | 1,8 | 281 | 36865 | – | C1 | ||
| 1505 | 12.78 | 0.87 | 0.48 | 1 | – | 11.06 | 0.57 | 0.09 | 1 | K2: | 1 | 17-20,30 | 1,3 | 293 | – | – | C1 | ||
| 1507 | 10.26 | 0.28 | 0.21 | 1 | 9.96 | 0.30 | 4 | 9.70 | 0.10 | 0.03 | 1 | A5,A7,A8 | 1,3,11 | 136,235 | 1,9 | 295 | 294265 | – | C3 |
| 1510 | 12.40 | 1.25 | 5 | 11.09 | 1.31 | 1 | 10.08 | 0.65 | 0.19 | 2 | K2 | 1 | 38,39 | 1,14 | 302 | – | – | D1 | |
| 1511 | 9.30 | 0.15 | 0.15 | 1 | 9.14 | 0.16 | 4 | 9.05 | 0.04 | -0.01 | 1 | A2 | 1,3,11 | 112,180 | 1,9 | 304 | 36866 | – | D1 |
| 1518 | 13.80 | 0.80 | 9 | 11.65 | 1.60 | 1 | 10.28 | 0.72 | 0.24 | 2 | K2 | 2 | 38 | 3 | 311 | – | – | D1 | |
| 1539 | 10.77 | 0.71 | 0.29 | 1 | 9.80 | 0.94 | 1 | 9.10 | 0.17 | 0.09 | 2 | B8 | 1,3 | 250 | 1 | 328 | – | – | C3 |
| 1540 | 11.35 | 1.27 | 1.11 | 3 | 9.89 | 1.49 | 1 | 8.83 | 0.55 | 0.23 | 2 | K4,K1 | 1,2 | 15-20 (SB) | 1 | 334 | – | – | D1 |
| 1541 | 12.58 | 0.99 | 0.41 | 1 | 11.12 | 1.27 | 1 | 10.14 | 0.53 | 0.17 | 2 | K1,K2,K3 | 1,5,4 | 11-20,29,15 | 1,3,14 | 335 | – | – | D1 |
| 1552 | 13.72 | 1.00 | -0.65 | 8 | 11.65 | 1.75 | 1 | 10.07 | 0.98 | 0.71 | 2 | K7 | 2 | 15 | 3 | 340 | – | – | D1 |
| 1553 | 12.40 | 1.36 | 5 | – | 10.09 | 0.77 | 0.47 | 1 | K2 | 1 | 28 (SB:54) | 1 | 339 | – | – | D1 | |||
| 1554 | 12.30 | 0.88 | 0.43 | 1 | – | 10.75 | 0.50 | 0.09 | 1 | G8,K2 | 1,4 | 30 | 1 | 341 | – | – | C4 | ||
| 1562 | 9.47 | 0.08 | 0.03 | 1 | 9.59 | 0.05 | 3 | 9.51 | -0.01 | -0.03 | 1 | A0,B9 | 1,3,11 | 200,250 | 1,9 | 342 | 36899 | – | C3 |
| 1581 | 12.46 | 0.73 | 0.27 | 1 | – | 10.76 | 0.34 | 0.09 | 1 | F5 | 1 | 17-20 (SB:12) | 1,3 | 365 | – | – | C1 | ||
| 1587 | 12.60 | 1.30 | 5 | 11.11 | 1.61 | 1 | 9.84 | 0.63 | 0.21 | 2 | K2 | 1,2 | 19-20,32 | 1,14 | 374 | – | – | D | |
| 1605 | 8.03 | 0.17 | 0.10 | 1 | 7.57 | 0.41 | 1 | 7.27 | 0.28 | 0.51 | 1 | A0,B9 | 1,11,2 | 127,170,110 | 1,9,8 | 388 | 36917 | – | D1 |
| 1608 | 12.95 | 1.03 | 0.79 | 1 | – | 10.91 | 0.63 | 0.10 | 1 | K5,K4 | 1,4 | 26 | 1 | 394 | – | – | C4 | ||
| 1623 | 10.13 | 0.57 | 0.43 | 4 | 9.29 | 0.90 | 1 | 8.46 | 0.48 | 0.49 | 1 | A3,A2 | 1,2 | 171,260 | 1,9 | 405 | – | – | C3 |
| 1626 | 11.24 | 0.68 | 0.14 | 1 | 10.48 | 0.77 | 5 | 9.89 | 0.31 | 0.07 | 1 | A5:G2 | 1,6 | 94,110 | 1,7 | 407 | – | – | C4 |
| 1634 | 8.39 | -0.10 | -0.48 | 1 | – | 8.93 | -0.06 | -0.04 | 1 | B7,B9IV | 1,3,11 | 150 | 1 | 417 | 36918 | – | C4 | ||
| 1643 | 13.30 | 0.63 | 5 | – | 10.95 | 0.54 | 0.18 | 1 | K0 | 1 | 16-20,36 | 1,3 | 424 | – | – | D1 | |||
| 1646 | 9.80 | 0.49 | 0.01 | 1 | – | 7.81 | -0.03 | -0.03 | 1 | F6 | 1,3 | 11-20 | 1 | 425 | 294257 | – | C1 | ||
| 1654 | 8.88 | 0.08 | -0.15 | 1 | – | 8.87 | 0.21 | 0.03 | 1 | B8-B9 | 1,3,11 | 120 | 1 | 437 | 36938 | – | C2 | ||
| 1657 | 11.51 | 0.51 | -0.03 | 1 | 10.93 | 0.58 | 4 | 8.58 | 0.06 | 0.03 | 1 | F2,G2 | 1,4 | 14-20 | 1 | 438 | – | – | C4 |
| 1659 | 11.62 | 1.21 | 0.77 | 3 | 10.15 | 1.56 | 1 | 9.03 | 0.64 | 0.30 | 2 | K2,K3 | 1,2 | 9-20,7 (SB:30) | 1,14 | 443 | – | – | D |
| 1660 | 9.00 | -0.02 | -0.22 | 1 | 8.93 | 0.00 | 1 | 8.93 | 0.14 | 0.00 | 2 | B8,B9 | 1,11,2 | 275,375 | 1,9 | 442 | 36939 | – | D1 |
| 1664 | 7.59 | -0.13 | -0.55 | 1 | – | 8.92 | 0.05 | 0.03 | 1 | B3,B5 | 1,3,11 | 180: | 1 | 440 | 36936 | – | C1 | ||
| 1671 | 9.65 | 0.26 | 0.11 | 1 | – | 9.06 | 0.13 | 0.00 | 1 | A5-A7 | 1,3,11 | 175 | 1 | 454 | 36937 | – | C1 | ||
| 1679 | 12.20 | 0.75 | 5 | – | 10.20 | 0.48 | 0.13 | 1 | K2 | 1 | 18-20 | 1 | – | – | – | C1 | |||
| 1683 | 10.93 | 0.46 | 0.38 | 1 | 10.44 | 0.48 | 3 | 10.05 | 0.12 | 0.05 | 1 | A1,A0 | 1,3 | 50 | 1 | 464 | – | – | C3 |
| 1685 | 10.19 | 0.15 | 0.14 | 1 | 9.89 | 0.27 | 1 | 9.39 | 0.26 | 0.25 | 1 | B9 | 1,2 | 201,240/50 | 1,9 | 466 | – | – | D |
| 1691 | 11.23 | 0.70 | 0.22 | 4,5 | 10.42 | 0.81 | 4 | 9.87 | 0.39 | 0.08 | 1 | G4 | 6 | 68 | 7 | – | – | – | C |
| 1698 | 8.87 | 0.06 | 0.01 | 1 | – | 8.76 | 0.01 | 0.01 | 1 | A1 | 1,3,11 | 50 | 1 | 472 | 36957 | – | C1 | ||
| 1708 | 7.35 | -0.08 | -0.59 | 1 | – | 7.44 | -0.03 | -0.01 | 1 | B3-B5,B3 | 1,3,11 | 50 | 1 | 480 | 36958 | – | C2 | ||
| 1712 | 10.47 | 0.57 | 0.25 | 1 | 9.74 | 0.70 | 3 | 9.15 | 0.23 | 0.13 | 1 | B9 | 1,3 | 75 | 1 | 479 | – | – | C3 |
| 1716 | 5.71 | -0.20 | -0.90 | 1 | – | – | B1 | 12,11,3 | 35,10 | 12,10 | 482 | 36959 | 1886 | C4 | |||||
| 1728 | 4.81 | -0.25 | -1.01 | 1 | – | – | B0.5 | 12,11,3 | 25,30 | 12,10 | 493 | 36960 | 1887 | C4 | |||||
| 1736 | 11.11 | 1.27 | 0.74 | 1 | 9.43 | 1.63 | 1 | 8.26 | 0.54 | 0.26 | 2 | F8,G2 | 1,2 | 41,100 | 1,7 | 497 | – | – | C3 |
| 1744 | 7.84 | -0.12 | -0.56 | 1 | 8.05 | -0.16 | 1 | 8.12 | -0.06 | -0.04 | 1 | B5,B4 | 1,11,2 | 75,135,145 | 1,9,10 | 502 | 36981 | – | C3 |
| 1746 | 11.66 | 1.08 | 1 | 10.18 | 1.34 | 1 | 9.03 | 0.90 | 0.79 | 2 | K0,K2 | 1,2 | 36,39 | 1,3 | 510 | – | – | D | |
| 1768 | 9.23 | -0.03 | -0.12 | 1 | 9.21 | 0.02 | 4 | 9.20 | 0.02 | 0.03 | 1 | B9,B9.5 | 1,3,11 | 180 | 1 | 520 | 36983 | – | C4 |
| 1772 | 8.46 | 0.09 | -0.61 | 1 | 8.04 | 0.33 | 1 | 7.75 | 0.13 | 0.10 | 1 | B2.5,1.5p | 1,2,11 | 80,135 | 1,9 | 530 | 36982 | – | D |
| 1785 | 12.47 | 1.13 | 3 | 11.16 | 1.53 | 1 | 9.77 | 0.88 | 0.65 | 2 | K0 | 1 | 18-20,22 | 1,14 | 535 | – | – | D | |
| 1789 | 10.53 | 0.53 | 0.01 | 1 | 9.92 | 0.61 | 4 | 9.51 | 0.24 | 0.04 | 1 | F6 | 1,3 | 81 | 1 | 540 | – | – | C4 |
| 1792 | 8.88 | -0.05 | -0.26 | 2 | 8.92 | -0.04 | – | 8.87 | 0.07 | 0.01 | 1 | B8-A0,A0 | 10,11 | 75 | 8 | – | 37001 | – | C |
| 1795 | 9.00 | -0.01 | -0.15 | 1 | 9.00 | 0.00 | 4 | 8.98 | 0.03 | -0.03 | 1 | B9 | 1,11 | 350: | 1 | 529 | 36998 | – | C1 |
| 1798 | 9.47 | 0.36 | -0.41 | 1 | – | 8.11 | 0.36 | 0.18 | 1 | B3 | 1,3,11 | 50: | 1 | 545 | 294264 | – | C2 | ||
| 1799 | 12.64 | 1.14 | -0.11 | 1 | 10.94 | 1.85 | 1 | 9.52 | 0.63 | 0.26 | 2 | G0-G2 | 1 | 123,10,220 | 1,3,5 | 541 | – | – | D1 |
| 1813 | 7.49 | -0.14 | -0.66 | 1 | – | 7.69 | 0.01 | -0.02 | 1 | B4,B3,B5 | 1,3,11 | 80 | 1 | 552 | 37000 | – | C4 | ||
| 1828 | 12.44 | 1.14 | 0.63 | 3 | 11.05 | 1.43 | 2 | 9.79 | 0.76 | 0.53 | 1 | K3 | 1 | 29 | 1 | 563 | – | – | D1 |
| 1849 | 8.51 | -0.09 | -0.41 | 1 | – | 8.70 | -0.03 | -0.03 | 1 | B8,B7 | 1,3,11 | 50: | 1 | 581 | 36999 | – | C4 | ||
| 1865 | 6.74 | 0.03 | -0.87 | 1 | 6.31 | 0.42 | 1 | 6.09 | 0.28 | 0.16 | 1 | O9,B0,O7 | 1,2,11 | 50,135 (SB1) | 1,9 | 587 | 37020 | 1893 | D |
| 1881 | 9.81 | 0.21 | -0.10 | 1 | – | 9.25 | 0.19 | 0.04 | 1 | A0-A2 | 1,3 | 50 | 1 | 599 | 294262 | – | C2 | ||
| 1891 | 5.14 | -0.01 | -0.95 | 1 | 4.81 | 0.33 | 1 | 4.63 | 0.15 | 0.07 | 1 | O7e | 1,2,11 | 100:,140,98 | 1,9,13 | 598 | 37022 | 1895 | D |
| 1905 | 9.39 | 0.05 | 0.05 | 1 | 9.36 | 0.04 | 3 | 9.24 | 0.03 | 0.04 | 1 | A0 | 1,3,11 | 177,190 | 1,9 | 608 | 37019 | – | C3 |
| 1923 | 12.70 | 0.50 | 5 | 11.25 | 0.64 | 1 | 10.03 | 0.56 | 0.33 | 2 | A5 | 1,2 | 125,12 | 1,3 | 633 | – | – | D | |
| 1929 | 13.30 | 0.48 | 5 | – | 10.05 | 0.76 | 0.42 | 1 | K3 | 1 | 34,50 | 1,3 | 635 | – | – | D1 | |||
| 1933 | 6.57 | -0.14 | -0.77 | 1 | – | 4.96 | 0.08 | -0.01 | 1 | B1.5-B3p | 11,12,1,3 | 125,150 | 1,10 | 632 | 37017 | 1890 | C1 | ||
| 1950 | 15.00 | -1.86 | 5 | – | 10.65 | 0.41 | 0.13 | 1 | G8 | 1 | 27 | 1 | 645 | – | – | C2 | |||
| 1953 | 9.89 | 0.72 | 0.17 | 1 | 9.05 | 0.83 | 1 | 8.35 | 0.55 | 0.53 | 1 | G1,G0 | 1,2 | 31 | 1 | 653 | – | – | C3 |
| 1955 | 10.91 | 1.09 | 0.60 | 1 | 9.65 | 1.33 | 1 | 8.75 | 0.59 | 0.21 | 1 | G8:G2 | 1,2 | 109,130 | 1,7 | 656 | – | – | C3 |
| 1956 | 9.62 | 0.29 | -0.39 | 2 | 8.90 | 0.72 | 1 | 8.13 | 0.48 | 0.26 | 2 | B3,B4 | 1,2 | 200,190 | 1,9 | 655 | – | – | D |
| 1971 | 13.57 | 1.22 | 0.90 | 6 | 12.25 | 1.36 | 1 | 11.45 | 0.66 | 0.12 | 2 | lateK | 2 | 18 | 3 | 671 | – | – | C3 |
| 1972 | 12.90 | 1.30 | 5 | 11.81 | 1.34 | 1 | 10.91 | 0.61 | 0.13 | 2 | K3 | 1,2 | 18-20,12 | 1,14 | 676 | – | – | D | |
| 1973 | 12.80 | 1.50 | 9 | 11.83 | 1.44 | 1 | 10.53 | 0.79 | 0.53 | 2 | G9 | 2 | 45 | 2 | 669 | – | – | D | |
| 1993 | 5.06 | -0.08 | -0.97 | 1 | 4.97 | 0.10 | 1 | 4.95 | 0.07 | 0.01 | 1 | O9-B0e | 1,2,11 | 150,145 (SB1) | 1,9/10/13 | 682 | 37041 | 1897 | D |
| 1996 | 11.01 | 0.64 | 0.15 | 1 | 10.21 | 0.78 | 5 | 9.68 | 0.34 | 0.02 | 1 | F8,G5 | 1,3 | 63,51 | 1,7 | 684 | – | – | C4 |
| 2001 | 13.10 | 0.70 | 5 | 11.12 | 1.22 | 1 | 10.23 | 0.61 | 0.12 | 2 | K0,K1 | 1,2 | 7-20 | 1 | 690 | – | – | D1 | |
| 2006 | 12.88 | 1.00 | 0.72 | 6 | 12.49 | 1.34 | 1 | 11.31 | 0.71 | 0.33 | 4 | K4 | 2 | 28 | 3 | 696 | – | – | C3 |
| 2020 | 12.02 | 0.97 | 0.43 | 1 | 10.88 | 1.06 | 1 | 10.10 | 0.49 | 0.16 | 1 | K2:K0 | 1,2 | 36,38,42 | 1,3,14 | 698 | – | – | C3 |
| 2031 | 6.41 | -0.11 | -0.93 | 1 | 6.41 | 0.00 | 1 | 6.46 | 0.07 | 0.07 | 2 | B1 | 1,2,11 | 50:,30,10 | 1,9,10 | 714 | 37042 | – | D |
| 2033 | 11.73 | 0.91 | 0.16 | 3 | 10.59 | 1.19 | 1 | 9.73 | 0.55 | 0.19 | 2 | K1:G5 | 1,2 | 56,64 | 1,14 | 713 | – | – | D |
| 2035 | 9.80 | 0.20 | 0.13 | 1 | 9.47 | 0.32 | 4 | 9.48 | 0.02 | -0.02 | 1 | A3 | 1 | 106 | 1 | 720 | – | – | C4 |
| 2036 | 9.76 | 0.41 | 0.08 | 1 | 9.24 | 0.52 | 4 | 8.87 | 0.25 | 0.28 | 1 | F2 | 1,3 | 57 (SB:15) | 1 | 718 | – | – | C4 |
| 2037 | 2.76 | -0.25 | -1.07 | 1 | 3.03 | -0.26 | – | 3.31 | – | O9III | 3,11 | 120 | 13 | 721 | 37043 | 1899 | C4 | ||
| 2047 | 14.00 | 0.90 | 9 | 12.37 | 1.75 | 1 | 11.00 | 0.73 | 0.24 | 2 | M0 | 2 | 12 | 3 | 732 | – | – | D | |
| 2048 | 13.90 | 1.10 | 9 | 12.13 | 1.82 | 1 | 10.85 | 0.70 | 0.15 | 2 | K8 | 2 | 14 | 3 | 733 | – | – | D1 | |
| 2058 | 9.57 | 0.04 | 0.03 | 1 | 9.47 | 0.00 | 1 | 9.41 | 0.07 | 0.02 | 2 | A0 | 1,2 | 170,200 | 1,9 | 734 | – | – | D |
| 2065 | 9.08 | -0.01 | -0.20 | 1 | – | 9.14 | -0.02 | -0.03 | 1 | B9,B8 | 1,3 | 180 | 1 | 736 | 37059 | – | C2 | ||
| 2069 | 12.30 | 1.02 | 5 | 10.84 | 1.25 | 1 | 9.95 | 0.64 | 0.06 | 2 | K3 | 1 | 38,44 | 1,3 | 744 | – | – | D1 | |
| 2074 | 6.83 | 0.26 | -0.69 | 1 | 6.31 | 0.53 | 1 | 5.84 | 0.19 | 0.09 | 1 | B2,B1 | 1,2,11 | 225,160 (SB1) | 1,9/10 | 747 | 37061 | – | D1 |
| 2083 | 7.30 | -0.13 | -0.78 | 1 | – | 7.66 | -0.02 | -0.03 | 1 | B4,B3p | 1,11 | 50:,10 | 1,10 | 761 | 37058 | – | C2 | ||
| 2084 | 12.49 | 1.31 | 0.40 | 1 | 10.90 | 1.65 | 1 | 9.44 | 0.85 | 0.43 | 2 | K3,K4 | 1,2 | 19-20 | 1 | 757 | – | – | C3 |
| 2085 | 8.21 | 0.02 | -0.47 | 1 | 8.03 | 0.21 | 1 | 7.88 | 0.19 | 0.10 | 2 | B4,B5 | 12,11,1,2 | 50:,140 | 1,9 | 760 | 37062 | – | D |
| 2086 | 9.95 | 0.50 | 0.22 | 1 | 9.29 | 0.57 | 1 | 8.81 | 0.54 | 0.61 | 1 | F5 | 1,2 | 72 (SB:25) | 1 | 767 | – | – | D1 |
| 2100 | 11.80 | 0.94 | 4 | 10.30 | 1.42 | 1 | 9.32 | 0.67 | 0.17 | 2 | K0:G0 | 1,2 | 72,45,66 | 1,3,14 | 773 | – | – | D1 | |
| 2102 | 9.36 | 0.04 | -0.01 | 1 | 9.37 | 0.03 | 3 | 9.31 | 0.01 | -0.05 | 1 | A0 | 1,3,11 | 250,200 | 1,9 | 776 | 37060 | – | C3 |
| 2118 | 9.90 | 0.08 | 0.07 | 1 | 9.80 | 0.08 | 1 | 9.22 | 0.56 | 0.27 | 1 | A1,A0 | 1,2 | 50:,400/50 | 1,9 | 786 | – | – | C3 |
| 2167 | 11.39 | 1.02 | 0.61 | 3 | 10.20 | 1.10 | 1 | 9.37 | 0.54 | 0.18 | 2 | K0 | 1,2 | 57 | 1 | 831 | – | – | D1 |
| 2216 | 12.08 | 1.04 | 0.45 | 6 | 10.89 | 1.19 | 1 | 10.06 | 0.60 | 0.29 | 1 | K2: | 1 | 54 | 1 | 864 | – | – | C3 |
| 2244 | 12.35 | 1.25 | 0.46 | 1 | 11.24 | 1.38 | 3 | 10.09 | 0.64 | 0.16 | 1 | K3,K1 | 1,4 | 51,65 | 1,5 | 887 | – | – | C3 |
| 2247 | 10.00 | 0.41 | 0.41 | 1 | 9.60 | 0.70 | 1 | 8.32 | 1.04 | 1.00 | 1 | A3 | 1,2 | 140 | 1 | 884 | – | – | D1 |
| 2252 | 11.61 | 0.88 | 0.36 | 1 | 10.52 | 1.00 | 5,3 | 9.65 | 0.61 | 0.43 | 1 | G8,G7 | 1,3,4 | 33,43 | 1,7 | 892 | – | – | C3 |
| 2257 | 12.21 | 0.87 | 0.31 | 1 | 11.27 | 0.93 | 4 | 10.63 | 0.46 | 0.08 | 1 | K0: | 1 | 47,51 | 1,3 | 900 | – | – | C2 |
| 2271 | 7.10 | -0.07 | -0.51 | 1 | 7.11 | -0.01 | 1 | 7.20 | 0.02 | 0.06 | 1 | B6pe | 1,2,11 | 250:,260/180 | 1,9 | 907 | 37115 | – | D1 |
| 2284 | 9.03 | 0.01 | -0.11 | 1 | 9.07 | -0.08 | 1 | 8.99 | -0.02 | 0.01 | 1 | B9.5,B8 | 1,2,11 | 180,245 | 1,9 | 920 | 37114 | – | D1 |
| 2305 | 13.30 | 1.40 | 5 | 11.79 | 1.57 | 1 | 10.71 | 0.65 | 0.11 | 2 | K6-K7 | 2 | 12 | 3 | 935 | – | – | D1 | |
| 2333 | 11.70 | 0.88 | 5 | – | 10.10 | 0.40 | 0.09 | 1 | K0 | 1 | 43,12 | 1,3 | 953 | – | – | D1 | |||
| 2346 | 10.96 | 0.52 | 0.05 | 1 | 10.34 | 0.58 | 5,4 | 9.91 | 0.24 | -0.02 | 1 | G0 | 3 | 88 | 7 | 961 | – | – | C1 |
| 2358 | 11.00 | 0.61 | 0.07 | 1 | 10.25 | 0.71 | 5 | 9.74 | 0.28 | 0.06 | 1 | G0 | 6 | 35,58 | 3,7 | 973 | – | – | C1 |
| 2366 | 6.57 | -0.17 | -0.79 | 1 | – | 7.00 | -0.07 | -0.07 | 1 | B2,B3 | 12,1,3,11 | 175,300 | 1,9 | 980 | 37150 | 1906 | D1 | ||
| 2368 | 13.56 | 1.54 | 1.50 | 1 | - | 0.15 | 4 | K4,K6 | 3 | 24 | 11 | 982 | – | – | C3 | ||||
| 2370 | 10.60 | 0.56 | 5 | 9.77 | 0.71 | 5 | 9.41 | 0.32 | 0.08 | 1 | G2 | 6 | 160 | 7 | – | – | – | C | |
| 2387 | 9.22 | -0.01 | -0.10 | 1 | 9.24 | -0.02 | 1 | 9.28 | 0.02 | 0.00 | 2 | A0,B9 | 1,2,11 | 125,190 | 1,9 | 992 | 37174 | – | D1 |
| 2404 | 11.30 | 0.70 | 0.18 | 1 | 10.48 | 0.76 | 5,4 | - | G2,G1 | 1,5 | 29,22 | 1,7 | 1004 | – | – | D1 | |||
| 2412 | 12.82 | 0.98 | 0.67 | 8 | – | 0.57 | 4 | K3 | 9 | 47 | 11 | – | – | – | C | ||||
| 2441 | 10.76 | 0.70 | 0.15 | 1 | 9.92 | 0.84 | 5,4 | 9.12 | 0.52 | 0.41 | 1 | G2 | 3 | 18 | 7 | 1030 | – | – | C1 |
| 2486 | 11.37 | 0.61 | 0.04 | 1 | 10.69 | 0.69 | 5 | 10.22 | 0.27 | 0.07 | 1 | G5,G7 | 3,6 | 120 | 7 | 1060 | – | – | C3 |
| 2494 | 10.80 | 0.90 | 0.43 | 1 | 9.75 | 0.99 | 5 | 9.03 | 0.46 | 0.12 | 1 | F7,G0,K0 | 6,3,4 | 26 | 7 | 1069 | – | – | C |
| 2602 | 6.20 | -0.04 | -0.73 | 2 | – | – | B1.5,B2 | 12,11,7 | 20,10 | 4,10 | 1129 | 37356 | 1923 | C | |||||
| 2660 | 11.27 | 0.54 | 0.04 | 7 | 10.65 | 0.62 | 5 | 10.27 | 0.26 | -0.02 | 1 | F6 | 6 | 175 | 7 | – | – | – | C |
| 2711 | 5.96 | -0.24 | -0.92 | 2 | – | 6.50 | -0.09 | -0.08 | 1 | B1.5,IV | 12,7,11 | 60,105 | 4,10 | – | 37481 | 1933 | C | ||
| 2758 | 7.61 | -0.13 | -0.55 | 2 | 7.77 | -0.16 | – | – | B3 | 10,11 | 130 | 8 | – | 37526 | – | C | |||
| 2921 | 8.01 | -0.10 | -0.47 | 2 | 8.18 | -0.17 | – | – | B5-B6 | 10,11 | 125 | 8 | – | 37700 | – | C |
| Par. | vsini | vsini aavsini references: this paper unless otherwise indicated as (1) Hartmann, 1986; (2) Duncan, 1993; (3) Wolff, Edwards, & Preston 1982; (4) Smith, Beckers, & Barden 1983; (5) McNamara, 1963; (6) McNamara & Larsson 1962; (7) Hartmann et al. 1996, private communication; (8) Conti & Ebbets 1977; | AV | log Teff | log L | R | log I | conv./rad. aavsini references: this paper unless otherwise indicated as (1) Hartmann, 1986; (2) Duncan, 1993; (3) Wolff, Edwards, & Preston 1982; (4) Smith, Beckers, & Barden 1983; (5) McNamara, 1963; (6) McNamara & Larsson 1962; (7) Hartmann et al. 1996, private communication; (8) Conti & Ebbets 1977; | log A | M | (H-K) |
|---|---|---|---|---|---|---|---|---|---|---|---|
| adopted | ref | mag | K | L⊙ | R⊙ | g cm2 | yr | M⊙ | mag | ||
| 82 | 200 | 5 | 0.10 | 4.037 | 2.15 | 3.40 | 55.43 | R | 6.15 | 3.74 | |
| 378 | 15 | 5 | 0.08 | 4.025 | 1.84 | 2.51 | 54.98 | R | 6.46 | 2.90 | -0.03 |
| 597 | 25 | 5 | 0.42 | 4.025 | 2.16 | 3.65 | 55.46 | R | 6.13 | 3.75 | |
| 679 | 15 | 3 | 0.17 | 4.276 | 3.43 | 4.94 | 55.77 | R | 8.01 | -0.04 | |
| 854 | 190 | 5 | 0.20 | 4.130 | 2.56 | 3.54 | 55.49 | R | 6.03 | 4.45 | -0.03 |
| 908 | 135 | 5 | 0.10 | 4.037 | 1.81 | 2.31 | 54.91 | R | 6.51 | 2.83 | -0.04 |
| 1044 | 50 | 0.79 | 4.294 | 3.13 | 3.21 | 55.55 | R | 6.47 | -0.01 | ||
| 1049 | 20 | 1.20 | 3.623 | 1.14 | 7.18 | 55.78 | C | 4.52 | 0.71 | 0.70 | |
| 1076 | 22 | 7 | 0.17 | 3.708 | 0.21 | 1.67 | 54.71 | R | 6.84 | 1.39 | 0.36 |
| 1097 | 150 | 5 | 0.14 | 4.053 | 1.95 | 2.50 | 55.05 | R | 6.39 | 3.14 | 0.00 |
| 1126 | 80 | 0.30 | 4.025 | 1.79 | 2.38 | 54.92 | R | 6.52 | 2.80 | -0.04 | |
| 1179 | 114 | 0.14 | 3.790 | 0.55 | 1.68 | 54.29 | R | 7.11 | 1.41 | -0.02 | |
| 1270 | 16 | 7 | 0.34 | 3.708 | 0.48 | 2.26 | 55.19 | C/R | 6.47 | 1.71 | 0.17 |
| 1319 | 187 | 1.60 | 3.761 | 0.72 | 2.36 | 54.84 | R | 6.80 | 1.72 | -0.00 | |
| 1322 | 70 | 0.49 | 3.736 | 0.66 | 2.45 | 55.14 | R | 6.56 | 1.91 | 0.01 | |
| 1326 | 20 | 1.08 | 3.643 | 1.24 | 7.34 | 55.97 | C | 4.62 | 0.96 | 0.00 | |
| 1345 | 20 | 0.46 | 3.643 | 0.73 | 4.07 | 55.40 | C | 5.57 | 0.84 | 0.04 | |
| 1360 | 15 | 2 | 0.77 | 3.736 | -0.07 | 1.05 | 53.98 | R | 7.46 | 1.00 | |
| 1374 | 77 | 0.32 | 3.798 | 1.25 | 3.62 | 55.07 | R | 6.59 | 2.22 | -0.01 | |
| 1391 | 20 | 0.17 | 3.788 | 0.92 | 2.59 | 54.71 | R | 6.86 | 1.74 | 0.01 | |
| 1393 | 20 | 0.42 | 3.748 | 0.58 | 2.11 | 54.82 | R | 6.81 | 1.65 | -0.00 | |
| 1394 | 60 | 0.28 | 3.798 | 1.24 | 3.60 | 55.07 | R | 6.59 | 2.21 | 0.25 | |
| 1404 | 34 | 2 | 0.67 | 3.753 | 0.93 | 3.10 | 55.29 | R | 6.49 | 2.19 | 0.37 |
| 1408 | 21 | 0.17 | 3.623 | 0.36 | 1.65 | 55.01 | C | 5.78 | 0.68 | 0.02 | |
| 1409 | 29 | 0.91 | 3.771 | 0.83 | 2.55 | 54.84 | R | 6.80 | 1.78 | 0.47 | |
| 1414 | 29 | 0.20 | 3.766 | 0.60 | 2.00 | 54.55 | R | 6.98 | 1.48 | -0.03 | |
| 1425 | 26 | 0.75 | 3.742 | 0.64 | 2.32 | 55.03 | R | 6.66 | 1.82 | 0.04 | |
| 1440 | 20 | 0.17 | 3.661 | 0.27 | 2.21 | 54.99 | C | 6.23 | 1.12 | -0.04 | |
| 1445 | 280 | 0.13 | 4.111 | 2.31 | 2.90 | 55.33 | R | 6.15 | 3.94 | -0.02 | |
| 1455 | 21 | 0.26 | 3.771 | 1.00 | 3.10 | 55.10 | R | 6.61 | 2.07 | 0.05 | |
| 1484 | 49 | 0.84 | 3.708 | 0.79 | 3.22 | 55.56 | C | 6.07 | 1.96 | -0.02 | |
| 1491 | 225 | 0.08 | 4.053 | 2.40 | 4.21 | 55.55 | R | 6.05 | 4.10 | 0.01 | |
| 1505 | 20 | 0.01 | 3.695 | 0.10 | 1.56 | 54.67 | R | 6.86 | 1.31 | 0.01 | |
| 1507 | 136 | 0.45 | 3.907 | 1.16 | 1.99 | 54.40 | R | 6.93 | 1.82 | -0.01 | |
| 1510 | 38 | 1.19 | 3.695 | 0.87 | 3.77 | 55.66 | C | 5.83 | 1.72 | 0.03 | |
| 1511 | 112 | 0.40 | 3.960 | 1.73 | 2.98 | 55.06 | R | 6.48 | 2.75 | -0.04 | |
| 1518 | 38 | 2 | 0.17 | 3.695 | -0.10 | 1.24 | 55.29 | R | 7.18 | 1.09 | 0.15 |
| 1539 | 250 | 2.47 | 4.053 | 2.02 | 2.72 | 55.17 | R | 6.30 | 3.37 | -0.05 | |
| 1540 | 20 | 0.76 | 3.661 | 1.20 | 6.46 | 55.94 | C | 5.28 | 1.23 | 0.09 | |
| 1541 | 20 | 0.38 | 3.695 | 0.48 | 2.40 | 55.21 | C | 6.31 | 1.58 | 0.06 | |
| 1552 | 15 | 2 | 0.17 | 3.602 | 0.21 | 2.71 | 54.84 | C | 5.84 | 0.55 | 0.56 |
| 1553 | 28 | 1.53 | 3.695 | 1.01 | 4.41 | 55.81 | C | 5.68 | 1.78 | 0.29 | |
| 1554 | 30 | 0.28 | 3.713 | 0.37 | 1.95 | 54.94 | R | 6.66 | 1.58 | -0.00 | |
| 1562 | 200 | 0.46 | 4.012 | 1.63 | 2.10 | 54.70 | R | 6.67 | 2.46 | -0.05 | |
| 1581 | 20 | 0.93 | 3.806 | 0.49 | 1.46 | 54.18 | R | 7.21 | 1.36 | -0.00 | |
| 1587 | 20 | 1.34 | 3.695 | 0.85 | 3.69 | 55.63 | C | 5.84 | 1.71 | 0.04 | |
| 1605 | 127 | 0.29 | 3.933 | 2.16 | 5.54 | 55.70 | R | 6.00 | 3.78 | 0.48 | |
| 1608 | 26 | 0.17 | 3.652 | 0.20 | 2.14 | 54.93 | C | 6.22 | 1.02 | -0.01 | |
| 1623 | 260 | 1.58 | 3.940 | 1.70 | 3.15 | 55.08 | R | 6.48 | 2.72 | 0.38 | |
| 1626 | 94 | 1.76 | 3.917 | 1.30 | 2.23 | 54.55 | R | 6.83 | 1.98 | -0.05 | |
| 1634 | 150 | 0.04 | 4.086 | 2.11 | 2.58 | 55.18 | R | 6.27 | 3.51 | -0.03 | |
| 1643 | 20 | 0.17 | 3.719 | 0.06 | 1.33 | 54.35 | R | 7.16 | 1.17 | 0.10 | |
| 1646 | 20 | 0.10 | 3.798 | 1.22 | 3.51 | 55.03 | R | 6.62 | 2.16 | -0.07 | |
| 1654 | 120 | 0.51 | 4.053 | 1.99 | 2.65 | 55.14 | R | 6.33 | 3.29 | 0.01 | |
| 1657 | 20 | 0.17 | 3.778 | 0.57 | 1.82 | 54.42 | R | 7.06 | 1.43 | -0.02 | |
| 1659 | 20 | 0.84 | 3.679 | 1.08 | 5.16 | 55.84 | C | 5.47 | 1.46 | 0.16 | |
| 1660 | 275 | 0.20 | 4.025 | 1.89 | 2.67 | 55.09 | R | 6.40 | 3.07 | -0.00 | |
| 1664 | 180: | 0.21 | 4.210 | 2.76 | 3.10 | 55.45 | R | 5.98 | 4.93 | 0.05 | |
| 1671 | 175 | 0.31 | 3.897 | 1.35 | 2.58 | 54.66 | R | 6.76 | 2.04 | -0.04 | |
| 1679 | 20 | 0.17 | 3.695 | 0.40 | 2.19 | 55.12 | C | 6.42 | 1.55 | 0.04 | |
| 1683 | 50 | 1.51 | 3.985 | 1.41 | 1.84 | 55.09 | R | 2.58 | -0.04 | ||
| 1685 | 201 | 0.73 | 4.025 | 1.62 | 1.97 | 54.67 | R | 6.69 | 2.47 | 0.22 | |
| 1691 | 68 | 4 | 0.26 | 3.755 | 0.73 | 2.44 | 54.97 | R | 6.71 | 1.82 | 0.01 |
| 1698 | 50 | 0.24 | 3.980 | 1.72 | 2.69 | 54.96 | R | 6.53 | 2.68 | -0.01 | |
| 1708 | 50 | 0.47 | 4.272 | 3.09 | 3.40 | 55.52 | R | 6.32 | 0.00 | ||
| 1712 | 75 | 2.03 | 4.025 | 1.89 | 2.67 | 55.09 | R | 6.40 | 3.07 | 0.01 | |
| 1716 | 10 | 6 | 0.24 | 4.377 | 3.88 | 5.24 | 56.14 | R | 11.30 | ||
| 1728 | 30 | 6 | 0.15 | 4.439 | 4.35 | 6.73 | 56.56 | R | 16.63 | ||
| 1736 | 41 | 2.10 | 3.761 | 1.51 | 5.83 | 56.03 | R | 5.90 | 3.43 | 0.08 | |
| 1744 | 75 | 0.21 | 4.195 | 2.63 | 2.86 | 55.37 | R | 6.05 | 4.64 | -0.02 | |
| 1746 | 36 | 0.76 | 3.702 | 0.98 | 4.14 | 55.79 | C | 5.80 | 1.97 | 0.66 | |
| 1768 | 180 | 0.17 | 4.025 | 1.64 | 2.01 | 54.69 | R | 6.67 | 2.50 | 0.03 | |
| 1772 | 80 | 1.03 | 4.294 | 3.06 | 2.98 | 55.50 | R | 6.19 | 0.08 | ||
| 1785 | 20 | 1.14 | 3.719 | 0.78 | 3.04 | 55.50 | C | 6.22 | 2.11 | 0.51 | |
| 1789 | 81 | 0.22 | 3.798 | 0.98 | 2.65 | 54.70 | R | 6.84 | 1.79 | -0.01 | |
| 1792 | 75 | 5 | 0.11 | 4.025 | 1.76 | 2.29 | 54.87 | R | 6.55 | 2.73 | 0.01 |
| 1795 | 350: | 0.23 | 4.025 | 1.76 | 2.29 | 54.87 | R | 6.55 | 2.73 | -0.03 | |
| 1798 | 50: | 1.84 | 4.272 | 2.79 | 2.40 | 55.31 | R | 5.17 | 0.11 | ||
| 1799 | 123 | 1.75 | 3.766 | 0.90 | 2.82 | 55.02 | R | 6.66 | 1.95 | 0.10 | |
| 1813 | 80 | 0.23 | 4.240 | 2.87 | 3.07 | 55.37 | R | 5.46 | 0.00 | ||
| 1828 | 29 | 0.62 | 3.679 | 0.66 | 3.20 | 55.40 | C | 5.89 | 1.35 | 0.40 | |
| 1849 | 50: | 0.03 | 4.070 | 2.00 | 2.47 | 55.08 | R | 6.36 | 3.26 | -0.02 | |
| 1865 | 50 | 1.04 | 4.471 | 4.15 | 4.64 | 56.38 | R | 14.08 | 0.14 | ||
| 1881 | 50 | 0.77 | 3.993 | 1.58 | 2.16 | 54.67 | R | 2.36 | -0.01 | ||
| 1891 | 100: | 0.97 | 4.603 | 5.09 | 7.44 | 57.34 | R | 33.36 | 0.06 | ||
| 1905 | 177 | 0.28 | 3.993 | 1.55 | 2.09 | 54.73 | R | 2.43 | 0.03 | ||
| 1923 | 125 | 1.20 | 3.917 | 1.00 | 1.04 | 54.27 | R | 7.67 | 1.74 | 0.24 | |
| 1929 | 34 | 0.17 | 3.679 | 0.14 | 1.75 | 54.87 | C/R | 6.65 | 1.32 | 0.32 | |
| 1933 | 125 | 0.34 | 4.307 | 3.42 | 4.26 | 55.77 | R | 7.98 | 0.01 | ||
| 1950 | 27 | 0.17 | 3.736 | 1.31 | 0.55 | 56.04 | R | 5.94 | 3.12 | 0.06 | |
| 1953 | 31 | 0.51 | 3.771 | 1.36 | 4.66 | 55.57 | R | 6.29 | 2.74 | 0.45 | |
| 1955 | 109 | 1.54 | 3.761 | 1.37 | 4.94 | 55.68 | R | 6.22 | 2.83 | 0.06 | |
| 1956 | 200 | 1.59 | 4.253 | 2.73 | 2.46 | 55.34 | R | 4.99 | 0.20 | ||
| 1971 | 18 | 2 | 0.02 | 3.623 | -0.01 | 1.91 | 54.72 | C | 6.26 | 0.80 | 0.01 |
| 1972 | 20 | 1.12 | 3.679 | 0.68 | 3.25 | 55.40 | C | 5.87 | 1.35 | -0.03 | |
| 1973 | 45 | 1 | 2.32 | 3.722 | 1.12 | 4.42 | 55.92 | C | 5.92 | 2.65 | 0.31 |
| 1993 | 150 | 0.74 | 4.543 | 4.88 | 7.69 | 57.11 | R | 27.07 | 0.01 | ||
| 1996 | 63 | 0.20 | 3.766 | 0.79 | 2.48 | 54.86 | R | 6.79 | 1.77 | -0.04 | |
| 2001 | 20 | 0.17 | 3.708 | 0.16 | 1.56 | 54.59 | R | 6.93 | 1.31 | 0.03 | |
| 2006 | 28 | 2 | 0.17 | 3.661 | 0.21 | 2.06 | 54.94 | C | 6.33 | 1.15 | 0.22 |
| 2020 | 36 | 0.64 | 3.719 | 0.62 | 2.52 | 55.25 | R | 6.42 | 1.89 | 0.05 | |
| 2031 | 50: | 0.53 | 4.383 | 3.88 | 5.05 | 56.14 | R | 11.23 | 0.09 | ||
| 2033 | 56 | 0.78 | 3.744 | 0.90 | 3.10 | 55.37 | R | 6.42 | 2.22 | 0.08 | |
| 2035 | 106 | 0.47 | 3.945 | 1.39 | 2.16 | 54.54 | R | 6.82 | 2.06 | -0.06 | |
| 2036 | 57 | 0.14 | 3.826 | 1.26 | 3.22 | 54.88 | R | 6.68 | 2.09 | 0.24 | |
| 2037 | 120 | 8 | 0.22 | 4.555 | 5.48 | 14.46 | 57.80 | R | 49.83 | ||
| 2047 | 12 | 2 | 0.17 | 3.580 | 0.19 | 2.92 | 54.78 | C | 5.74 | 0.41 | 0.03 |
| 2048 | 14 | 2 | 0.17 | 3.591 | 0.18 | 2.76 | 54.80 | C | 5.82 | 0.48 | -0.04 |
| 2058 | 170 | 0.24 | 3.993 | 1.61 | 2.24 | 54.69 | R | 6.68 | 2.38 | 0.01 | |
| 2065 | 180 | 0.19 | 4.037 | 1.74 | 2.13 | 54.81 | R | 6.58 | 2.70 | -0.03 | |
| 2069 | 38 | 0.25 | 3.679 | 0.57 | 2.88 | 55.30 | C | 5.99 | 1.34 | -0.04 | |
| 2074 | 225 | 1.68 | 4.383 | 4.17 | 7.06 | 56.39 | R | 14.23 | 0.03 | ||
| 2083 | 50: | 0.19 | 4.200 | 2.85 | 3.59 | 55.36 | R | 5.38 | -0.01 | ||
| 2084 | 20 | 0.88 | 3.661 | 0.65 | 3.43 | 55.36 | C | 5.73 | 1.06 | 0.28 | |
| 2085 | 50: | 0.68 | 4.210 | 2.84 | 3.40 | 55.35 | R | 5.36 | 0.09 | ||
| 2086 | 72 | 0.21 | 3.806 | 1.35 | 3.93 | 55.15 | R | 6.53 | 2.35 | 0.56 | |
| 2100 | 72 | 1.19 | 3.771 | 1.01 | 3.12 | 55.11 | R | 6.60 | 2.09 | 0.05 | |
| 2102 | 250 | 0.24 | 3.993 | 1.55 | 2.09 | 54.73 | R | 2.43 | -0.06 | ||
| 2118 | 50: | 0.37 | 3.993 | 1.38 | 1.72 | 54.99 | R | 2.77 | 0.25 | ||
| 2167 | 57 | 0.80 | 3.719 | 1.07 | 4.27 | 55.90 | C | 5.92 | 2.53 | 0.06 | |
| 2216 | 54 | 0.54 | 3.695 | 0.59 | 2.74 | 55.34 | C | 6.15 | 1.62 | 0.17 | |
| 2244 | 51 | 1.19 | 3.695 | 0.75 | 3.27 | 55.60 | C | 5.96 | 1.67 | 0.00 | |
| 2247 | 140 | 1.08 | 3.940 | 1.69 | 3.15 | 55.08 | R | 6.48 | 2.71 | 0.92 | |
| 2252 | 33 | 0.58 | 3.736 | 0.73 | 2.66 | 55.26 | R | 6.48 | 2.03 | 0.33 | |
| 2257 | 47 | 0.33 | 3.719 | 0.42 | 2.00 | 54.96 | R | 6.66 | 1.63 | -0.01 | |
| 2271 | 250: | 0.19 | 4.111 | 2.90 | 5.71 | 55.39 | R | 5.55 | 0.07 | ||
| 2284 | 180 | 0.30 | 4.053 | 1.99 | 2.64 | 55.14 | R | 6.33 | 3.29 | 0.00 | |
| 2305 | 12 | 2 | 0.40 | 3.612 | 0.43 | 3.34 | 55.05 | C | 5.67 | 0.58 | -0.04 |
| 2333 | 43 | 0.36 | 3.719 | 0.78 | 3.03 | 55.50 | C | 6.23 | 2.10 | -0.01 | |
| 2346 | 88 | 4 | 0.17 | 3.771 | 0.79 | 2.43 | 54.77 | R | 6.84 | 1.71 | -0.08 |
| 2358 | 35 | 2 | 0.17 | 3.771 | 0.78 | 2.39 | 54.75 | R | 6.85 | 1.69 | 0.00 |
| 2366 | 175 | 0.25 | 4.309 | 3.54 | 4.80 | 55.86 | R | 8.66 | -0.04 | ||
| 2368 | 24 | 7 | 1.32 | 3.643 | 0.45 | 2.96 | 55.12 | C | 5.82 | 0.85 | -0.04 |
| 2370 | 160 | 4 | 0.17 | 3.761 | 0.94 | 3.03 | 55.19 | R | 6.55 | 2.12 | 0.02 |
| 2387 | 125 | 0.17 | 4.010 | 1.75 | 2.44 | 54.90 | R | 6.53 | 2.73 | -0.00 | |
| 2404 | 29 | 0.33 | 3.761 | 0.87 | 2.79 | 55.08 | R | 6.63 | 1.98 | ||
| 2412 | 47 | 7 | 0.12 | 3.679 | 0.17 | 1.81 | 54.93 | C/R | 6.60 | 1.33 | 0.47 |
| 2441 | 18 | 4 | 0.33 | 3.761 | 0.94 | 3.03 | 55.20 | R | 6.55 | 2.12 | 0.34 |
| 2486 | 120 | 4 | 0.17 | 3.745 | 0.65 | 2.33 | 55.01 | R | 6.68 | 1.82 | 0.00 |
| 2494 | 26 | 4 | 0.85 | 3.753 | 1.15 | 3.96 | 55.55 | R | 6.31 | 2.55 | 0.01 |
| 2602 | 20 | 3 | 0.68 | 4.332 | 3.76 | 5.62 | 56.04 | R | 10.29 | ||
| 2660 | 175 | 4 | 0.22 | 3.795 | 0.68 | 1.91 | 54.39 | R | 7.05 | 1.48 | -0.07 |
| 2711 | 60 | 3 | 0.09 | 4.352 | 3.67 | 4.58 | 55.96 | R | 9.55 | -0.04 | |
| 2758 | 130 | 5 | 0.32 | 4.272 | 2.92 | 2.81 | 55.41 | R | 5.65 | ||
| 2921 | 125 | 5 | 0.13 | 4.125 | 2.39 | 2.99 | 55.36 | R | 6.12 | 4.10 |