Clustering and light profiles of galaxies in the environment of 20 Ultra Steep Spectrum Radio sources 11affiliation: Based on observations obtained at Cerro Tololo Inter-American Observatory, a division of the National Optical Astronomy Observatories, which is operated by the Association of Universities for Research in Astronomy, Inc. under cooperative agreement with the National Science Foundation.
Abstract
We have analyzed galaxy properties in the neighborhood of 20 Ultra-Steep Spectrum Radio sources (USS) taken from the WISH catalog of De Breuck et al. (2002). Galaxies in these USS fields were identified in deep observations that were carried out in the band using the OSIRIS imager at the CTIO 4m telescope. We find a statistically significant signal of clustering around our sample of USS. The angular extension of the detected USS-galaxy clustering is corresponding to a spatial scale , assuming the sources are at in a , model universe. These results are in agreement with those obtained by Best (2000) for radio galaxy-galaxy correlation, and Best et al. (2003) for radio-loud AGN-galaxy correlation. We have also analyzed the light distribution of the galaxies by fitting Sérsic’s law profiles. Our results show no significant dependence of the galaxy shape parameters on the projected distance to the USS.
1 Introduction
In current hierarchical galaxy formation scenarios such as CDM models, the most massive galaxies at high redshifts are expected to form in over-dense regions corresponding to the precursors of present-day clusters of galaxies (e.g. White 1997). The first massive black holes may also grow in a similar hierarchical way than the parent galaxies where gas infall by massive cooling flows might be the key to understand both, galaxy and black hole formation. There is also the question whether massive black holes could have been formed before host galaxies (Kauffmann & Haehnelt 1999) and therefore the need of high census of radio population and galaxies. It is suggested that mergers are associated to powerful radio sources. Since they provide efficient mechanisms to trigger star formation and stimulate AGN phenomena, therefore it is expected some correlation between radio properties and star formation signatures.
At low redshift, radio sources are found in massive elliptical galaxies and AGNs ( accreting black holes) being radio emission a common feature in bright elliptical galaxies. However, powerful radio sources are found only in bright ellipticals (see for instance Lilly & Longair 1984, Best, Longair & Röttgering 1998). It is also found that their comoving space densities were much larger (100-1000 times) in the past () than present-day radio galaxies.
Radio sources are good beacons for pinpointing massive elliptical galaxies at least up to redshift . There is the well known existence of a very good correlation between band magnitude and redshift for powerful radio sources (van Breugel et al. 1998, De Breuck et al. 2001) and this appears to hold up to , despite large corrections and morphological changes (van Breugel et al. 1999). Therefore, radio sources may be used to find massive galaxies and their progenitors out to high redshift through near-IR identification. While optical techniques have been successful in identifying ‘normal’ young galaxies at high redshift, the radio and near-IR selection technique has the advantage that it is less biased with respect to the dust extinction.
Ultra-Steep Radio continuum spectrum sources correspond to sources with spectral index in the frequency range MHz. These sources are less frequently identified () in POSS Plates, , so that they are likely to be associated to foreground objects. Radio sources with ultra steep spectrum (hereafter USS) are good candidates for high redshift galaxies so that identification of bright radio sources with faint galaxies provides a convenient procedure to locate distant galaxies and clusters (De Breuck et al. 2001).
Previous studies suggest that the radio galaxy is not always the brightest cluster member, although it is among the brightest galaxies. It has been suggested by Chapman et al (2002) that radio sources could reside in a compact environment, distinct from rich X-ray selected clusters at similar redshifts. Best (2000) analyzing the environment of 28 3CR radio-galaxies found a net overdensity of band galaxies with the mean excess counts being comparable to that expected for clusters of Abell class 0 richness, concluding that many powerful radio galaxies are located in cluster environments. In this paper we aim to address the nature of the density enhancement of galaxies around high redshift ultra steep spectrum radio sources by studying the galaxy clustering around USS and the properties of the light distribution of galaxies in these environments. This paper is organized as follows: Section 2 describes the sample of USS used, the data reduction and galaxy identification. We analyze the resulting number counts in Section 3. In Section 4 we study the clustering of galaxies around USS. Section 5 deals with the morphological properties of galaxies around USS. Finally we discuss our results in Section 6.
2 Data
We used 20 sources selected from the 352 MHz Westerbork In the Southern Hemisphere (WISH) survey restricted to have an ultra steep radio continuum spectrum . These USS radio sources have been selected basically on their radio properties. The first priority targets are unresolved in the radio (i.e. have a point source morphology), and the second priority targets have a small radio size (, based on the VLA maps). All of the first and most of the second priority targets have been observed. We have selected against large radio sources because those are most likely foreground objects, and not at high redshift. This sample is aimed at increasing the number of known high redshift radio galaxies to allow detailed follow-up studies of these massive galaxies and their environments in the early Universe (De Breuck et al. 2002). The galaxy sample used in this work consists in galaxies identified in deep images in the near infrared band of our 20 USS fields, obtained in the 4meter V.M. Blanco telescope at CTIO using the OSIRIS imager. All the images were obtained under optimum seeing conditions with FWHM in the range . We found clear band counterpart of radio sources in 7 frames. Table 1 lists the WISH designation, position, the spectral index , the counterpart magnitude and the 1.5 limiting magnitude per field.
2.1 Data acquisition and reduction
The 20 USS fields analyzed here were observed during two runs on March 2000 and January 2001 using the OSIRIS imager on the 4meter V.M. Blanco telescope at CTIO. The pixel scale is in a pixels CCD array with an effective field of view once spurious objects near boundary regions are rejected.
We used a 16point nonredundant dithering pattern, which was slightly tilted to have no redundancies (i.e. none of the grid points land on the same row or column number on the CCD, in this way one effectively removes row/column related defects). Each source was observed for 1 grid, with 12 co-adds of 10s at each grid point. This results in minutes on source. During the observations, tip-tilt mirror corrections were made. This resulted in typical FWHMs on the individual pointing frames ( co-added) of to . The mean was around for the nights 03/20-22/2000, and around on the Jan 2001 run.
Both runs were photometric, and a fair number of standard stars have been observed on each night. The variations in the zero-points was negligible. Standard stars were taken from the NICMOS near-IR standard list (Persson et al. 1998). The magnitude calibration zero point is 22.669 mag. Data were reduced within IRAF111Image Reduction and Analysis Facility (IRAF), a software system distributed by the National Optical Astronomy Observatories (NOAO), using the standard DIMSUM (Stanford, Eisenhardt, & Dickinson 1995) near-IR reduction package. Since the observing conditions at CTIO were good, the resulting images are of a high quality, very flat and with uniform backgrounds.
2.2 Source detection and photometry
We have used the SExtractor package version 2.1 (Bertin & Arnouts 1996) for photometry, object detection and galaxy-star separation in the fields. The source extraction parameters were set so that an object to be detected must have a flux in excess of 1.5 times the local background noise level over at least ten connected pixels.
SExtractor’s MAG_BEST estimator was used to determine the magnitudes of the sources; this yields an estimate for the total magnitude using Kron’s (1980) first moment algorithm, except if there is a nearby companion which may bias the total magnitude estimate by more than 10% in which case a corrected isophotal magnitude is used instead.
SExtractor provides an stellaricity index for each object, which is an indication of the likelihood of an object to be a galaxy or a star based on a neuronal network technique. In the ideal case, a galaxy and a star have a stellaricity index CLASS_STAR and 1.0 respectively. We have adopted in this work a limit in CLASS_STAR for an object to be a galaxy.
Our final catalog of galaxies in the analyzed USS frames comprises 400 objects with . magnitudes for USS are shown in Table 1.
3 band number counts
We have computed the mean number of galaxies per unit area in the fields as a function of apparent magnitude. The results are shown in Figure 1 and quoted in Table 2. Error bars were estimated using Poissonian errors. In Figure 1 we also compare our determinations with the number counts in the Subaru Deep Field (Totani et al. 2001), with determinations from the ESO band galaxy survey (Saracco et al. 1997) and with determinations from NTT Deep Field galaxy counts (Saracco et al. 1999), assuming a mean colour (Daddi et al. 2000). We also compare with the band surveys by Gardner, Cowie & Wainscoat (1993) and Best (2000), assuming a mean colour (Roche et al. 1998). All of these studies deal with field galaxies with the exception of Best (2000) and Best et al. (2003) which correspond to galaxies in the environment of radio-galaxies and galaxies in the environments of radio-loud AGN. We find a general agreement with these works where the marginal excess at we detect could be an indication of structure associated to the USS.
4 Angular cross-correlation function
In this section we analyze the clustering of galaxies around USS. We compute the angular two point cross-correlation function between the USS and the galaxies in their fields. We have used the following estimator of the angular cross-correlation function:
| (1) |
where and are the numbers of galaxies in the sample and in a random sample respectively, is the number of real pairs USS-galaxy separated by an angular distance in the range , and are the corresponding pairs when considering the random galaxy sample. We have done this computation for three subsamples of tracer galaxies defined by their apparent magnitude: , and . For USS, radio position were used. In Figure 2 we show the resulting USS-galaxy cross-correlation functions. We estimate correlation function error bars using the field-to-field variation of .
The angular correlation function is usually assumed to have a power-law form: . If so, the observed will follow a form
| (2) |
where is known as the integral constraint and arises from the finite size of the field of view. The integral constraint can be computed as
| (3) |
Using the random-random correlation, this calculation can be done numerically:
| (4) |
where is the number of random pairs of objects with angular distances between and .
For our sample geometry, and assuming , we find . For the subsample with we find a strong correlation with an amplitude , this is larger by a factor than the galaxy-galaxy correlation amplitude for obtained by Best (2000). On the other hand the subsample has a negligible cross-correlation amplitude . The strong cross-correlation signal between USS and galaxies with implies that they are physically associated on scales smaller than . This angular scale corresponds to , assuming the sources at (average redshift estimated using the Hubble diagram taken from De Breuck el al. 2002), and a flat cosmological model with density parameters and and a Hubble’s constant . This is not the case for galaxies brighter than , where we detect no significant correlation signal suggesting they are mostly foreground objects.
We have tested for the possibility of a biased tendency of detecting faint objects near the central positions of the frames where USS are located. We have computed USS-galaxy cross correlations for faint galaxies, and we find no significant correlation signal which indicates the lack of systematic effects in our analysis (see Figure 2).
Recall that when analyzing number counts we have found a marginal excess of with respect to previous determinations. Both, the cross-correlation analysis and the number counts lead us to support the idea that USS are related to high- radio galaxies located in protocluster environments.
One might question whether our galaxy sample is deep enough to provide a useful insight on the galaxy environment around these USS (estimated to be at , see above). First, we notice that the 1.5 detection limits for the fields analyzed are significantly fainter than our cutoff at . Also, one may consider other works that deal with band photometry of galaxies in clusters at redshifts as for instance Stanford et al. (2002), Blanton et al. (2003), and Stanford et al. (1997). In these studies, cluster member galaxies with measured spectroscopic redshifts have band magnitudes within the range of our analysis, indicating that our galaxy sample depth is appropriate for our study.
5 Light distribution profiles
To deepen our understanding on the nature of galaxies in the overdensities around USS, we provide a measure of galaxy morphology in the USS fields by analyzing the light distribution of galaxies in the images using IRAF STSDAS ELLIPSE package (Jedrzejewski 1987).
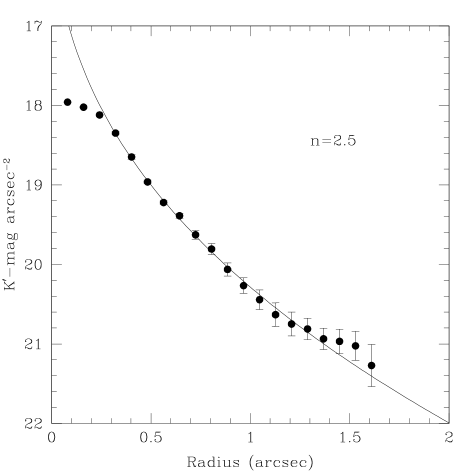
Since Sérsic’s law (Sérsic 1968) has proved to be useful in the characterization of galaxy luminosity profiles, we use it to fit the light distribution of tracer galaxies in our USS fields. Sérsic’s law can be written as:
| (5) |
where is the surface brightness at radius . The parameter is set equal to , so that remains the projected radius enclosing half of the galaxy’s light. We recall that corresponds to an exponential profile while corresponds to a de Vaucouleurs profile, characteristic of disks and early-type objects, respectively.
As analyzed in Section 4, galaxies with show a significant cross-correlation signal so that a large fraction of them are likely to be associated to USS. We have studied the light profiles and the corresponding Sérsic’s law fits. Due to the low signal to noise of many images we restricted our analysis to those profiles resolved with significant light well beyond the radius of the seeing disk. This results in a subsample of 31 galaxies, i.e. of the objects in the considered magnitude range. Four examples of our fitting procedure are displayed in Figure 3.
The interpretation of the observed shape parameter has been assessed using a set of simulated galaxies, which is discussed in the next subsection.
5.1 Simulating model galaxies to account for PSF effects
In order to establish the relation between observed and actual values of the shape index , we have tested our results on a set of simulated galaxies which are affected by PSF convolution.
We have chosen a set of 15 galaxies in our sample with effective radii in the range , different magnitudes (in the range of ) and observed Sérsic’s shape parameters . We created model galaxies similar to these and convolved them with the observed PSF to match the resolution of the data. Model galaxy images were built using the IRAF bmodel task and convolved using IRAF gauss task with a Gaussian function representing the PSF effects. The PSF FWHM in the simulation was set to , consistent with the average of our observations. Then, we fit Sérsic law profiles to the original and to the convolved model galaxies to determine the differences between input and observed values due to the effects of the PSF. In order to simulate realistic observed conditions in our simulations, we have included the contribution of the background noise present in our images. The background level is measured on blank sky regions close to the sources. We have estimated the uncertainty in the shape parameter values of the convolved galaxy images using the typical background noise fluctuation (1 level).
According to the results shown in Figure 4, it can be seen that objects with observed index correspond to galaxies with actual shape index values typical of late types. This result is similar to that obtained by Moth & Elston (2002) in their analysis of Hubble Deep Field galaxies. For the models show consistency with early type objects, that is intrinsic values . Therefore, we adopt this threshold in observed values to discriminate between late and early type galaxy morphologies.
We find that it is critical to take into account for the PSF effects when drawing conclusions from luminosity profiles since at small galaxy sizes and faint magnitudes, an profile can be substantially smoothed out. We find a tendency for high to be underestimated, furthermore, the higher the original value, the more it will be affected by the PSF (Moth & Elston 2002).
5.2 Light profiles properties
In Figure 5 we show the distribution of Sérsic’s shape parameter . The number of early type galaxies (14) almost equals that of late type galaxies (17), according to our criterion. The scatter-plot of vs. the angular distance to the radio source is shown in Figure 6, where uncertainties in shape parameters were estimated using background noise fluctuation as mentioned before.
The Spearman rank correlation coefficient for this relation is , indicating a lack of significant correlation between and the projected distance to the radio source. It should be noticed that the results shown in this figure are not likely to be biased by a selection criterion that could affect the conclusions. In fact, from the number of galaxies with measured light profiles as a function of the angular distance from the USS and the cross-correlation analysis of section 4, we infer that this subsample of 25 % of the galaxies is consistent with being extracted at random from the total sample in the USS fields.
Lubin, Oke & Postman (2002) found a trend of decreasing early-type fraction of galaxies in clusters with redshift, at . Although with poor number statistics, our results also suggest a similar low fraction of early types associated to USS overdensities.
6 Conclusions
We have identified galaxies in deep -band CCD frames centered in 20 Ultra Steep Spectrum radio sources selected from the WISH survey. These observations obtained with the OSIRIS imager at CTIO 4m telescope were carried out with excellent seeing conditions . We have performed statistical analysis of non-stellar objects in these frames in order to shed light on the properties of galaxies in the neighborhood of USS.
We find a strong correlation signal of galaxies with around the USS. The angular extension of the detected USS-galaxy clustering is small (), which would correspond to (assuming the sources at in the adopted cosmology).
The evidence from our cross-correlation analysis and number counts suggests that USS are located in protocluster environments at high redshifts.
Light distribution profiles of galaxies in the frames using Sérsic’s law fits indicate a lack of strong dependence of the shape parameter with the projected distance to the radio source.
References
- Bertin & Arnouts (1996) Bertin E., Arnouts S., 1996, A & A Supp. 117, 393
- Best, Longair, & Röttgering (1998) Best, P. N., Longair, M. S., & Röttgering, H. J. A. 1998, MNRAS, 295, 549
- Best (2000) Best, P. N. 2000, MNRAS, 317, 720
- Best (2003) Best, P. N., Lehnert, M. D., Miley, G., Röttgering, H., 2003, MNRAS, in press
- Blanton et al. (2003) Blanton, E. L., Gregg, M. D., Helfand, D. J., Becker, R. H., & White, R. L. 2003, AJ, 125, 1635
- Chap & McCarthy (2002) Chapman S.C.J., McCarthy P., Pearson, S.E., AJ, 120, 1612
- Daddi et al. (2000) Daddi, E., Cimatti, A., Pozzetti, L., Hoekstra, H., Röttgering, H. J. A., Renzini, A., Zamorani, G., & Mannucci, F. 2000, A&A, 361, 535
- De Breuck et al. (2002) De Breuck, C., Tang, Y., de Bruyn, A. G., Röttgering, H., & van Breugel, W. 2002, A&A, 394, 59
- De Breuck et al. (2002b) De Breuck, C., van Breugel, W., Stanford, S. A., Röttgering, H., Miley, G., & Stern, D. 2002b, AJ, 123, 637
- De Breuck et al. (2001) De Breuck, C. et al. 2001, AJ, 121, 1241
- Gardner, Cowie, & Wainscoat (1993) Gardner, J. P., Cowie, L. L., & Wainscoat, R. J. 1993, ApJL, 415, L9
- Jez et al (1998) Jedrzejewski R.I., 1987, MNRAS 226, 747
- Kauffmann & Haehnelt (2000) Kauffmann, G. & Haehnelt, M. 2000, MNRAS, 311, 576
- Kron (1980) Kron R.G., 1980, ApJS, 43, 305
- (15) Lilly S.J., Longair M.S., 1984, MNRAS, 211, 833
- (16) Lubin L.M., Oke J.B., Postman M., 2002, AJ, 124,1905
- Moth & Elston (2002) Moth, P. & Elston, R. J. 2002, AJ, 124, 1886
- Persson et al. (1998) Persson, S. E., Murphy, D. C., Krzeminski, W., Roth, M., & Rieke, M. J. 1998, AJ, 116, 2475
- Roche, Eales, Hippelein, & Willott (1999) Roche, N., Eales, S. A., Hippelein, H., & Willott, C. J. 1999, MNRAS, 306, 538
- (20) Saracco P., Iovino A., Garilli B., Maccagni D., Chincarini G., 1997, AJ, 114, 887
- Saracco et al. (1999) Saracco, P., D’Odorico, S., Moorwood, A., Buzzoni, A., Cuby, J.-G., & Lidman, C. 1999, A&A, 349, 751
- (22) Sérsic J.L., 1968, Atlas de Galaxias Australes (Córdoba: Observatorio de Córdoba).
- (23) Stanford, S.A., Eisenhardt, P.R.M., Dickinson, M., 1995, ApJ, 450, 512
- Stanford et al. (1997) Stanford, S. A., Elston, R., Eisenhardt, P. R., Spinrad, H., Stern, D., & Dey, A. 1997, AJ, 114, 2232
- Stanford et al. (2002) Stanford, S. A., Holden, B., Rosati, P., Eisenhardt, P. R., Stern, D., Squires, G., & Spinrad, H. 2002, AJ, 123, 619
- (26) Totani T., Yoshii Y., Maihara T., Iwamuro F., Motohara K., 2001, AJ, 559, 592
- (27) van Breugel W., Stanford S.A., Spinrad H., Stern D., Graham J.R., 1998, ApJ, 502, 614
- van Breugel et al. (1999) van Breugel W.J.M., De Breuck C.D., Stanford S.A., Stern D., Röttgering H.J.A., Miley G.K., 1999, ApJL, 518, 61
- White (1997) White, S. D. M. 1997, Galaxy Scaling Relations: Origins, Evolution and Applications, 3


| Name | mag | Limiting | |||
|---|---|---|---|---|---|
| ° ′ ″ | magnitude | ||||
| 1.5 | |||||
| WN J05261830 | 05 26 24.60 | 18 30 40.1 | 1.390.06 | 20.5 | |
| WN J06121536 | 06 12 38.23 | 15 36 47.2 | 1.470.06 | 20.2 | |
| WN J09102228 | 09 10 34.15 | 22 28 43.3 | 1.570.04 | 19.020.15 | 22.1 |
| WN J09121655 | 09 12 57.24 | 16 55 54.8 | 1.580.06 | 17.680.07 | 20.0 |
| WN J10471836 | 10 47 15.51 | 18 36 31.1 | 1.460.05 | 18.660.09 | 20.0 |
| WN J10521812 | 10 52 00.82 | 18 12 32.3 | 1.520.05 | 17.050.03 | 21.1 |
| WN J11012134 | 11 01 53.63 | 21 34 28.5 | 1.670.07 | 21.1 | |
| WN J11091917 | 11 09 49.93 | 19 17 53.7 | 1.380.04 | 20.0 | |
| WN J11381324 | 11 38 05.42 | 13 24 23.5 | 1.530.08 | 20.5 | |
| WN J11501317 | 11 50 09.59 | 13 17 53.9 | 1.370.04 | 19.180.13 | 20.3 |
| WN J12222129 | 12 22 48.22 | 21 29 10.0 | 1.420.06 | 20.0 | |
| WN J12551913 | 12 55 52.66 | 19 13 00.6 | 1.670.06 | 20.0 | |
| WN J13311947 | 13 31 47.18 | 19 47 26.5 | 1.400.04 | 18.010.07 | 20.0 |
| WN J14501525 | 14 50 42.63 | 15 25 45.2 | 1.420.11 | 21.5 | |
| WN J15162110 | 15 16 42.32 | 21 10 27.4 | 1.380.04 | 20.0 | |
| WN J15181225 | 15 18 43.43 | 12 25 35.6 | 1.670.06 | 20.3 | |
| WN J15571349 | 15 57 41.72 | 13 49 54.8 | 1.390.06 | 18.40.1 | 20.0 |
| WN J16031500 | 16 03 04.78 | 15 00 53.8 | 1.440.05 | 20.5 | |
| WN J16371931 | 16 37 44.85 | 19 31 22.9 | 1.600.04 | 20.5 | |
| WN J20021842 | 20 02 56.00 | 18 42 47.8 | 1.420.06 | 20.0 |
| 2 | 324 | 229 | |
| 2 | 324 | 229 | |
| 4 | 655 | 327 | |
| 11 | 1787 | 538 | |
| 15 | 2437 | 629 | |
| 19 | 3087 | 708 | |
| 52 | 8449 | 1171 | |
| 84 | 13649 | 1484 | |
| 111 | 18036 | 1711 | |
| 82 | 13324 | 1471 |