Abstract
In this work we present combined optical and X-ray cluster detection methods in an area near the North Galactic Pole area, previously covered by the SDSS and 2dF optical surveys. The same area has been covered by shallow ( deg2) XMM-Newton observations. The optical cluster detection procedure is based on merging two independent selection methods - a smoothing+percolation technique, and a Matched Filter Algorithm. The X-ray cluster detection is based on a wavelet-based algorithm, incorporated in the SAS v.5.2 package. The final optical sample counts 9 candidate clusters with richness of more than 20 galaxies, corresponding roughly to APM richness class. Three, of our optically detected clusters are also detected in our X-ray survey.
keywords:
Galaxy clusters.[Comparison between optical and X-ray cluster detection
methods]
Optically and X-ray selected Clusters
of galaxies in the XMM/2df/SDSS survey
1 Introduction
The cosmological significance of galaxy clusters has initiated a number of studies aiming to compile unbiased cluster samples to high redshifts, utilizing multiwavelength data (e.g. optical, X-ray, radio). From the optical point of view there are several available samples in the literature [Abell, Corwin & Olowin 1989, Dalton et al. 1994, Olsen et al. 1999, Goto et al. 2002] which are playing a key role in astronomical research. Optical surveys suffer from projection effects [Frenk et al. 1990] and thus, cluster detection in X-rays is a better approach, owing to the fact that the diffuse Intra-Cluster Medium (ICM) emits strongly in X-rays. The first such survey, was based on the Extended Einstein Medium Sensitivity Survey, containing 99 clusters [Stocke et al. 1991]. Recently, the ROSAT satellite allowed a leap forward in the X-ray cluster astronomy, producing large samples of both nearby and distant clusters [Ebeling et al. 2000, Scharf et al. 1997].
However, even with the improved sensitivity of the XMM-Newton, optical surveys remain significantly more efficient and less expensive in telescope time for compiling cluster samples, albeit with some incompleteness and spurious detections. The aim of this work is to make a comparison of optical and X-ray cluster identification methods in order to quantify the selection biases introduced by these different techniques and to estimate the possible fraction of spurious optically selected clusters due to projection effects.
2 Observations
In this paper we utilize the SDSS Early Data Release (EDR), covering an area of deg2 in the sky [Stoughton et al. 2002]. Goto et al. (2002) applied an objective cluster finding algorithm to the SDSS EDR and produced a list of 4638 galaxy clusters, with estimated photometric redshifts. Furthermore, we analyzed 9 XMM-Newton fields with nominal exposure time between 2 and 10 ksec, covering an area of . However, one of the fields, suffering from significantly elevated and flaring particle background, was excluded from the X-ray analysis.
The optical finding algorithms
The first cluster detection algorithm is based on smoothing the discrete distribution using a Gaussian smoothing kernel. We select all grid-cells with overdensities above a chosen critical threshold () and then we use a friends-of-friends algorithm to form groups of connected cells, which we consider as our candidate clusters. Note that the grid cell size is such that at it corresponds to 100 kpc (). The second optical cluster detection method is the matched filter algorithm (hereafter MFA) described by Postman et al. (1996).
Finally, we construct our final cluster catalogue, in the deg2 area covered by our XMM survey, by adopting the conservative approach of considering as cluster candidates those identified by both independent selection methods (described before). This sample, contains 9 clusters with SDSS richness of more than 20 galaxies, corresponding roughly to APM type clusters. Comparing our final list of 9 clusters with the Goto et al. (2002) clusters, we find 5 in common.
X-ray Cluster Detection
In order to detect candidate clusters in our XMM fields we use the soft 0.3-2 keV band since it maximizes the signal to noise ratio, especially in the case of relatively low temperature galaxy clusters. In particular, we utilize the EWAVELET detection algorithm of the XMM-Newton SAS v.5.2 analysis software package, which detects sources on the wavelet transformed images. We have detected 7 candidate clusters on the MOS mosaic, while 5 extended sources were detected on the PN images, out of which 3 overlap with the MOS candidates. After excluding obvious double point sources and MOS-edge effects we are left with 4 X-ray candidate clusters. The faintest extended source has a flux of .
3 Results
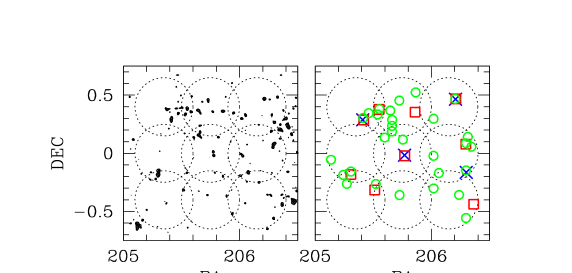
In Fig. 1 (left panel) we plot the smoothed SDSS galaxy distribution, on the equatorial plane with contours delineating the level. While in Fig. 1 (right panel), we plot the positions of (a) our detected cluster candidates, (b) the Goto et al. (2002) clusters and (c) the X-ray detected XMM clusters. All four X-ray detections coincide with optical cluster candidates from different methods, with the largest coincidence rate (3 out of 9) being with our methods. The most distant cluster, [Couch et al. 1991] in our optical sample, located at 13h 43min 4.84sec and 00o 00 56.26, found also in X-rays, is missed by Goto et al. (2002). However, there are still 6 optical clusters that do not appear to have X-ray counterparts. This could be a hint that these clusters are either the results of projection effects, or that our XMM survey is too shallow to reveal the probably weak X-ray emission from these clusters.
In order to address this final issue and to study the relation between the limiting flux of our X–ray survey with respect to exposure time, we have carried out the following experiment. We have analyzed observations taken from 15 XMM public fields with mean exposure times ksec, after filtering to correct for the high particle background in the soft 0.3-2 keV band. Using the parameters of the SAS software as described previously, we have detected 31 candidate clusters. The faintest cluster detected, with a flux of erg cm-2 s-1, was found in the deepest field with an exposure time of 37 ksec. We then reduce the exposure times to a new mean value of ksec, similar to our shallow survey, and find only 9 out of the 31 previously identified candidate clusters (29%), having a limiting flux of erg cm-2 s-1. Therefore, had we had deeper XMM observations (by an average factor of in exposure time) we would have detected X-ray candidate clusters in the region covered by our shallow XMM survey, which is consistent (within ) with the number of our optical cluster candidates.
4 Conclusions
We have made a direct comparison between optical and X-ray based techniques used to identify clusters. We have searched for extended emission in our shallow XMM-Newton Survey, which covers a area (8 out of 9 original XMM pointings) near the North Galactic Pole region and we have detected 4 candidate X-ray clusters. Out of the 4 X-ray candidate clusters 3 are common with our optical cluster list .This relatively, small number of optical cluster candidates observed in X-rays suggest that some of the optical cluster candidates are either projection effects or poor clusters and hence they are fainter in X-rays than the limit of our shallow survey . This latter explanation seems to be supported from an analysis of public XMM fields with larger exposure times.
1
References
- [Abell, Corwin & Olowin 1989] Abell, G.O., Corwin, H.G., Olowin, R.P., 1989, ApJS, 70, 1
- [Couch et al. 1991] Couch, W.J., Ellis, R. S., MacLaren, I., Malin, D. F., 1991, MNRAS, 249, 606
- [Dalton et al. 1994] Dalton, G.B., Efstathiou, G., Maddox, S. J., Sutherland, W. J., 1994, MNRAS, 269, 151
- [Ebeling et al. 2000] Ebeling, H., et al., 2000, ApJ, 534, 133
- [Frenk et al. 1990] Frenk, C. S., White, S. D. M., Efstathiou, G., Davis, M., 1990, ApJ, 351, 10
- [Goto et al. 2002] Goto, T., et al., 2002, AJ, 123, 1807
- [Olsen et al. 1999] Olsen, L. F., et al., 1999, A&A, 345, 681
- [Postman et al. 1996] Postman, M., Lubin, L. M., Gunn, J. E., Oke, J. B., Hoessel, J. G., Schneider, D. P.,Christensen, J. A., 1996, AJ, 111, 615
- [Scharf et al. 1997] Scharf, C. A., Jones, L. R., Ebeling, H., Perlman, E., Malkan, M., Wegner, G., 1997, ApJ, 477, 79
- [Stocke et al. 1991] Stocke, J. T., Morris, S. L., Gioia, I. M., Maccacaro, T., Schild, R., Wolter, A., Fleming, T. A., Henry, J. P., 1991, ApJS,76,813
- [Stoughton et al. 2002] Stoughton, C., et al., 2002, AJ, 123, 485