An X-ray jet discovered by Chandra in the z=4.3 radio-selected quasar GB 1508+5714
Abstract
We report the Chandra discovery of an X-ray jet associated with the redshift 4.3 radio-loud quasar GB 1508+5714. The jet X-ray emission peaks 2 to the South-West of the quasar core. We present archival HST WFPC2 data of the quasar field which shows no optical emission at the location of the X-ray jet. We discuss possible emission mechanisms and give constraints to the magnetic field and energy densities for synchrotron radiation or for Compton scattering of the Cosmic Microwave Background radiation as the jet X-ray emission process.
Subject headings:
Quasars: individual (GB 1508+5714) – galaxies: jets – X-rays: galaxies1. Introduction
X-ray jets associated with many quasars observed by the Chandra X-ray Observatory are among the recent exciting discoveries in high energy astrophysics. The Chandra data strongly suggest that jets propagate with high velocities to very large distances from the quasars (Schwartz et al 2000, Chartas et al 2000, Cellotti et al 2001, Tavecchio et al 2000, Siemiginowska et al 2002, 2003; Brunetti et al 2002, Sambruna et al 2002). One possible emission process for these X-ray jets involves inverse Compton scattering of the Cosmic Microwave Background (CMB) photons on the relativistic particles within the jet (Tavecchio et al 2000, Celotti et al 2001). The energy density of the CMB increases with redshift as , which compensates for the decrease of surface brightness so that resolved objects with the same intrinsic properties (particle density, bulk motion, angle to our line of sight) should be detectable anywhere in the distant universe (Schwartz 2002a). Detecting X-rays from a sample of high redshift jets may allow study of the CMB in the early universe.
The highest redshift () confirmed X-ray jet published to date (Fabian et al 2003) is associated with the radio-loud quasar 3C 9. In this case the jet X-ray emission is likely due to either Compton scattered CMB photons (Fabian et al 2003) or thermal emission from gas heated by jet propagation shocks (Carilli et al 2002). Schwartz (2002b) has reported a possible detection of an X-ray jet at the extreme redshift, with no apparent radio counterpart (Petric et al 2003). Although this detection needs to be confirmed it hints at the possibility that at the highest redshifts, X-rays may be the most efficient wave band to study jets. Radio-loud quasars at high redshift are the best candidates for detecting a jet in X-rays, however, they are quite rare (Snellen et al 2002). There are only 5 redshift z4 radio-loud quasars observed so far with Chandra.
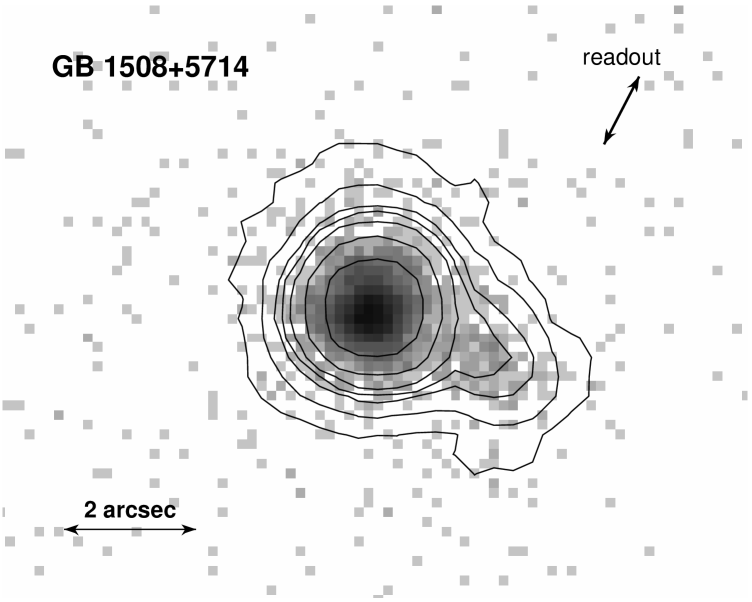
Here we present a statistically highly significant discovery of an X-ray jet (123.5 counts) associated with radio-loud flat spectrum quasar GB 1508+5714. The quasar is X-ray luminous (L(2-10 keV) = 2.8 ergs s-1) and Mathur & Elvis (1995) and Moran & Helfand (1996) argue that this luminosity is partially due to the beaming. However, the source was not resolved in radio VLBI observations and there is no detection of a miliarcsec scale radio jet (Frey et al 1997). Also the published arcsec resolution VLA radio data do not indicate any structure on the arcsec scales (Moran & Helfand 1996). The peak of the X-ray jet emission is located at from the quasar core and it is only of the quasar luminosity. Detection of the similar radio emission requires high dynamic range observations not achieved in the short 5 min exposures. Here we present the X-ray data of the quasar and the jet, and discuss the possible jet emission mechanisms.
Throughout this paper we use the cosmological parameters based on the WMAP measurements (Spergel et al. 2003): H71 km sec-1 Mpc-1, , and . At , 1 arcsec corresponds to 6.871 kpc.
2. Chandra Observations
Q1508+5714 was observed with the Chandra Advanced CCD Imaging Spectrometer (ACIS-S, Weisskopf et al 2002) on 2001 June 13 (ObsID 2241). The source was located on the S3 chip (BI) and offset by from the optical axes. The observation was made in the FAINT mode with the 3.241 sec frame readout time of the full CCD. The source count rate of 0.054 cts/sec is relatively low and the observation is not affected by pileup. At this count rate we expect only 5 counts in the readout streak. Note that this Chandra observation was first presented by Telis et al (2002) in the context of X-ray dust halos.
We have reprocessed the archival data using the Chandra CALDB version 2.22. We ran acis_process_events to remove pixel randomization to obtain the highest image resolution data. The X-ray position of the quasar (J2000: 15 10 02.89, +57 02 43.32) agrees with the radio position (Ma et al. 1998) to better than 0.05, (which is smaller than Chandra’s 90 pointing accuracy of 0.6 arcsec111http://cxc.harvard.edu/cal/ASPECT/celmon/), so we have high confidence in the source identification. We used CIAO 3.0 222http://cxc.harvard.edu/ciao/ software to analyze the data. The standard data filtering leaves the total exposure time at 88.97 ksec.
2.1. Image Analysis
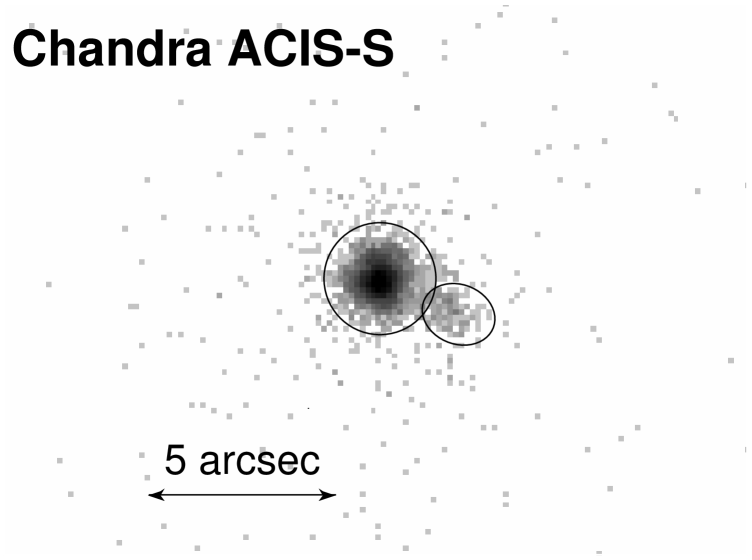
The binned ACIS-S data are displayed in Fig. 1. The source has a clear extension to the South-West (PA ) which is inconsistent with the HRMA (High Resolution Mirror Assembly) point spread function (PSF).
To determine if the extended emission could be due to a nearby point source (e.g. a lensed image or binary quasar), we ran a ray trace using CHART and then MARX333http://cxc.harvard.edu/chart/ to create a high S/N simulation of two point sources separated by 2.0″. (The centroid of the extended emission is 2.0″ from the quasar core.) We modeled both the quasar core and the extended emission as point sources with energy spectra given by the fitting described in Section 2.2. We then extracted a linear profile along the direction of the extended emission, using 0.25″ slices oriented perpendicular to the direction of extent. For the simulation we added 7 errors to account for uncertainty in the raytrace model. The resultant profiles are shown in Fig 2 and clearly illustrate that the observed extended emission (solid line) between 1″ to 3″ is inconsistent with a point source (dashed line). Using statistics, the probability that the profiles are consistent over that distance range is less than .

In Section 2.4 we present an HST image which rules out gravitational lensing or a foreground galaxy. We conclude that the quasar image is extended and that the South-West feature has a linear extent which is most plausibly due to an X-ray jet. The chance probability of finding a source at the jet flux level within 10 of the quasar is very low, approximately 0.5. This is based on the Chandra Deep Field observations (Giacconi et al, 2001), which give 200 sources deg-2 with flux above 5ergs cm-2sec-1.
2.2. Spectral Modeling of the Quasar
The quasar spectrum with a total of 5242 counts was extracted from a 1.5″ circle centered on the pixel (x,y)=(4022.06,4118.96) (physical coordinates, see Fig.3). Based on the CHART simulations (Sec. 2.1) we estimate that 95 of the source counts lie within this source region. The background (annulus between 7.5 and 15) intensity is low with only 8.80.4 counts expected in the source regions. The energy response of ACIS-S below 1 keV is affected by a contamination layer444http://cxc.harvard.edu/ciao/caveats/. To account for the contaminant we have applied a correction using apply_acisabs v.1.1-2555http://cxc.harvard.edu/ciao/threads/sherpa_acisabs/. Still there are uncertainties of order (for energies below 1 keV) due to unknown properties of the contaminant666http://cxc.harvard.edu/cal/.
We used Sherpa (Freeman et al 2001) to fit the quasar spectrum (0.3-10.0 keV) with an absorbed power law model assuming Galactic equivalent hydrogen column of N= 1.46 atoms cm-2 (Stark et al 1992). The best fit parameter values are listed in Table 1. The observed 2-10 keV quasar flux based on this model is equal to 3.45ergs cm-2 sec-1 The rest frame 2-10 keV quasar luminosity is equal to 2.84 ergs cm-2, while the total luminosity observed in 0.2-10 keV (rest frame 1.6-53 keV) is equal to 2.32 ergs cm-2.
The observed photon index is consistent with the first ASCA observation from March 1995 (Moran & Helfand 1997) while the normalization of the power law in the ASCA observation is twice that obtained with ACIS-S. This agrees with the variability of the source as claimed by Moran & Helfand.
2.3. Spectral Modeling of the X-ray Jet
We extracted the jet ACIS-S spectrum from the elliptical region centered on the pixel (x,y)=(4026.075,4117.125) (J2000: 15 10 02.648, +57 02 42.39) as shown in Fig. 3. The total of 149 counts from that region were binned to have a minimum of 10 counts per energy bin. We assume the background spectrum from an annulus between 1.3 and 3.3 excluding an elliptical jet region. There are 123.5 net counts detected in the jet with a maximum energy of 5 keV (26.5 keV in the rest frame).
We fit the spectrum between 0.3-7.0 keV with an absorbed power law model assuming the total NH column of 2.7cm-2 as determined by fitting the quasar spectrum. Table 1 lists the best fit model parameters. The jet photon index is steeper than the quasar one. The model gives an observed 2-10 keV flux of 4.84 ergs cm-2 sec-1 and 3.86ergs cm-2 sec-1 (absorbed) within 0.1-2 keV. Assuming isotropic emission we compute the jet 2-10 keV (rest frame) luminosity of 7 ergs sec-1. This luminosity is similar to the luminosity of the X-ray jets at lower redshifts. The ratio of the quasar and the jet X-ray luminosities is similar to the one found in lower redshift objects (Schwartz et al 2000, Sambruna et al 2002, Siemiginowska et al 2002).
2.4. HST Image.
GB 1508+5718 was observed with HST/WFPC2 (F814W filter) for 4800 s (four exposures) on 22-July-1995. We retrieved the single combined image and variance image created by the WFPC2 Associations Pipeline777http://archive.stsci.edu/hst/wfpc2/about.html. Fig. 4 shows the X-ray contours overlayed on top of the HST/WFPC2 image. Using aperture photometry with the same quasar and jet regions given in the X-ray analysis section (also Fig. 3), we derive the I-band magnitudes and (3- limit).
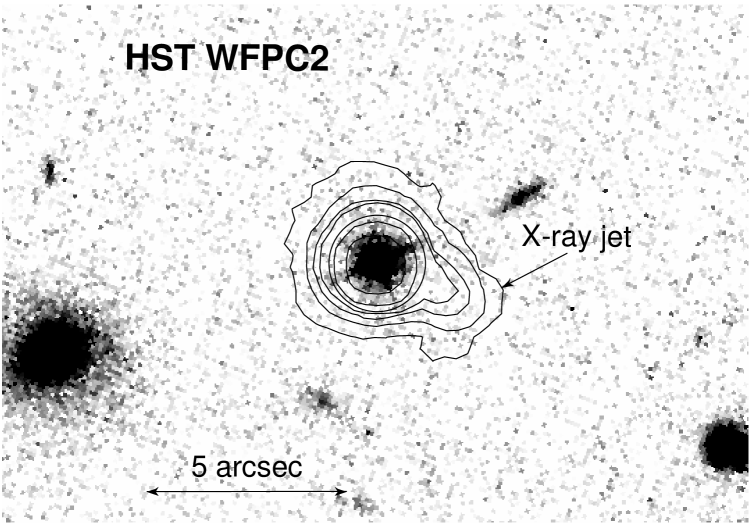
The large difference in brightness between the quasar and the optical limit to the jet emission excludes the possibility that the X-ray emission is due to gravitational lensing. The flux ratio between the quasar and the jet is equal to 40 in the X-rays, while it is more than 293 in the optical.
3. Discussion
X-ray emission from jets is due to either the synchrotron process or Compton scattering of seed photons (synchrotron, SSC or from outside the jet, IC) off the relativistic particles in the jet (see Harris & Krawczynski 2002 for a review). The IC scenario with CMB radiation as a source of the external photons was proposed by Tavecchio et al (2000) and Celotti et al (2001) for jets where the SSC model predicts an X-ray flux which is too low to match the data. This model requires the jet to move with a Lorentz factor, , of 3-10. Jet electrons with relatively low energy ( 100-1000) can then Compton scatter the CMB photons into the X-ray band. Note that the synchrotron emission from these low energy electrons may not be detectable in radio because it will be emitted at very low frequencies.
Which process dominates the X-ray jet emission in GB 1508+5714? The HST optical limit is consistent with both synchrotron or Compton scattering processes. The X-ray jet is detected up to 26 keV ( Hz) in the quasar frame and we cannot constrain the high energy turn-over in the X-ray spectrum. If the break occurs at 26 keV then the synchrotron emitting electrons have energies . The lifetime of such electrons is short ( years for an equipartition magnetic field) implying that they need to be accelerated very recently and in highly efficient process if the X-rays are due to the synchrotron emission.
There is no reported detection of the radio jet (Frey et al 1997) and the VLA observations are consistent with 95 of the 5 GHz flux being emitted by the quasar (Moran & Helfand 1997). Assuming that the X-ray emission is due to synchrotron process we can extrapolate the X-ray spectrum into the radio band. For the observed photon index and 1 keV flux density of 1.68 photons cm-2 sec-1 keV-1 we estimate the 5 GHz flux density to be 9 mJy. This is about of the radio flux from the quasar at this frequency, and is consistent with no radio detection.
The projected size of the jet corresponds to 15 kpc. The high luminosity of the quasar core may be due to beaming (Mathur & Elvis 1995), so the viewing angle of the jet might be small and therefore the jet could be much longer (e.g. kpc for ). Such scales compare well with lower redshift X-ray jets where the IC/CMB process may dominate the jet X-ray emission (Siemiginowska et al 2002, Sambruna et al 2002). The energy density of the CMB at redshift z=4.3 is 3.3 ergs cm-3 (for the CMB radiation temperature at z=0 of 2.728 K, Fixen et al 1996). At the quasar redshift the CMB energy density will dominate magnetic fields of less than 91.
We can calculate the equipartition magnetic field assuming the radio flux upper limit of 9 mJy at 5 GHz, and a uniform volume distribution of fields and particles filling a cylindrical region (1.6 long and 0.4 in radius, volume of 7.7 cm3). This gives B 268 G. However, if the same electron population also produces the observed X-ray flux via IC/CMB, then from Felten & Morrison (1966) we calculate B 25 G. These two values can be reconciled when we consider a relativistic jet with an effective Doppler factor (Tavecchio et al. 2000, Celotti et al. 2001) because Beq while BIC , so we can find a self-consistent solution at B=83 G and =3.2. Because we used an upper limit to the radio flux our number for the magnetic field is also an upper limit, while the value of is a lower limit. These values have an uncertainty due to the uncertain X-ray slope (the assumed radio spectral index) giving the parameters range of (=161G, =2.6) and (B=37G, ).
From the upper limit to the radio luminosity and the magnetic field given above we estimate an upper limit on the photon density of the synchrotron radiation of ergs cm-3 (for the cylindrical region) This is smaller than the energy density of the magnetic field and the CMB radiation. The energy density of the CMB radiation in the jet’s comoving frame is higher by a factor of and even for moderate jet velocities (): (Harris & Krawczynski 2001) which dominates synchrotron radiation field. The SSC emission will be too weak in comparison with the IC/CMB to dominate the X-ray jet spectrum.
It is quite likely that the X-ray emission in the GB 1508+5714 jet is due to the interaction between the CMB photons and the relativistic jet particles. High quality radio data are necessary to constrain the model and exclude the synchrotron possibility.
A sample of high-redshift X-ray jets may provide a way to study the
evolution of the CMB with redshift, which is a fundamental prediction of
standard Big Bang cosmology. Only recently has the non-local CMB
temperature been measured (using quasars absorption lines) and shown to be
higher at redshift 2.33 than at z=0 (Srianand, Petitjean & Ledoux 2000).
Schwartz (2002a) argues that there should be many IC/CMB dominated X-ray
jets at high redshift. A sample of such sources would allow us to
estimate the CMB intensity as a function of redshift.
References
- (1)
- (2) Andreani, P., Franceschini, A., & Granato, G. 1999, MNRAS, 306, 161
- (3)
- (4) Brunetti, G., Bondi, M., Comastri, A., & Setti, G. 2002, A&A, 3 81, 795
- (5)
- (6) Carilli, C. L., Harris, D. E., Pentericci, L., Röttgering, H. J. A., Miley, G. K., Kurk, J. D., & van Breugel, W. 2002, ApJ, 567, 781
- (7)
- (8) Celotti,A., Ghisellini, G. & Chiaberge, M. 2001, MNRAS,321,1
- (9)
- (10) Chartas, G. et al. 2000, ApJ, 542, 655
- (11)
- (12) Fabian, A. C., Celotti, A., & Johnstone, R. M. 2003, MNRAS, 338, L7
- (13)
- (14) Felten, J.E., & Morrison, P. 1966, ApJ146, 686
- (15)
- (16) Filho, M. E., Barthel, P. D., & Ho, L. C. 2000, ApJS, 129, 93
- (17)
- (18) Fixsen, D. J., Cheng, E. S., Gales, J. M., Mather, J. C., Shafer, R. A., & Wright, E. L. 1996, ApJ, 473, 576
- (19)
- (20) Freeman, P., Doe, S., & Siemiginowska, A. 2001, Proc. SPIE, 4477, 76
- (21)
- (22) Frey, S., Gurvits, L. I., Kellermann, K. I., Schilizzi, R. T., & Pauliny-Toth, I. I. K. 1997, A&A, 325, 511
- (23)
- (24) Giacconi, R. et al. 2001, ApJ, 551, 624
- (25)
- (26) Harris, D. E. & Krawczynski, H. 2002, ApJ, 565, 244
- (27)
- (28) Hook, I. M., McMahon, R. G., Patnaik, A. R., Browne, I. W. A., Wilkinson, P. N., Irwin, M. J., & Hazard, C. 1995, MNRAS, 273, L63
- (29)
- (30) Kaspi, S., Brandt, W. N., & Schneider, D. P. 2000, AJ, 119, 2031
- (31) Ma, C. et al. 1998, AJ, 116, 516
- (32)
- (33) Mathur, S. & Elvis, M. 1995, AJ, 110, 1551
- (34)
- (35) Moran, E. C. & Helfand, D. J. 1997, ApJ, 484, L95
- (36)
- (37) Petric, A. O. et al 2003, AJ, 126, 15
- (38)
- (39) Reeves, J. N. & Turner, M. J. L. 2000, MNRAS, 316, 234
- (40)
- (41) Sambruna, R. M., Maraschi, L., Tavecchio, F., Urry, C. M., Cheung, C. C., Chartas, G., Scarpa, R., & Gambill, J. K. 2002, ApJ, 571, 206
- (42)
- (43) Schwartz, D.A. et al 2000 ApJ, 540, 69
- (44)
- (45) Schwartz, D.A. 2002a, ApJ, 569, L23
- (46)
- (47) Schwartz, D. A. 2002b, ApJ, 571, L71
- (48)
- (49) Siemiginowska, A., Bechtold, J., Aldcroft, T. L., Elvis, M., Harris, D. E., & Dobrzycki, A. 2002, ApJ, 570, 543
- (50)
- (51) Siemiginowska, A. et al. 2003, Ap.J. in press (astro-ph/0306129)
- (52)
- (53) Snellen, I. A. G., McMahon, R. G., Dennett-Thorpe, J., Jackson, N., Mack, K.-H., & Xanthopoulos, E. 2001, MNRAS, 325, 1167
- (54)
- (55) Spergel et al, ApJ in press (astro-ph/0302209))
- (56)
- (57) Srianand, R., Petitjean, P., & Ledoux, C. 2000, Nature, 408, 931
- (58)
- (59) Stark, A. A., Gammie, C. F., Wilson, R. W., Bally, J., Linke, R. A., Heiles, C., & Hurwitz, M. 1992, ApJS, 79, 77
- (60)
- (61) Tavecchio, F., Maraschi, L., Sambruna, R.M., Urry, M.C., 2000, ApJ, 544, L23
- (62)
- (63) Telis, Petric, Paerels & Helfand 2002. AAS. 201, 7912
- (64)
- (65) Vignali, C., Brandt, W. N., Fan, X., Gunn, J. E., Kaspi, S., Schneider, D. P., & Strauss, M. A. 2001, AJ, 122, 2143
- (66)
- (67) Weisskopf, M. C., Brinkman, B., Canizares, C., Garmire, G., Murray, S., & Van Speybroeck, L. P. 2002, PASP, 114, 1
- (68)
| Model | a | NH()b | Normc | (d.o.f.)d | |
|---|---|---|---|---|---|
| GB 1508+5714 | 0 | 0.13 | 1.55 | 6.76 | 540.4 (660) |
| GB 1508+5714 | 4.3 | 5.5 | 1.56 | 6.73 | 538.4 (660) |
| Jet | 0 | 0.27e | 1.90 | 0.169 | 27.8 (42) |
Model: photons cm-2 sec-1 keV-1; N = 1.4atoms cm-2; and - absorption cross sections (Morrison & McCammon 1983, Wilms, Allen & McCray 2000). All errors are 90; a redshift of the absorber; b equivalent Hydrogen absorbing column in excess to the Galactic column in units of 1021 atoms cm-2; c Normalization of the power law at 1keV in units of 10-5photons cm-2 s-1; d calculated with Primini method using Sherpa, degrees of freedom are given in the bracket.e the assumed column is equal to a sum of Galactic column and the excess column N from the fit to the quasar spectrum.