GACE, Instituto de Ciencia de los Materiales, Universitat de Valencia, P.O. Box 22085, 46071 Valencia, Spain
First observations of the X-ray transient EXO 2030+375 with IBIS/ISGRI††thanks: Based on observations with INTEGRAL, an ESA project with instruments and science data centre funded by ESA member states (especially the PI countries: Denmark, France, Germany, Italy, Switzerland, Spain), Czech Republic and Poland, and with the participation of Russia and the USA.
We present a first INTEGRAL observation of the 42s transient X-ray pulsar EXO 2030+375 with IBIS/ISGRI. The source was detected during Cyg X-1 observations in December 2002. We analyzed observations during the outburst period from 9 to 21 December 2002 with a total exposure time of kiloseconds. EXO 2030+375 was almost always detected during single minute exposures in the 1845 energy bands. The source light curve shows the characteristic outburst shape observed in this source.
Key Words.:
gamma rays: observations – X-rays: individual: EXO 2030+375 – Telescopes: INTEGRAL: IBIS1 Introduction
EXO 2030+375 is a member of the Be/X-ray transients systems, which are the most common type of accreting X-ray pulsar. They consist of an accreting neutron star and a B spectral main-sequence donor star that shows Balmer emission lines (Apparao (1994) for review). The line emission is believed to be associated with an equatorial outflow of material expelled from the rapidly rotating Be star that forms a quasi-Keplerian disk near the Be star (Quirrenbach et al. (1997)). The X-ray emission of the transient pulsar EXO 2030+375 is modulated by s pulsations and periodic days Type I outbursts, that are produced at each periastron passage of the neutron star, i.e. when the pulsar interacts with the disk of the Be star.
EXO 2030+375 was discovered in 1985 May with EXOSAT satellite
during a large outburst phase (Parmar et al. 1989b ). This outburst was
first detected at a 120 keV energy band and its luminosity is close
to the Eddington limit (assuming 5 kpc distance to the source) for a
neutron star (Parmar et al. (1985)). During the later EXOSAT
observations a monotonic decline in intensity was seen over nearly 3
orders of magnitude. During this luminosity decline, the intrinsic
spin period changed dramatically, with a characteristic spin-up
timescale years (Parmar et al. 1989b ), the energy
spectrum (Reynolds et al. (1993)), and the keV pulse profile
(Parmar et al. 1989a ) all showed significant luminosity dependence. Such
a spin-up indicates the presence of an accretion disk penetrating well
inside the corotation radius. Further evidence of an accretion disk
resulted from the detection of 0.2 Hz quasi-periodic oscillations
(Angelini et al. (1989)).
The shape of the continuum X-ray spectrum in the range 225
keV of EXO 2030+375 can be represented by a powerlaw () modified at energies above a high energy cutoff
keV
with keV (Reynolds et al. (1993)).
Evidence of a possible cyclotron feature at 36 keV was found in
spectra with RXTE observations (Reig, P., & Coe, M.J. (1999)).
We report first observation results of EXO 2030+375 made
with INTEGRAL/ISGRI during the Performance and Verification (PV)
phase. The source was observed for more than 10 days in different
offaxis position.
2 Instruments and Observations
The International Gamma-Ray Astrophysics Laboratory (INTEGRAL) (Winkler et al. this volume ) is a 15 keV10 MeV gamma-ray observatory with concurrent source monitoring at X-rays (335 keV) and in the optical range (V, 500600 nm). The INTEGRAL main gamma-ray instruments are the spectrometer SPI and the imager IBIS, the supplementary instruments are the X-ray monitor JEM-X and the Optical Monitoring Camera OMC. This provide a combination of imaging and spectropy over a wide range of X-ray and gamma-ray energies including optical monitoring.
The imager IBIS with a angular resolution of 12′ FWHM, a wide full coded field of view (FOV) of and a partially coded FOV of (Ubertini et al. this volume ) consists of two detection layers, ISGRI and PICsIT. The front layer ISGRI (Lebrun et al. this volume ) is sensitive for lower energy (15 keV1 MeV), and while its peak sensitivity is between 15 keV and 200 keV, the second one PICsIT (Di Cocco et al. this volume ) is sensitive between 200 keV and 8 MeV. The division into two layers allowed the paths of the photons to be tracked in 3D, as they scatter and interact with more than one element. This offers the possibility to operate IBIS in the additional “Compton mode”. The present results of the analyzed data are produced by the ISGRI detector layer.
The Cygnus region, including in the field of view Cyg X-1 (Laurent et al. this volume), Cyg X-3 (Goldoni, P. et al. this volume ) and EXO 2030+375 was observed 15 November21 December 2002. The main target, observed in different position, was Cyg X-1 (Bazzano et al. this volume ). During this period EXO 2030+375 was in the IBIS/ISGRI field of view and detected in the outbursts, i.e., in the periastron passage phase starting from December 9th, 2002. In this Letter we report on results of analysis of EXO 2030+375 observations carried out by IBIS/ISGRI in 921 December 2002.
3 Data Reduction
During the PV phase of observations, the instrument parameters and moreover the pointing direction frequently changed and EXO 2030+375 was not fully coded during all analysed observations. We used observational data starting from December 9th, 2002 when source appeared in the X-ray image of Cygnus region and was reliably detected by IBIS/ISGRI. We rejected observations carried out in slew mode and those in which PICsIT was operated in “Photon-by-Photon” mode.
For light curve data we analyzed observations starting with the outburst phase of EXO 2030+375 from 9 December and lasting to 21 December 2002. These observations correspond to INTEGRAL orbit revolutions 1922. Table 1 summarizes the observations time and mean source flux for each revolution.
The images produced by the telescope were analysed using the ISDC public software and software developed at our institute for calibration (INTEGRAL Off-line Scientific Analysis (OSA) v1.1 with latest versions of ii_skyimage 3.5 and ii_spectra_extract 1.9). The images were deconvolved using the procedures described in Goldwurm et al. (this volume) to recover source position and flux.
4 Imaging and Light Curve
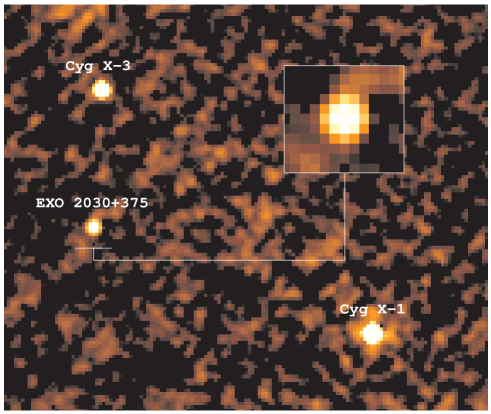
Cyg X-1 is one of the brightest hard X-ray sources in the sky. It was the main target of the IBIS/ISGRI pointing observations in December 2002 of the Cygnus region. EXO 2030+375 and Cyg X-3 are two other X-ray sources in the vicinity of Cyg X-1 (see Fig. 1). All three sources were in the IBIS/ISGRI field of view during monitoring of this part of X-ray sky. The effective coded area of source on the detector plane decreased consequently from in revolution 19 to in revolution 22.

Before the image reconstruction and the extraction of light curve from the data we studied the source intensity in different energy bands. Spectral shape of EXO 2030+375 is well approximated by a power-law spectrum with a high energy cutoff (Reynolds et al. (1993)). Therefore we preferred to select softer energy channels than harder ones in order to avoid possible contamination of the source flux by background radiation. For revolutions 1922 the level of background radiation is not well established or at least not as well as for later observations when parameters of “veto” were fixed. We found that both observational parameters of EXO 2030+375 – count rate and significance of the detection level of source flux have maximum in 1845 keV energy range. We used this energy band over our analysis.
The image of the Cygnus region in 1845 keV energy range averaged over all “Science Window” observations carried out in the course of the revolution 19 is shown in figure 1. We detected Cyg X-1 with unprecedented significance of level. Its X-ray flux dominated over Cyg X-3 and EXO 2030+375 fluxes which were detected with significance levels times lower (see Fig. 1) than Cyg X-1.
In order to get EXO 2030+375 light curve in 1845 keV we extracted source count rate from deconvolved image of every “Science Window” observation. The image analysis pipeline allows to get and estimate intensity of interesting sources directly in output of files. Unfortunately EXO 2030+375 flux extracted in a such way was found at too low intensity level in some part of observational data. In order to check the flux determination procedure we extracted source count rate directly from source reconstructed spectra and compared results of both methods. It was found that extraction of count rate from source spectrum is a more reliable and stable method than the extraction from images. The problem was due to the fact that the detector’s count rate is dominated by very strong hard X-ray source like Cyg X-1.
Light curve of EXO 2030+375 is shown in figure 2. In order to compare IBIS/ISGRI results with results obtained with other observatories we plotted RXTE/ASM data in the bottom of figure 2. The correlation between averaged 1845 keV IBIS/ISGRI flux and 112 keV flux of RXTE/ASM is apparent. The maximum intensity of outburst of cnt/s ocurred during MJD . This outburst was also detected by JEM-X (Martinez et al. this volume ).
The time range of the first and the last observed photon event correspond to the orbital phase of EXO 2030+375 from 0.9849 to 0.2332. The periastron passage was at the orbital phase zero at 2452618.683 JD 2.8 days before the outburst maximum, according to the epemeries given by Wilson et al. (2002).
5 Spectral Analysis
Only fully coded observations of EXO 2030+375 were used to analyze spectral shape. Due to some uncertainties in calculations of counts in spectral bins in partially coded observations, such data were not used for averaged spectrum (nevertheless we used them for light curve shown in figure 2). Due to absence of fully coded observations of EXO 2030+375 in revolutions 2022 spectral analysis was not performed using these revolutions.
Spectral extraction was performed for each particular “Science Window”. Source spectra of 31 “Science Window” of fully coded observations of EXO 2030+375 with total integration time of ksec were averaged in 13 channels rebinned from 2048 channels of the original matrix. We fitted the intensities of the background and the 3 IBIS/ISGRI sources (Cyg X-1, Cyg X-3 and EXO 2030+375) in the field of view for each spectral bin. The averaged spectrum of EXO 2030+375 is shown in figure 3.
We used the 22100 kev energy range for spectral fit. Power-law model with exponential cutoff was used to approximate the spectral data. It can be seen from the figure 3 that the 2nd spectral bin corresponding to the keV energy band deviates from the expected spectral shape. This bin was excluded from spectral analysis as the observed feature is due to a known problem in the present correction tables used to convert event amplitude channels in deposited energies. In order to demonstrate it we present the ratio of the EXO 2030+357 spectrum to the Crab one in the bottom of figure 3. As it can be seen from figure 3, the spectral shape of EXO 2030+375 is relatively smooth in comparison to the Crab spectrum and there are no sharp change in the data points.
Averaged EXO 2030+375 spectrum was well fitted with the model mentioned above. The following results were obtained: power-law spectral index , , , . These spectral parameters are close to those obtained by Reynolds et al. (1993).

6 Conclusions
We present a first INTEGRAL observation of the transient X-ray pulsar EXO 2030+375 with IBIS/ISGRI. We demonstrate that the results on EXO 2030+375 are consistent with those obtained from other X-ray missions. Source light curve shows typical changes in intensity which correspond to the source state in outburst phase. The spectrum of EXO 2030+375 in 20100 keV energy band is a power-law with a spectral index and has a high energy cutoff above keV.
This letter illustrates the IBIS/ISGRI detector capability to produce scientific results event for partially coded off-axis sources. This capability is one of the most important IBIS/ISGRI characteristics and its exploitation will be very important during the mission.
References
- Angelini et al. (1989) Angelini, L., Stella, L., & Parmar, A. N. 1989, ApJ, 346, 906
- Apparao (1994) Apparao, K. M. V. 1994, Space Sci. Rev., 69, 225
- (3) Bazzano, A., Bird, A., Capitanio, F. et al. this volume
- (4) Di Cocco, G., Caroli, E., Celesti E. et al. this volume
- (5) Goldoni, P., Bonnet-Bidaud J.M., Falanga, M. et al. this volume
- Goldwurm et al. (this volume) Goldwurm, A., Pedro, D., Foschini, L. et al. this volume
- (7) Lebrun, F., Leray, J., Lavocate, P. et al. this volume
- (8) Martinez, S., Reig, P., Blay, P., et al. this volume
- Parmar et al. (1985) Parmar, A. N., Stella, L., Ferri, P., & White, N. E. 1985, IAU Circ. 4066
- (10) Parmar, A. N., White, N. E., & Stella, L. 1989a, ApJ, 338, 373
- (11) Parmar, A. N., White, N. E., Stella, L., Izzo, C., & Ferri, P. 1989b, ApJ, 338, 359
- Reig, P., & Coe, M.J. (1999) Reig, P., & Coe, M.J. 1999, MNRAS, 302, 700
- Quirrenbach et al. (1997) Quirrenbach, A., Bjorkman, K., Bjorkman, J., et al. 1997, ApJ, 479, 477
- Reynolds et al. (1993) Reynolds, A.P., Parmar, A.N., & White, N.E. 1993, ApJ, 414, 302
- (15) Ubertini P., Lebrun, F., Di Cocco, G. et al. this volume
- Wilson et al. (2002) Wilson, C.A., Finger, M.H., Coe, M.J. et al., 2002, ApJ, 570, 287
- (17) Winkler, C., Courvoisier, T., Di Cocco, G. et al. this volume