Two Active Nuclei in 3C 294111Based in part on observations made with the NASA/ESA Hubble Space Telescope, obtained at the Space Telescope Science Institute, which is operated by the Association of Universities for Research in Astronomy, Inc., under NASA contract NAS 5-26555. These observations are associated with proposal no. 08315. Based in part on data collected at Subaru Telescope, which is operated by the National Astronomical Observatory of Japan. Some of the data presented herein were obtained at the W.M. Keck Observatory, which is operated as a scientific partnership among the California Institute of Technology, the University of California and the National Aeronautics and Space Administration. The Observatory was made possible by the generous financial support of the W.M. Keck Foundation. Some of the data were also obtained from the Chandra Data Archive, part of the Chandra X-Ray Observatory Science Center, which is operated for NASA by the Smithsonian Astrophysical Observatory
Abstract
The radio galaxy 3C 294 lies ″ from a 12th mag star and has been the target of at least three previous investigations using adaptive-optics imaging. A major problem in interpreting these results is the uncertainty in the precise alignment of the radio structure with the or -band AO imaging. Here we report observations of the position of the AO guide star with the Hubble Space Telescope Fine Guidance Sensor, which, together with positions from the U. S. Naval Observatory’s UCAC2 catalog, allow us to register the infrared and radio frames to an accuracy of better than 01. The result is that the nuclear compact radio source is not coincident with the brightest discrete object in the AO image, an essentially unresolved source on the eastern side of the light distribution, as Quirrenbach et al. (2001) had suggested. Instead, the radio source is centered about 09 to the west of this object, on one of the two apparently real peaks in a region of diffuse emission. Nevertheless, the conclusion of Quirrenbach et al. (2001) that 3C 294 involves an ongoing merger appears to be correct: analysis of a recent deep Chandra image of 3C 294 obtained from the archive shows that the nucleus comprises two X-ray sources, which are coincident with the radio nucleus and the eastern stellar object. The X-ray/optical flux ratio of the latter makes it extremely unlikely that it is a foreground Galactic star.
1 Introduction
There are substantial reasons to believe that radio galaxies at high redshifts comprise at least a significant part of the parent population of massive central cluster galaxies at the current epoch. Given that the growth of bulges and the growth of supermassive black holes are likely to be intimately related (Kormendy & Richstone, 1995; Magorrian et al., 1998; Gebhardt et al., 2000; Ferrarese & Merritt, 2000), the most powerful active nuclei will almost certainly be found in massive galaxies. At high redshifts, such galaxies are expected to have formed almost exclusively in regions of high overdensity, in which the processes of galaxy formation will have proceeded most rapidly, and which will also be likely seedbeds for protoclusters.
Recent observational evidence supports this picture (see Best 2000 for a review of earlier results). In particular, although high-redshift radio sources are found in a variety of environments, evidence for clustering around many of them has been found in both optical/IR (e.g., Best et al., 2003) and X-ray (Pentericci et al., 2002) surveys. In some cases, there are indications that the radio source is the central galaxy in the cluster, either from an overdensity of galaxies at small scales around it (e.g., Best et al., 2003), or from the surface-brightness profile of the galaxy itself (Best, Longair, & Röttgering, 1998). This means that the study of the morphologies and other properties of high-redshift radio galaxies that appear to be the dominant members of clusters or protoclusters can give us insights into the formation of the most massive galaxies in the present-day universe.
One such case is the radio galaxy 3C 294, which Toft et al. (2003) have found to be surrounded by an overdensity of faint red galaxies. This object has been a favorite target for adaptive optics (AO) systems on large telescopes both because it is one of the most powerful radio galaxies in the observable universe and because its optical center lies ″ from a 12th mag star. The first AO imaging of this object, using the University of Hawaii curvature-sensing AO system Hokupa‘a on the Canada-France-Hawaii Telescope (CFHT), was reported by Stockton, Canalizo, & Ridgway (1999), who found a clumpy structure in the band and suggested that the various clumps might be dusty subunits in the process of merging and illuminated by a hidden nucleus to the south of most of the observed structure. They also emphasized the uncertainty in the position in the nucleus.
Quirrenbach et al. (2001) used the AO system on the Keck II telescope to observe 3C 294 in the and bands. They found an essentially stellar profile ( mas FWHM) for the eastern component, separated by from the diffuse western component. Taking the USNO-A2.0 position for the AO guide star, they concluded that the active nucleus is coincident with the stellar eastern component. They interpret the structure as an ongoing merger of two galaxies, with the active nucleus associated with the fainter galaxy.
Steinbring, Crampton, & Hutchings (2002) found a position for the radio source similar to that of Stockton, Canalizo, & Ridgway (1999), but they did not state how they calculated it. Their AO imaging at and , obtained with PUEO on the CFHT, showed 3 main components: their component corresponds to the stellar eastern component of Quirrenbach et al. (2001); their and are two subclumps in the diffuse western component. The position they gave for the radio source did not correspond to any of the features visible at or .
Although these observations give the highest optical/IR resolutions yet achieved on any powerful high-redshift radio galaxy, the interpretation of the imaging remains ambiguous because the precise location of the radio nucleus remains uncertain. By far the largest part of this uncertainty is that of the position of the AO guide star. This “star” is actually a close double, with a separation of about 015 and an intensity ratio of 1.5:1 at (Stockton, Canalizo, & Ridgway 1999; Quirrenbach et al. 2001; but note that the image of the binary shown in an inset to Fig. 1 of Stockton et al. was inadvertently flipped, so North is at the bottom, East to the left). The 2 uncertainty in the center-of-light position of the double (or, equivalently, of either component) is about in right ascension and about in declination (Stockton, Canalizo, & Ridgway, 1999). In this paper, we describe both new AO imaging of 3C 294 and new Hubble Space Telescope (HST) Fine-Guidance Sensor (FGS) observations that, together with positions from the new UCAC2 catalog (Zacharias et al., 2000, 2003), allow us to obtain a precise position for both components of the AO guide star and thus align the radio and optical/infrared frames near 3C 294 to much greater precision than before.
2 AO Imaging
We obtained new imaging of 3C 294 in the band with the Keck II AO system and the SCAM (slit-viewing camera) of NIRSPEC (McLean et al., 1998) on 2001 May 18 (UT). With a pixel scale of 17 mas, the HgCdTe array had a total field of 43 square. The seeing was generally good, but with variable periods, so we selected for coadding only those images for which the eastern stellar component of 3C 294 had a clear diffraction-limited core. The total exposure for the coadded image was 9000 s.
We also obtained new imaging with IRCS and the AO system on the Subaru telescope on 2003 February 17 (UT), with a total exposure of 2400 s. The main purpose of this imaging was to give an independent check to the offset of various components of 3C 294 from the AO guide star. Accordingly, the guide star was kept within the detector field, and the exposures were adjusted to avoid serious saturation of the two components of the star (while the peak pixels of both components did saturate slightly in most exposures, accurate centroids could still be found to a fraction of a pixel). We also obtained imaging of the close pair of Hipparcos stars HIP63605 and HIP63607 immediately before the 3C 294 observations in order to determine an accurate scale and orientation for the detector. These stars have a separation of 11431. The scale was found to be per pixel, and the detector had a rotation angle of with respect to north.
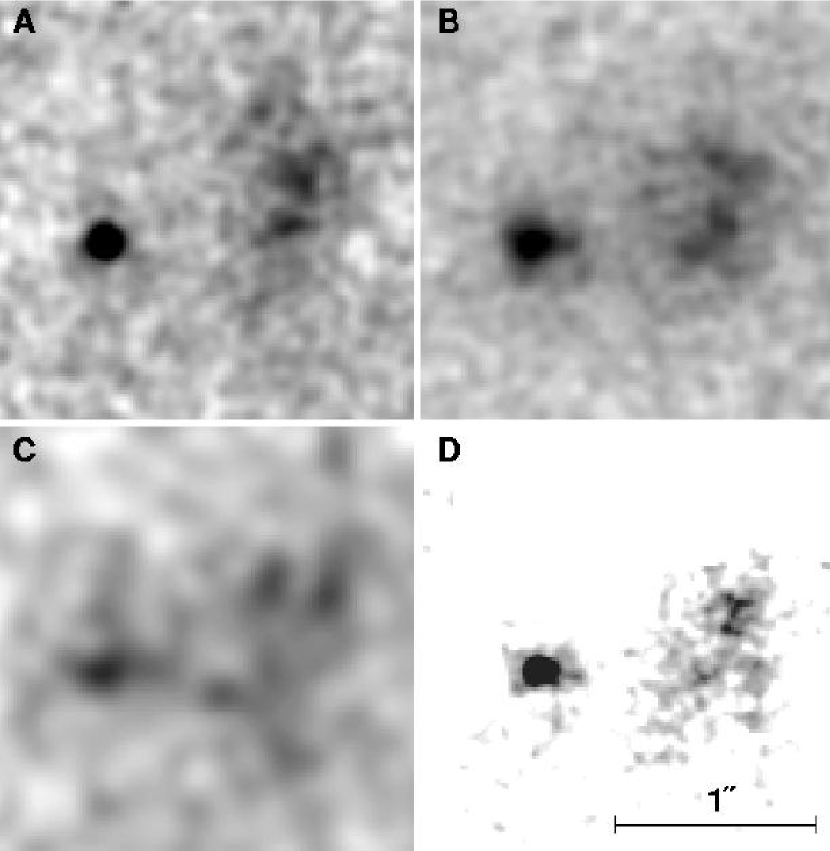
For both of these sets of observations, we used our standard iterative IR-imaging reduction procedure (see, e.g., Stockton, Canalizo, & Close 1998). Figure 1 shows our new Keck and Subaru AO images, together with images from Stockton, Canalizo, & Ridgway (1999) and Quirrenbach et al. (2001).
3 HST Fine-Guidance Sensor Observations
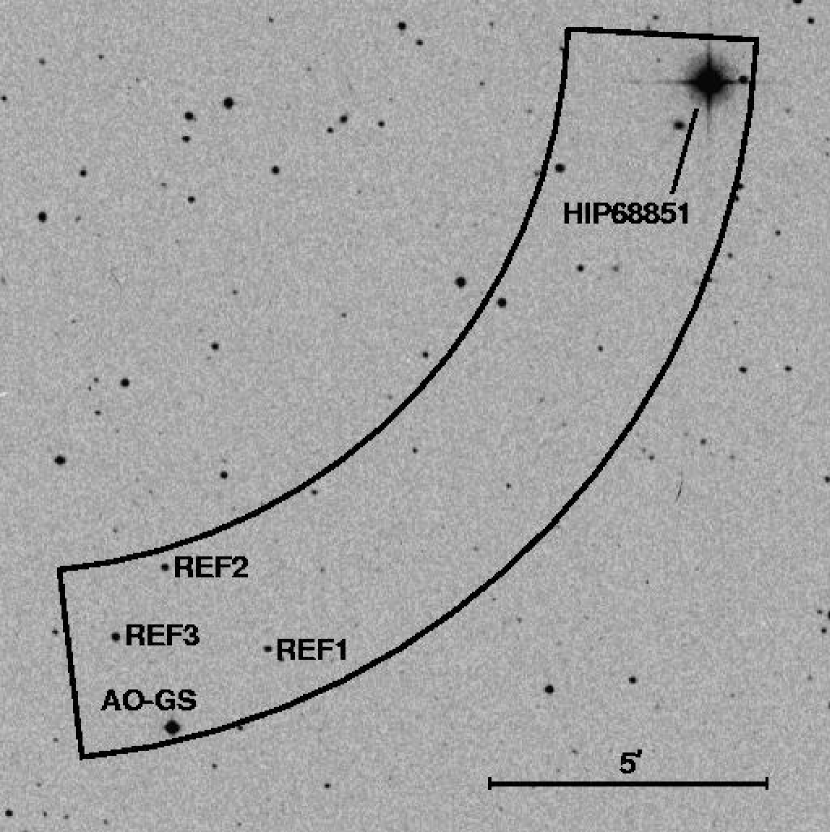
The HST Fine-Guidance Sensor (FGS) observations were undertaken to tie the position of the AO guide star (AO-GS) to the International Coordinate Reference System (ICRS), via the Hipparcos star HIP68851, which could be placed within the same FGS “pickle.” Figure 2 shows the distribution of stars across the FGS1r field of view. The FGS observations were carried out during a single orbit on 2000 December 11 UT. The FGS was used in position mode to determine the centers of HIP68851, AO-GS, and the three reference stars REF1, REF2, and REF3, as well as in transfer mode to measure the separation, position angle, and relative brightnesses of the two components of AO-GS. These measurements establish the radial separations and position angles of the stars relative to HIP68851 in the FGS frame to an accuracy of mas and 0.00006 degrees respectively. Translating these quantities from the FGS frame into celestial coordinates depends critically on our knowledge of the HST roll angle, which could differ from the commanded roll angle by up to . Over the lever arm to the Hipparcos star, this uncertainty could result in coordinate errors as large 06 in the direction perpendicular to the line from the star in question to HIP68851. We obtain a better estimate of the actual roll angle by comparing the positions found by the FGS observations for the AO-GS, REF2, and REF3 with positions for the same stars from the U.S. Naval Observatory UCAC2 catalog (Zacharias et al., 2000, 2003). REF1 turned out to be too faint for the UCAC2 catalog; it therefore could not be used for the roll determination.
The binary components of AO-GS were well resolved by the FGS in transfer-scan mode. The binary has a separation of , a position angle , and component brightness difference .
We have assumed that the UCAC2 coordinates for the AO-GS binary are for the system’s center of light. To allow a direct comparison with the FGS observations, the location of the binary’s center of light in the FGS frame was determined using the binary separation, position angle, and component brightness, as measured in the FGS transfer scan observation, to determine the offset from the primary, whose position was measured by the position mode observations. The UCAC filter half-transmission points were at 5790 and 6420 Å, while those for the FGS were at about 4350 and 7100 Å, so the central wavelengths differed by Å. We estimate the uncertainty introduced by this difference in bandpass to be no more than 001–002. It is worth emphasizing, however, that this uncertainty does not affect our final astrometry of AO-GS at this level: it enters in quadrature along with the uncertainties in the positions of our two reference stars in the determination of the HST roll angle correction.
Table 1 compares the FGS and UCAC2 determination of the radial separation and position angle between REF2, REF3, and AO-GS and the Hipparcos star. Typical UCAC positions are accurate to 30 to 70 mas, depending upon the object’s brightness and the number of times it was observed. Therefore, we can use the UCAC2 coordinates to determine the various position angles, and when averaged, to determine the correction to the commanded HST roll angle. Finally, with the HST roll angle known, the corrected position angle of each star with respect to the Hipparcos star could be determined from the FGS observations. These position angles, together with the measured radial separations, allowed the right ascension and declination of each star to be determined in the ICRS, which is anchored to the Hipparcos star.
The Hipparcos star has a significant proper motion () = (+15.1, ) mas yr-1. This proper motion has been accounted for in determining its position at the epoch of our observations.
From the PA differences in the last column of Table 1, we determine the error in the HST commanded roll angle to be .
| FGS | UCAC2 | Difference | ||||
|---|---|---|---|---|---|---|
| Stars | Separation | PA | Separation | PA | ||
| HIP–AO-GSaaAO-GS refers to the binary’s center of light. | 9083226 | 1398086 | 9083219 | 1397835 | 00007 | 00251 |
| HIP–REF2 | 7883598 | 1313455 | 7882793 | 1313185 | 00805 | 00270 |
| HIP–REF3 | 8787950 | 1327303 | 7888165 | 1327043 | 00260 | |
4 Registration of the AO Images of 3C 294 with respect to the AO Guide Star
In order to register the AO images to the radio coordinates, we need two kinds of coordinate data: (1) accurate coordinates of AO-GS in the ICRS reference frame, and (2) the offset between AO-GS and some well-defined feature in the AO images. In addition, we need a precise mapping of the McCarthy et al. (1990) radio coordinates from the B1950 VLA calibrator frame, in which they were given, to the ICRS frame.
4.1 The Coordinates of the AO Guide Star
Using the proper-motion-adjusted coordinates of the Hipparcos star to tie the FGS frame to the ICRS, the position of the prime component of the AO binary was determined from its FGS measured separation and position angle (using the HST corrected roll angle) relative to the Hipparcos star. Because of the large () separation between HIP68851 and AO-GS, this calculation was rigorously performed using great circles on the celestial sphere rather than by approximate planar projection onto the orthogonal (, ) coordinate system of the local FGS tangential plane.
This calculation gives for the coordinates of the AO primary in the ICRS. Interestingly, the largest contribution to the errors is the uncertainty in the proper motion of HIP68851. The separation and position angle between the AO primary and the Hipparcos star is 9083202 and 1397806, respectively.
4.2 The Offset of the 3C 294 Field from the AO Guide Star
We have two measures of the offset of the apparent stellar eastern component of 3C 294 in the AO images from the center of light of the binary AO guide star: (1) from our previous CFHT imaging (Stockton, Canalizo, & Ridgway, 1999), and (2) from the recent Subaru imaging. These give, respectively, (, ) = (9810, 1596) and (9784, 1514). The estimated random errors in both cases are about 001 in and about 0015 in , although there is a possibility of a small systematic error in the position angle in both measurements, which could account for the difference of in the declination offset. We take a simple mean of these two determinations and assume that and . These values are consistent with the rough offset of 97 east and 16 north given by Quirrenbach et al. (2001) for their AO imaging and in reasonable agreement with the offset of east and north they found from their lower-resolution NIRC imaging. In order to use this offset with the FGS coordinates for AO-GS, we convert it from the offset from the center of light of the binary to the offset from the primary (easternmost) component of the binary. The magnitude difference of the components at is 0.44 mag, and we use the accurate separation of 0147 and position angle of 233° determined from the FGS transfer-mode observations. The offset of the stellar object from the AO-GS primary is then east and north.
Adding this offset to the position of the AO-GS primary found above gives the position of the stellar object near 3C 294 as .
5 The Position of the Radio Nucleus in the AO Imaging Field
The position of the unresolved flat-spectrum radio core of 3C 294 has been given by McCarthy et al. (1990), from their observations at 6 cm with the Very Large Array (VLA) in the A-array configuration. Their position for the core is in the reference frame defined by the VLA B1950 astrometric calibrators. Conversion of these coordinates to the ICRS (J2000) reference frame was kindly carried out for us by Jim Ulvestad. The result is . These values are very close to those given by Stockton, Canalizo, & Ridgway (1999), who used a different procedure, but they should be more accurate; uncertainties introduced by the conversion should be mas (J. Ulvestad, private communication).
With our precise mapping of the AO imaging onto the ICRS reference frame, we can now locate the position of the radio core on the AO -band image. It lies west and north of the stellar object, as shown in Fig. 3. The radio core, which presumably marks the nucleus, lies very close to one of the brightness peaks of what Quirrenbach et al. (2001) have called “the western component” of 3C 294. On the other hand, this position of the radio core is clearly inconsistent with its being identified with the stellar object, as was suggested by Quirrenbach et al. (2001).
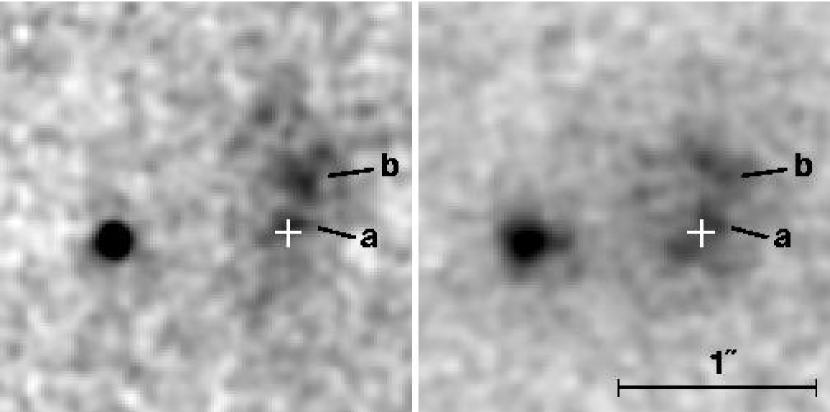
One of the most striking features of Fig. 1 is the difference in appearance of the various AO images. All show a stellar component and a diffuse component about 1″ to the west of it, but there is little detail that convincingly reproduces from image to image. To be sure, panel is a rather noisy image, and panel (Quirrenbach et al., 2001) is an -band image (the other 3 are all ), so we should probably concentrate on comparing the Keck II NIRSPEC image and the Subaru IRCS image . These are reproduced in Fig. 3, where we have marked two features that seem to be present in both images. Most of the other apparent features in one or the other of the images are likely due to speckle noise.
The strongest of the “real” features (aside from the stellar object to the east), labeled in Fig. 3, lies within the error bars of the position of the radio core and is plausibly to be identified with the nuclear region of 3C 294. The position of object falls near a local minimum in the -band image of Quirrenbach et al. (2001) (see Fig. 1; this weakness may indicate that the nucleus is strongly obscured at shorter wavelengths. Such obscuration would be consistent with the conclusion of Fabian et al. (2003) that the central hard X-ray source in 3C 294 is a highly obscured quasar with a luminosity of erg s.
6 The Eastern Stellar Object
If the radio nucleus lies within the diffuse nebulosity, what is the nature of stellar object to the east? The density of star-like objects of similar or greater brightness at in the field of 3C 294 is on the order of 10 per square arcmin, so it would be quite unusual for there to be an unrelated object within 1″ of the nucleus of 3C 294. On the other hand, there is no compelling evidence for significant nebulosity associated with the stellar object, so it could be a projected Galactic subluminous star—we are acutely aware of misinterpretations arising from stars projected on, e.g., the radio galaxy 3C 368 (Hammer, Proust, & Le Fèvre, 1991; Stockton, Ridgway, & Kellogg, 1996) and the quasar PKS 2135147 (Canalizo & Stockton, 1997).
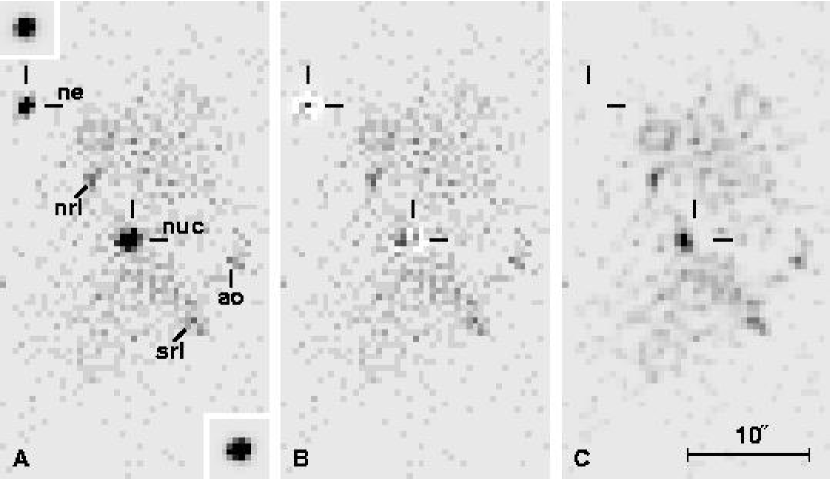
In the case of 3C 294, we have some additional evidence on the nature of the stellar object. We have obtained from the Chandra Data Archive the 192 ks integration used by Fabian et al. (2003) on 3C 294 to map the surrounding extended X-ray emission. The region immediately around 3C 294 is shown in Fig. 4. A few discrete sources besides the nuclear component are visible, including a faint source at the position of the AO guide star and a bright point source northeast of the nucleus, which Fabian et al. (2003) interpret as a Seyfert II nucleus with a redshift close to that of 3C 294. The distance between the X-ray peaks corresponding to the AO guide star and the nuclear component agrees, perhaps somewhat fortuitously (given the image scale and count statistics) with that determined from the AO imaging to within 01.
The nuclear component itself appears elongated in the east-west direction. Part of this elongation is due to aberrations because of the off-axis position of the source, as can be seen in the model PSFs shown in the insets to Fig. 4, but the subtraction shown in Fig. 4 shows that part of the elongation is actually due to a second source centered pixels () to the east, i.e., essentially coincident with the stellar object.
We have also attempted deconvolution of the X-ray image, using a PSF kernel generated for the position and spectral-energy-distribution of the nucleus over the 0.5 to 6 keV band, using the CIAO222http://cxc.harvard.edu/ciao/ procedure ChaRT to trace the rays and MARX333http://space.mit.edu/CXC/MARX/ to generate a pseudo event file. The PSF was generated on a grid subsampled by a factor of 4 with respect to the Chandra ACIS pixel scale. We used the procedure cplucy (Hook, 1999), which carries out a two-channel deconvolution. One channel includes the point sources (in our case, we include only the nuclear and the northeastern sources), which are modeled and removed. The other channel contains the “background,” which includes all sources not designated as point sources. This background channel is deconvolved subject to an entropy constraint. The subsampled deconvolved image was resampled back to the ACIS scale. This result is shown in Fig. 4; it also shows a source at the position of the eastern stellar object.
Thus, we have two point x-ray sources within about 1″ of each other, strengthening the likelihood that the objects are closely related. In addition, we can use the X-ray—optical flux ratio to constrain the nature of the eastern component. The flux ratio is defined by , where is the X-ray flux in erg cm-2 s-1 within the 0.3–3.5 keV range. The eastern stellar object has (Quirrenbach et al. 2001 give but mention some uncertainty due to nonphotometric conditions), and its X-ray flux in the 0.3–3.5 keV band is erg cm-2 s-1. Among normal stars, the highest ratios of are found for M stars, for which they range from about 0.001 to about 0.3 (e.g., Maccacaro et al. 1988). If the object were an M star, it would have a color of , so an . With the X-ray flux given above, this results in , well above the likely range for normal stars. While earlier-type stars have less-red colors, so their would be smaller, their expected values of drop even faster, so the discrepancy would be even larger.
On the other hand, if the object were an AGN at the redshift of 3C 294, it would typically have a color of , so and , a ratio that is within the expected range for AGN. The most likely explanation for the duplicity in the Chandra image is therefore that there are two active nuclei associated with 3C 294: one associated with the compact radio nucleus and heavily obscured at rest-frame optical wavelengths and in soft X-rays (Fabian et al., 2003), the other associated with the stellar object 09 ( kpc) east of the radio source and intrinsically less powerful, but having relatively little extinction. If we assume no extinction for the eastern nucleus and assume the estimate of Fabian et al. (2003) for the intrinsic X-ray flux of the radio nucleus, the eastern nucleus has an intrinsic X-ray luminosity roughly an order of magnitude lower than that of the radio nucleus. There is no indication of radio emission from this second active nucleus in the 6 cm VLA map of McCarthy et al. (1990), but this fact alone cannot set very stringent limits on its radio/X-ray flux ratio.
7 Summary and Discussion
The position of the radio nucleus of 3C 294 determined here places it north of the position given by Stockton, Canalizo, & Ridgway (1999) and west of the position given by Quirrenbach et al. (2001). Within the errors of the determination, the nucleus is coincident with a modest peak within the diffuse component seen in the -band imaging data. While this position of the radio nucleus undercuts the specific argument made by Quirrenbach et al. (2001) that 3C 294 is a merger in progress, since the radio source can no longer be identified with the eastern stellar component, their conclusion is nevertheless reaffirmed by the fact that both the radio nucleus and the eastern stellar object appear to be X-ray sources.
The apparent presence of two active nuclei in such close proximity places 3C 294 within a a small, but important, class. A recent cottage industry has developed in mining surveys for gravitationally lensed QSOs to extract double QSOs that are not the result of gravitational lensing, but, instead, are true binaries (e.g., Mortlock, Webster, & Francis, 1999). Such cases are important for at least two reasons: (1) If they are found as subsets of large survey whose selection properties are well determined, such as the Large Bright Quasar Survey (LBQS) or the Sloan Digital Sky Survey (SDSS), their statistics can provide evidence for the importance of interactions and mergers in triggering nuclear activity (Djorgovski, 1991; Kochanek, Falco, & Muñoz, 1999); and (2) with a sufficiently large sample, they can provide evidence on mean lifetimes of QSO activity (Mortlock, Webster, & Francis, 1999). 3C 294, with active nuclei at a projected distance kpc, has one of the smallest projected separations yet found. Other examples with good credentials as true close binaries include LBQS 01032753 (, kpc; Junkkarinen et al., 2001), FIRST J164311.3+315618 (, kpc; Brotherton et al., 1999), SDSS J233646.2010732.6 (, kpc; Gregg et al., 2002), and LBQS 0015+0239 (, kpc; Impey et al., 2002). Smail et al. (2003) have noted that cases of submillimeter-bright galaxies that are detected as pairs of X-ray sources at separations of a few tens of kpc are much more common than would be expected by chance, and they have suggested that these represent early stages of mergers of two galaxies, each of which hosts a supermassive black hole. They also point out that Ravindranath, Ho, & Filippenko (2002) have shown that the flattened stellar distribution seen in the cores of many cluster ellipticals can be produced by the dynamical action of a close supermassive-black-hole binary. Very close pairs of active nuclei, such as 3C 294, likely give us snapshots of stages in this process between that seen in the X-ray double submillimeter sources and the final formation of a tight binary black hole, by which time one or both nuclei may have ceased to show activity. Together with the overdensity of red galaxies around it found by Toft et al. (2003), this result gives us considerable confidence that in 3C 294 we are indeed witnessing a stage in the formation of a dominant cluster galaxy.
References
- Best (2000) Best, P. N. 2000, MNRAS, 317, 720
- Best et al. (2003) Best, P. N., Lehnert, M. D., Miley, G. K., & Röttgering, H. J. A. 2003, MNRAS, 343, 1
- Best, Longair, & Röttgering (1998) Best, P. N., Longair, M. S., & Röttgering, H. J. A. 1998, MNRAS, 295, 549
- Brotherton et al. (1999) Brotherton, M. S., Gregg, M. D., Becker, R. H., Laurent-Muehleisen, S. A., White, R. L., & Stanford, S. A. 1999, ApJ, 514, 61
- Canalizo & Stockton (1997) Canalizo, G., & Stockton, A. 1997, ApJ, 480, L5
- Djorgovski (1991) Djorgovski, S. 1991, in ASP Conf. Ser. 21, The Space Distribution of Quasars, ed. D. Crampton (San Francisco, ASP), p. 349
- Fabian et al. (2003) Fabian, A. C., Sanders, J. S., Crawford, C. S., & Ettori, S. 2003, MNRAS, 341, 729
- Ferrarese & Merritt (2000) Ferrarese, L., & Merritt, D. 2000, ApJ, 539, L9
- Gebhardt et al. (2000) Gebhardt, K., et al. 2000, ApJ, 539, L13
- Gregg et al. (2002) Gregg, M. D., Becker, R. H., White, R. L., Richards, G. T., Chaffee, F. H., & Fan, X. 2002, ApJ, 573, L85
- Hammer, Proust, & Le Fèvre (1991) Hammer, F., Proust, D., & Le Fèvre 1991, ApJ, 374, 91
- Hook (1999) Hook, R. N. 1999, ST-ECF Newsletter, 26, 3
- Impey et al. (2002) Impey, C. D., Petry, C. E., Foltz, C. B., Hewett, P. C., & Chaffee, F. H. 2002, ApJ, 574, 623
- Junkkarinen et al. (2001) Junkkarinen, V., Shields, G. A., Beaver, E. A., Burbidge, E. M., Cohen, R. D., Hamann, F., & Lyons, R. W. 2001, ApJ, 549, L155
- Kochanek, Falco, & Muñoz (1999) Kochanek, C. S., Falco, E. E., & Muñoz, J. A. 1999, ApJ, 510, 590
- Kormendy & Richstone (1995) Kormendy, J., & Richstone, D. 1995, ARA&A, 33, 581
- Maccacaro et al. (1988) Maccacaro, T., Gioia, I. M., Wolter, A., Zamorani, G., & Stocke, J. T. 1988, ApJ, 326, 680
- McCarthy et al. (1990) McCarthy, P. J., Spinrad, H., van Breugel, W., Liebert, J., Dickinson, M., Djorgovski, S., & Eisenhardt, P. 1990, ApJ, 365, 487.
- McLean et al. (1998) McLean, I. S., et al. 1998, Proc. SPIE, 3354, 566
- Magorrian et al. (1998) Magorrian, J., et al. 1998, AJ, 115, 2285
- Mortlock, Webster, & Francis (1999) Mortlock, D. J., Webster, R. L., & Francis, P. J. 1999, MNRAS, 309, 836
- Pentericci et al. (2002) Pentericci, L., et al. 2002, A&A, 396, 109
- Quirrenbach et al. (2001) Quirrenbach, A., Roberts, J. E., Fidkowski, K., de Vries, W., & van Breugel, W. 2001, ApJ, 556, 108
- Ravindranath, Ho, & Filippenko (2002) Ravindranath, S., Ho, L. C., & Filippenko, A. V. 2002, ApJ, 566, 801
- Smail et al. (2003) Smail, I., Scharf, C. A., Ivison, R. J., Stevens, J. A., Bower, R. G., & Dunlop, J. S. 2003, ApJ, in press [astro-ph/0307560]
- Steinbring, Crampton, & Hutchings (2002) Steinbring, E., Crampton, D., & Hutchings, J. B. 2002, ApJ, 569, 611
- Stockton, Canalizo, & Close (1998) Stockton, A., Canalizo, G., & Close, L. 1998, ApJ, 500, L121
- Stockton, Canalizo, & Ridgway (1999) Stockton, A., Canalizo, G., & Ridgway, S. E. 1999, ApJ, 519, L131
- Stockton, Ridgway, & Kellogg (1996) Stockton, A., Ridgway, S. E., & Kellogg, M. 1996, AJ, 112, 902
- Toft et al. (2003) Toft, S., Pedersen, K., Ebeling, H., & Hjorth, J. 2003, MNRAS, in press
- Zacharias et al. (2000) Zacharias, N. et al. 2000, AJ, 120, 2131
- Zacharias et al. (2003) Zacharias, N., Urban, S. et al. 2003, AJ, in preparation.