The Aligned Radio Galaxy 3C 280111Based on observations made with the NASA/ESA Hubble Space Telescope, obtained at the Space Telescope Science Institute, which is operated by the Association of Universities for Research in Astronomy, Inc., under NASA contract NAS 5-26555.
Abstract
The radio galaxy 3C 280 has a particularly striking rest-frame UV morphology, with multiple line and continuum components precisely aligned with the radio structure, including an obvious semi-circular arc. Here we explore the nature of these various components by bringing together HST and ground-based imaging, ground-based spectroscopy, and radio mapping. From plausible decompositions of the spectra, we show that the continuum of the nuclear component is likely dominated by a combination of nebular thermal continuum, quasar light, and light from old stars. A component that falls directly on the probable path of the radio jet shows mostly nebular thermal continuum and includes contributions from a relatively young stellar population with age around 100 Myr. The arc appears to be completely dominated by line emission and nebular thermal continuum, with no evidence for a significant stellar contribution. Though much of the aligned light is in UV components, the underlying old elliptical is also well-aligned with the radio axis. The elliptical is well-fit by a de Vaucouleurs profile, probably has a moderately old stellar population ( 3 Gyr), and is a massive system with a velocity dispersion of 270 km s-1 that implies it contains a supermassive black hole. Although the arc and the extended emission surrounding the eastern lobe suggest that interactions between the radio lobe and jet must have been important in creating the UV morphology, the ionization and kinematic properties in these components are more consistent with photoionization than shock excitation. 3C 280 may be a transition object between the compact steep-spectrum radio galaxies which seem to be shock-dominated, and the extended radio sources which may have evolved past this phase and rarely show shock signatures.
1 Introduction
Our understanding of the physical processes underlying the detailed morphologies of high-redshift radio galaxies, including the well-known radio-optical alignment effect (Chambers, Miley, & van Breugel, 1987; McCarthy et al., 1987), remains unclear. In the near-infrared, most powerful radio galaxies appear to be relaxed, giant elliptical galaxies (e.g., Rigler et al. 1992; Best, Longair, & Röttgering 1996), and high-resolution band imaging with the HST NICMOS camera confirms this result (Zirm et al., 1999, 2003). In the optical (rest-frame UV), a variety of types of alignment have been found in WFPC2 imaging of radio galaxies (Dickson et al., 1995; Longair, Best, & Röttgering, 1995; Best, Longair, & Röttgering, 1996, 1998; Ridgway & Stockton, 1997). Aligned rest-frame UV continuum structures that at ground-based resolution appear smooth or to consist of multiple large-scale components have been resolved by WFPC2 imaging in many cases into a sequence of discrete, almost unresolved peaks, closely confined to the radio axis (e.g., 3C 324 and 3C 368; Dickson et al. 1995; Longair, Best, & Röttgering 1995). In 3C 368, the continuum is fairly blue and unpolarized (van Breugel, 1996), and many of the components are dominated by thermal emission from the emission-line producing gas (Dickson et al., 1995; Stockton, Ridgway, & Kellogg, 1996). In 3C 324, however, the chain of lumps exhibits a mild curvature, presumably associated with the precession of the radio jet. Detection of polarization in this and many other high- radio galaxies supports the hypothesis that the bulk of the UV radiation comes from scattered light (e.g., Cimatti et al. 1996; Vernet et al. 2001). High resolution HST polarization studies of 3C 324 have shown that each well-aligned subclump is in fact highly polarized (12%), consistent with dust-scattered quasar light contributing 10–40% in the rest-frame UV, and even more in the rest-frame optical (Zirm, 2003). However, the mechanisms that might confine the scatterers to the jet path are not well understood. In these cases, the morphologies argue for the interaction of the jet with the ambient medium as the primary cause of the structures observed. A correlation seen between the size of the radio structure and the tightness of the alignment can be seen as evidence in favor of jet-induced star formation (Best, Longair, & Röttgering, 1996), and direct evidence for young stellar features has been found in one high- radio galaxy (Dey et al., 1997). More than one of these mechanisms may be important in any particular aligned radio galaxy, and it is probably necessary to understand many high- radio galaxies in terms of a combination of these processes.
We have obtained some particularly intriguing examples of radio-optical alignment as a result of a WFPC2 program to image a complete sample of 3C radio sources (Ridgway & Stockton, 1997, henceforth RS97). One of these, the radio galaxy 3C 280, has an aligned morphology that is unique among HST images of high- radio galaxies and seems quite difficult to explain with any combination of the commonly considered mechanisms for optically aligned continuum emission. Its arc-like rest-frame UV morphology has been noted and discussed in Best, Longair, & Röttgering (1996, 1998) and in RS97. Here we present the results of a program to use multicolor imaging, optical and infrared spectroscopy, and MERLIN and VLA radio maps to make a detailed study of this unusual powerful radio galaxy. We will use km s-1 Mpc-1, , and throughout.
2 Observations and Reduction
2.1 Imaging data
We give in Table 1 a summary of the imaging data we will use in this paper. From RS97 we use the deep WFPC2 F622W observations of 3C 280, as well as the deep ground-based and [O II] images from Keck and CFHT respectively. The observations and reduction of these data are discussed in RS97. From the HST archive we have also obtained F814W WFPC2 observations and F160W NICMOS observations. To reduce the WFPC2 data, we took the best recalibrated pipeline images and, as these observations consisted of a few individual undithered exposures, we used the STSDAS package crrej directly to remove the cosmic rays and combine the data. The F814W image was taken with the WFC detector with a pixel scale of 01 pixel-1.
The F160W NICMOS data from the HST archive consisted of a standard dithered sequence of 8 exposures. We calibrated the raw data using the recommended bias, dark and flat fields, and also removed the bias “pedestal” using software provided by M. Dickinson. To align the separate exposures, we used offsets from the instrument jitter files, masked out cosmic rays, and combined the images after resampling by a factor of two resulting in a pixel scale of 00375 pixel-1. The FWHM of a star in the final frame is 014, yielding an image resolution very similar to that in the WFPC2 images.
2.2 Optical spectroscopy
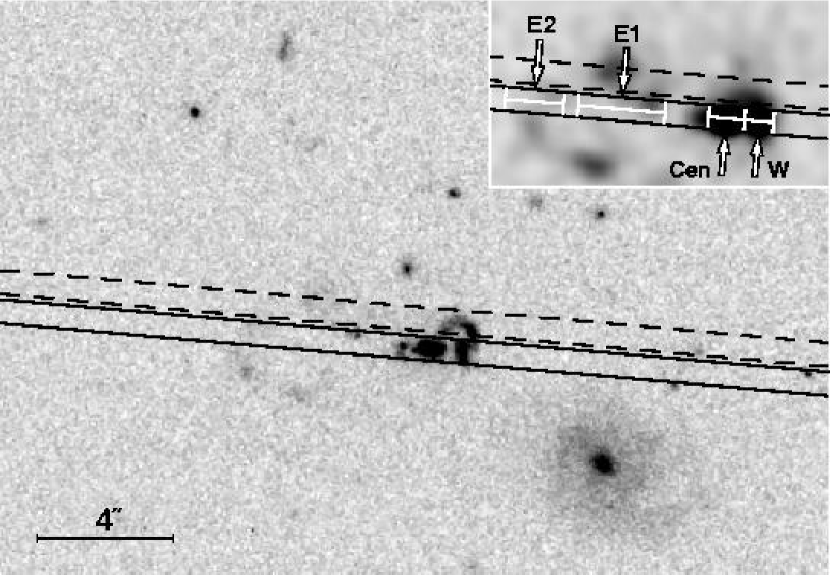
We obtained optical spectroscopy of 3C 280 on the nights of 1996 February 14 and 15 with the Low Resolution Imaging Spectrometer (Oke et al., 1995) on the Keck I telescope. The detector was a Tek CCD with 0215 pixel-1. We used a position angle of 85° for all observations, corresponding to the axis of the primary galaxy components , and (labelled in Fig. 4). On 14 Feb the atmospheric seeing conditions were consistently very good, and we used the 07 width slit throughout. For these observations, we used a 600 groove mm-1 grating blazed at 7500 Å, covering the wavelength range 5945–8506 Å. We took two 1200 s spectra with the slit centered on the radio galaxy nucleus, and two 1200 s exposures with the slit offset 09 north, parallel to the first slit position, in order to emphasize the contribution from the arc . These slit positions and widths are shown in Fig. 1.
On 15 Feb, we obtained three 1200s exposures centered at the nucleus through the 07 width slit and with the same red grating (600 groove mm-1, 7500 Å blaze) as the first night, but slightly offset in wavelength coverage (6645–9235 Å). In addition, we obtained three 1200 s exposures centered at the nucleus using a blue grating (600 grooves mm-1, blaze at 6000 Å), covering a wavelength region of 4325–6890 Å, and beginning with the same 07 slit width. The last two of these exposures were taken with a slightly wider slit width of 10 because of degenerating seeing conditions. We also obtained with this setup a spectrum of a nearby field star to aid in deconvolution. When obtaining multiple exposures at a single position we dithered slightly along the slit in order to aid in removal of chip defects and cosmic rays.
The spectra were reduced using standard IRAF tasks. After initial processing of the CCD frames, the spectra were wavelength calibrated using observations of arc lamps and night sky lines, then were corrected for spectral and spatial distortions, linearizing the wavelength scale. Background sky was removed by fitting cubic splines to the night sky lines and subtracting. The spectra were flux calibrated and corrected for atmospheric absorption using the spectrophotometric standards G191B2B and HZ 44. All the spectra for the slits centered on the nucleus were combined to make a single two-dimensional spectrum covering the wavelength region 4325–9235 Å; this required scaling the spectra to match the continuum values in regions of spectral overlap before averaging. Average continuum values in the spectra taken with the narrower slits were scaled up by 40–50% to match those in the wider slit spectra, for example, but there were no continuum slope discontinuities in the overlap regions and no changes in slope were made. We also use a direct average when we combine spectra taken with the two different slit widths, giving the combined spectrum in those spectral regions an average of the two spectral resolutions.
A slight residual spatial-spectral curvature was removed from the full-length 2-D spectrum by extracting 1-pixel-wide apertures parallel to the trace of the combined continuum. The spectral pixel scale is 1.26 Å pixel-1, and the spectral resolution (as measured from arc lines) is 3.5 Å for the 07 slit spectra and 4.0 Å for the 10 slit width. Wavelength errors are 1 Å, and statistical errors in the fluxes are 10%. The spatial resolution was measured from the continua of the calibration stars observed near in time to the galaxy spectra, and averaged 086.
2.3 Near-Infrared Spectroscopy
Near-infrared spectroscopy of 3C 280 was performed with CGS4 on UKIRT. -band observations centered on 1.325m were taken on 1998 January 22 UT with a 1.2″ (two pixel) wide slit at PA 85°. The 150 line/mm grating was used in 3rd order, giving a resolving power of 2350. The total integration time was 120 min, split into pairs of 5 minute exposures dithered along the slit in the standard ABBAABBAA… sequence (Eales & Rawlings 1993). Further CGS4 observations, centered at 0.98m to include the [O III] line, were taken on 1999 May 15 UT. The 150 line/mm grating was used in 4th order, giving a resolving power of 3100. Total integration time was 100 minutes, with the data being taken in the same way as the 1998 data.
2.4 MERLIN and VLA Radio Maps
Though we have obtained multifrequency continuum polarization maps at both MERLIN and the VLA of this object, here we will discuss only the MERLIN L band (1.4 GHz) map (to provide the best match in resolution to the HST images) and a VLA X band (8.4 GHz) map that we obtained from the VLA archive. The rest of the radio mapping and depolarization studies will be presented in a future paper. The MERLIN observations consisted of one 12 hour run from 12 April 1997 and were self-calibrated and mapped in the standard way using AIPS and difmap. The map was reconvolved with a slightly elliptical beamsize of 022 019 FWHM. In this map there was no core detection.
The VLA X band observation was taken from the VLA archive, program AO105. This 8.4 GHz observation was taken at A array, and consisted of a 6 minute snapshot. The data were phase and flux calibrated with AIPS, then self-calibrated using difmap. After several iterations of self-calibration, we were able to detect the core, which exhibits some extension in the lobe direction that may correspond to a portion of the jet. The map has been restored with a circular 04 beam. The core center is at RA = , Dec = +47°20′1992 (J2000) and we use this location to align the MERLIN radio map to the optical and infrared images.
3 Analysis and Results
3.1 Radio mapping
In Fig. 2, we show the contours of the X band (8.4 GHz) VLA map over the WFPC2 F622W image, and in Fig. 3 we show the L band (1.4 GHz) MERLIN map over the same F622W image at a different intensity scaling. The core is clearly detected in the X band map, and this position allows us to align the radio and optical frames quite precisely. The X band core is resolved, and it is elongated to the west at a PA of about 85° in the direction of the western hotspots and lobe. The elongation of the core to the west may be emission from the base of the radio jet, and the compact knot and hotspot seen on the western side suggest that the radio jet emission on this side is Doppler boosted. The western side is also less depolarized than the eastern one (Liu & Pooley, 1991). All of these indications are consistent with the western lobe being closer to the observer than the eastern.
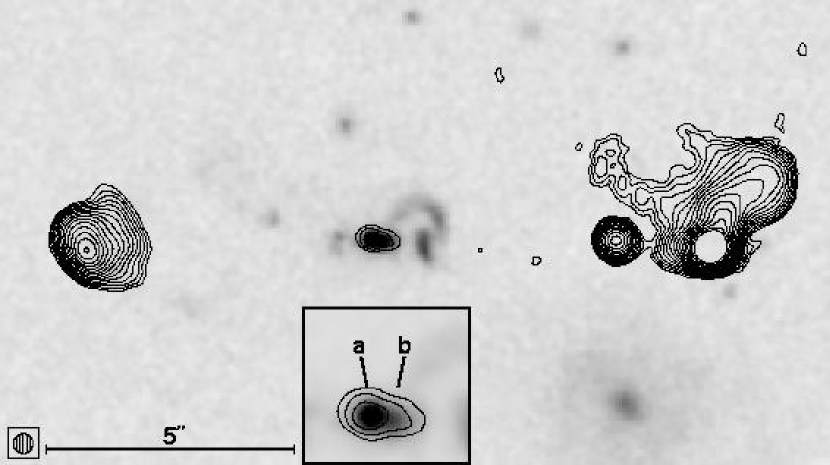
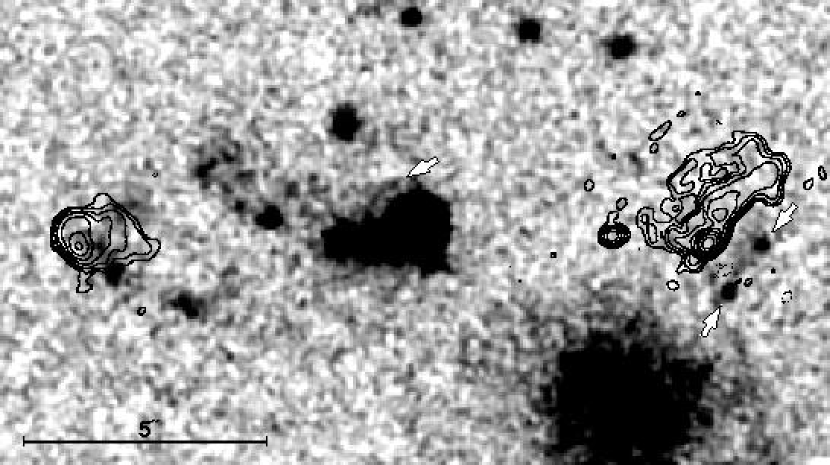
The rest-frame UV morphology of the central galaxy is very well aligned with this probable jet direction, and there is a circular region of UV and [O II] emission to the east of the galaxy that may fall at the boundaries of the eastern lobe (seen in projection on the sky). The radio lobe fills the region between the galaxy and the eastern hotspot but much of the extended emission is resolved out in Fig. 3 due to the high MERLIN resolution. We will be discussing details of these central components in the rest of this paper. Also interesting and indicative of some kind of interaction of the lobe with the ambient medium is the optical emission directly to the west of the western radio lobe: this lobe is flattened parallel to this linear structure.
3.2 Imaging
The WFPC2 F622W image and the CFHT [O II] image have been previously presented and discussed in RS97, along with a -band image obtained with NIRC on Keck I. By adding the high resolution NICMOS F160W image and the F814W image obtained from the HST archive, we can determine the morphology of the galaxy and colors of some components over a large range in wavelength. WFPC2 images of 3C280 are also shown and discussed in Best, Longair, & Röttgering (1996, 1998) and the NICMOS image is shown and discussed in Zirm et al. (2003).
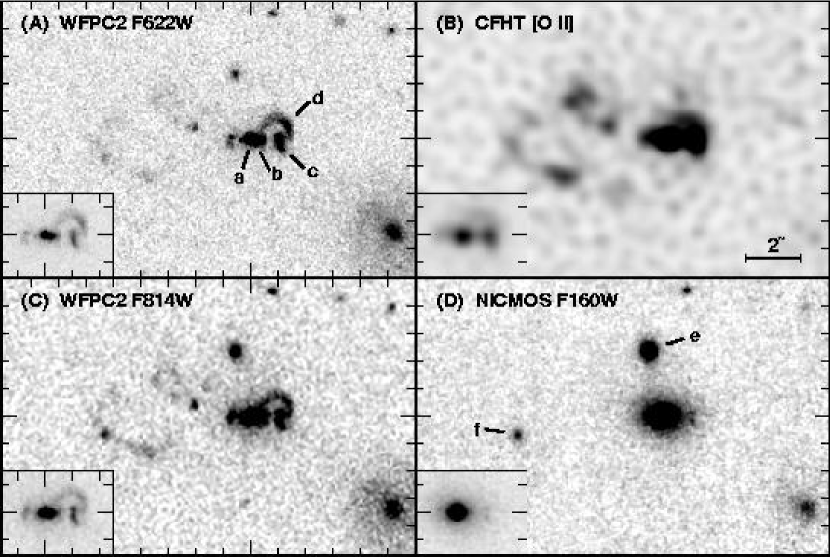
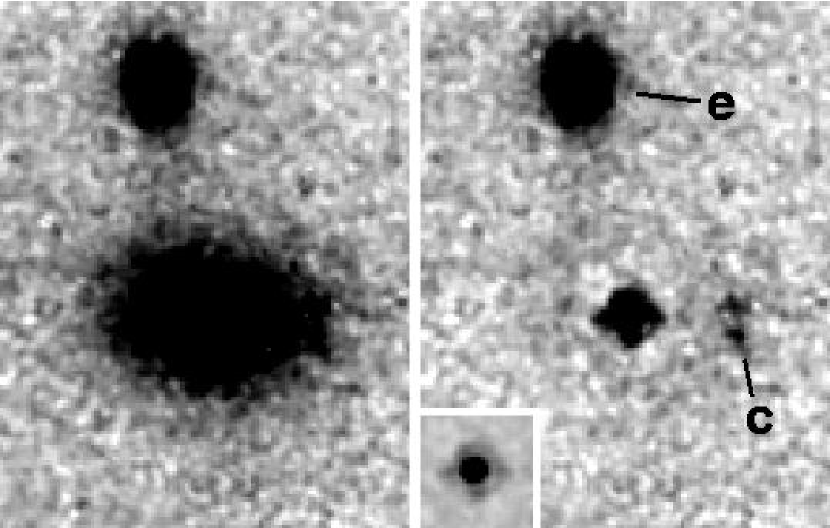
As shown in Fig. 4, , and , an unresolved “nuclear” optical component coincides with the near-infrared elliptical center; discrete components and are aligned with , on a line very close to the radio jet axis. In fact, the location of component corresponds so closely to the morphology of core jet extension in the X band map, that it is possible that we are seeing optical synchrotron in . In RS97, three of the 5 quasars we studied with high resolution HST images had clear evidence for optical synchrotron from jet knots or lobes. For 3C280, we estimate the spectral indices from 8.4 GHz to 6600 Å for the two components and by fitting overlapping profiles to obtain fluxes in the X band map and in the F622W optical image (with the underlying emission from the host galaxy subtracted). The radio-to-optical spectral indices of and are 0.76 and 0.79 respectively, with errors of 0.2 for , the less well-determined component. (Here .) These spectral index values are reasonable for optical synchrotron emission and certainly within the wide range possible. The radio-to-optical spectral indices for components of optical synchrotron jets observed with HST as compiled by Crane et al. (1993) range from 0.58 to 0.90, so would have a typical spectral index were it due to optical synchrotron emission. In addition, the spectral index of component is not flatter than that of the core ; if it were, it would be difficult to explain it as a component of the jet.
Component is elongated nearly perpendicularly to the radio axis, and it is apparently connected by a semi-circular arc to . The component is double at longer wavelengths: in Fig. 4 it can be seen that there is a gap in that corresponds closely to the jet axis (as determined from the X band map). The WFPC2 F622W filter excludes all major emission lines at the redshift of 3C 280, and these structures are therefore dominated by continuum emission. (We have estimated the contamination from weak emission lines from the spectroscopy presented in §3.3.2. In all cases, this contamination is %.) The arc has strong [O II] emission as well, however, as can be seen in our continuum-subtracted CFHT [O II] image, shown in Fig. 4. This image had an initial resolution of 07, and its resolution was improved by deconvolution with the Lucy restoration algorithm. The background artifacts induced by the deconvolution process makes it difficult to use the image for quantitative measurements at the higher resolution, but the image is reliable enough to indicate that and both have fairly strong line emission. They also appear to have roughly similar line-to-continuum ratios.
The arc appears to be edge-brightened within an angle of from the radio axis; this is within the probable quasar opening angle (e.g., Saikia & Kulkarni, 1994; Wilson & Tsvetanov, 1994). It seems likely that this edge brightening is related in some way to the radio source and could be the result of illumination by the active nucleus. One subtle morphological clue is probably best seen in Fig. 3, marked with an arrow: there appears to be a faint echo of the arc structure parallel to the main arc, at a radial distance of about 04. Though very narrow, it seems to be fairly well defined and may well be real, even though it is not evident in the (shorter exposure) F814W image.
The NICMOS F160W image provides IR imaging at a resolution comparable to that of the WFPC2 imaging in the optical. As was already indicated by the NIRC image, much of the spectacular structure seen in the optical images is no longer evident at rest-frame 8000 Å. At this wavelength, 3C 280 is dominated by a quite regular elliptical profile, though the object is still visible, along with the probable companion galaxy and continuum object .
Detailed exploration of the radial surface-brightness profile confirms that the light distribution follows quite closely a de Vaucouleurs law and is not well fit by an exponential disk model. We have taken two different approaches to this fitting. In both cases, we use a NICMOS F160W PSF from Ridgway et al. (2001) both to subtract off a point-source component and to convolve with the calculated galaxy models.
The first approach used the fitting procedure described in Lacy et al. (2002), which iteratively fits a two-dimensional (2D) model to the galaxy, consisting of a point-source component and an underlying elliptical or spiral galaxy model. A statistic is generated to assess the goodness of the fit of the model to the data, allowing some estimation of the uniqueness of the model fits. (Galaxy and component were removed from the image before fitting.) The best-fit model included an unresolved nucleus contributing about 10% of the total -band flux. While a model with no point-source contribution has a that is worse by only 1, the 2D residuals in the central region are clearly poorer than for the model with a point-source component. The best-fit model has a de Vaucouleurs profile with an effective radius , an eccentricity of 0.29, and a position angle (PA) of 86°
Our second approach was to make a similar two-component, 2D fit by inspecting visually the residuals after subtraction of the model from the data. After an estimated point-source component was subtracted, we fit the residual elliptical using the STSDAS task ellipse to measure the surface-brightness profile, varying the eccentricity and the PA separately to determine a consistent set of parameters. Using the best average values of the eccentricity and PA from these preliminary fits, we then constructed a range of two-dimensional de Vaucouleurs models, varying the and the point source contribution, until a best fit to the image profile is found. This approach gave , an eccentricity of 0.28, and a PA of 85°. The point-source contribution was 9% of the total flux, corresponding to an magnitude of 21. The effective radius is similar to that found in the first method, and the variation in the result gives some idea of the error in our measurement.
This nuclear magnitude corresponds to an absolute V magnitude of 21, which would be a very faint quasar luminosity were the nucleus unobscured. However, Donahue, Daly, & Horner (2003) find from Chandra ACIS-S that the nucleus of 3C 280 is a hard source, with an unusually flat X-ray spectral index, indicating absorption in the soft X-ray band. This finding is consistent with the central source of 3C 280 being an obscured, luminous quasar rather than an unusually faint one (compare the result for Cygnus A, Young et al. 2002).
Figure 5 shows the residual after subtraction of the best-fitting elliptical model. The residual nuclear point source has a FWHM that is roughly consistent with the one bright star in the field, and it has a clearly visible diffraction ring. The rest of the residual map is quite smooth: good evidence that some kind of central compact component is necessary to provide a good fit to the data.
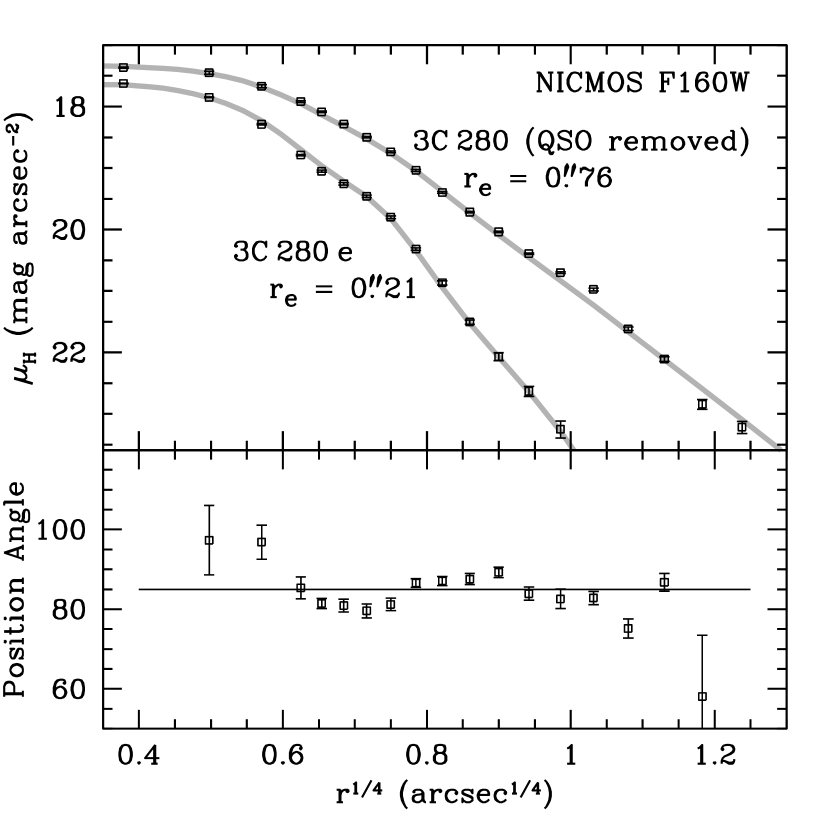
The radial surface-brightness profiles for both 3C 280 and the apparent elliptical companion , along with the best-fit models, are shown in Fig. 6. The bottom panel in Fig. 6 shows the fit to the observed profile with the center and eccentricity held fixed, but with the PA allowed to vary. The errors become large at very small and very large radii, but the PA is remarkably constant over most of the range. This consistency demonstrates clearly that the close alignment of the elliptical PA with the radio axis is found at all radii.
At , with our ground-based 07 seeing, we also found the galaxy profile to be well fit by an profile with an of 085 and fixed PA = 85°, with an estimated nuclear contribution to the elliptical of 10% (RS 97). The higher resolution data has confirmed what could not be shown with ground-based seeing: it is in fact the major axis of the regular elliptical galaxy that appears to be aligned with the radio jet, and the result is not due to a discrete aligned contribution that was unresolved at ground-based resolution. This is further borne out by inspection of the residual image for our elliptical fit. The double components of object c were clearly ignored by the fitting procedure, which takes the median flux along the elliptical isophote and is therefore insensitive to small, discrete features. The smooth residual (except for the nucleus and ) shows that there are no extra discrete components that could have twisted the elliptical isophotes into alignment with the radio axis; such features would show up as structure in the residual map. Any of the aligned UV components which dominate in the WFPC2 image would have been resolved in the NICMOS image and therefore would have affected the structure of the residual map, and thus they cannot account for the alignment of the elliptical fit. We cannot distinguish in the image between stellar and non-stellar light, and therefore we cannot rule out the existence of a broader, red aligned component with a profile similar enough to the stellar profile to give the sum of the components a good de Vaucouleurs fit. The spectrocopy, however, indicates that the stellar population should be fairly dominant at rest-frame 4000Å, and we see no evidence for a non-stellar red component.
.
3.3 Spectroscopy
3.3.1 Analysis of the spectra
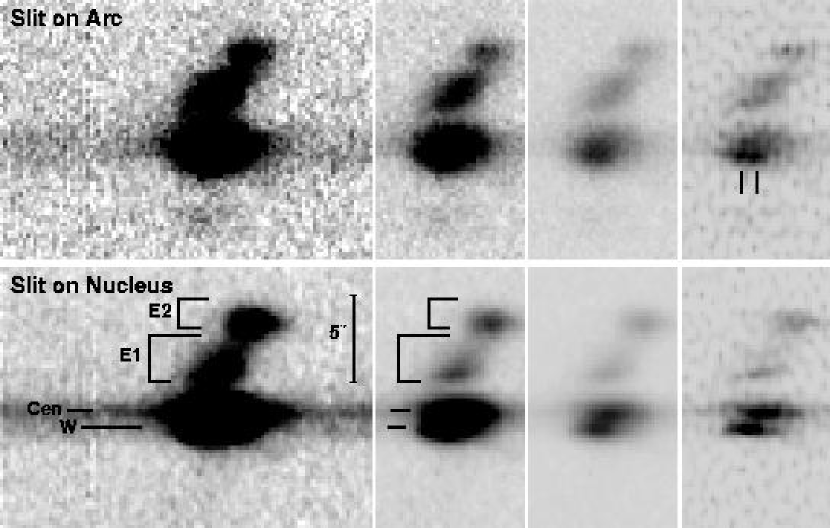
In Fig. 7 we show extracts of the two-dimensional [O II] line emission from both of our slit positions. Continuum is obviously visible from the nuclear region and from a distinct component to the west of the nucleus, and there are several distinct components to the east with varying velocities. We have named these primary components according to their relative position with respect to the nucleus: , , , and , and we show these labels next to the [O II] profile for the nuclear slit as well as on the slit map (Fig. 1).
In order to measure fluxes for the different physical components, we have extracted one dimensional spectra parallel to the central continuum with aperture widths of 4 pixels, corresponding to about one spatial FWHM (086). The components and extend over several FWHM, while is confined to one FWHM. We refer to the subdivisions of and as , , , , and when we wish to preserve our best spatial resolution, but we sum these individual spectra when discussing the overall physical properties of components and . The central spectrum has been extracted with a slightly wider aperture of 5 pixels (108) around the central continuum to minimize other contributions while maximizing signal-to-noise. It can be seen that the spectral extraction is dominated by the imaging component , while the spectral extraction Cen corresponds to the components + . The spectral extractions and include portions of the eastern emission at differing distances from the nucleus. In Fig. 9 we show line identifications for all lines seen in the central spectrum and in spectral component W.
We have measured fluxes in the various 1-D spectra with Gaussian fits (multicomponent, where necessary due to line overlap) and give the results for the central components (Cen and ) in Table 2 and for the (sub-divided) eastern components ( and ) in Table 3. Wavelength errors are 1 Å, and statistical errors in the fluxes are 10%, except where noted in the table. In some cases of very faint lines, fluxes are measured after smoothing the spectrum with a 5 pixel ( Å) kernel.
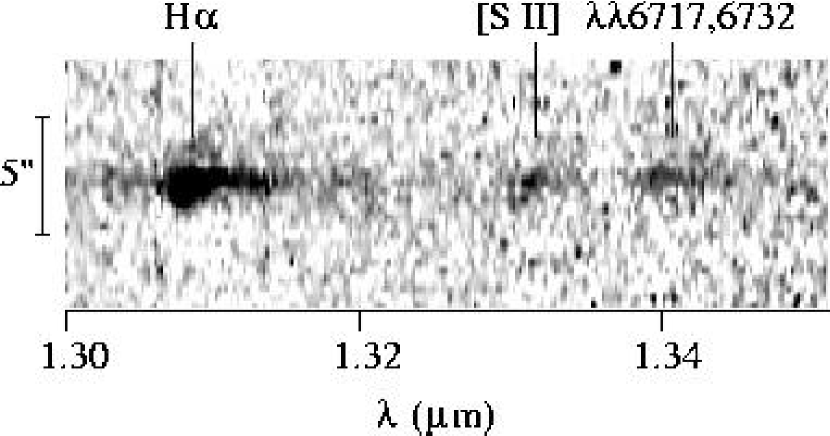
We show the long wavelength band near-infrared spectrum in Fig. 8. To allow comparison of the lines detected in the near-infrared with those in the optical spectrum, we have transformed the near-infrared spectra centered on the 3C 280 nucleus to match the optical spectra in spatial scale. We have extracted 1-D spectra at the positions expected for the primary extended line components seen in the optical, with the larger apertures necessary due to the poorer spatial resolution of the near-IR spectra. We can compare these to matching extractions made from the central optical spectrum. Seeing conditions in both the optical and near-IR observing runs were fairly well matched to the slit size, and it can be seen from the [O II] image that the central line components are fairly compact. However, without any direct spectral overlap it is difficult to account for relative flux calibration, and we might expect errors as much as 30–50% between the different spectra. We have measured the near-IR line fluxes with one component Gaussian fits, fitting the continuum directly in the region of the line, and give these in Table 4. Fluxes were measured after smoothing with a 5 pixel Gaussian (except for the flux).
3.3.2 Observed Emission Line Spectra
The spectra of the central and western components are shown in Fig. 9 and of the eastern components in Fig. 10. The central and western optical spectra have good S/N for a wide range of emission lines. There is also a strong stellar component, as the stellar absorption feature Ca II K and a clear 4000 Å break are visible directly. In addition all regions show continuum emission, although little from the eastern components E1 and E2. The emission lines ratios vary from region to region.


First, we check from the Balmer line ratios in the optical spectrum the reddening to the emission line gas: from to in the central spectrum and from to in component W we find that the reddening is probably reasonably low, as the ratios are basically consistent with Case B recombination (Osterbrock 1989). We therefore assume reddening to be zero throughout the rest of the discussion.
One straightforward measure of the ionization properties in gas is the [Ne III]3869/[Ne V]3426 ratio (Osterbrock, 1989). The relative strengths of these lines are determined by the ionization parameter, assuming temperature and electron density to be similar. We use this line ratio instead of the [O II]/[O III] line ratio commonly used in studies of low- objects, since the [Ne III] to [Ne V] line ratio will be little affected by reddening, and it doesn’t require us to use the infrared spectrum (for which the calibration relative to the optical has uncertainties). We find that the line ratio is lowest in the central component (ratio=1.5) and generally increases with distance from the nucleus where well-measured. The line ratio in is 2.1, while in the brightest sub-components of and ( and ) the ratios are 3.5 and 5.3, respectively. The line ratio therefore increases with distance in these eastern components. This decrease in the ionization state is consistent with photoionization from the central source being the primary mechanism heating the emission line gas, although density effects may also play a role in the differences among these spectra.
Best, Röttgering, & Longair (2000b) used the intensity ratios of C III] /C II] and [Ne III] /[Ne V] to infer whether the ionization of the gas was primarily due to shocks or photoionization in 9 radio galaxies, including 3C 280, which they conclude is within the photoionized domain. Our spectra do not include C III] , so we cannot construct similar diagrams for the various individual components of 3C 280. While the C III] /C II] ratio used by Best, Röttgering, & Longair (2000b) was from their own recent spectroscopy, the [Ne III] /[Ne V] ratio of 0.7 that they used was from early spectroscopy by Spinrad (1982). Our larger values for this ratio in 3C 280 actually give even better agreement with the photoionization models, provided that the C III] /C II] ratio stays close to that found by Best, Röttgering, & Longair (2000b). This is almost certainly the case for the central region, which dominates the emission-line spectrum, so we can fairly definitely say that the gas there is photoionized. The upper limit of to the C I] /C II] ratio reinforces this conclusion: for the shock models of Dopita & Sutherland (1996), this ratio is greater than this in almost all cases except for very high magnetic parameters.
Another emission line diagnostic is the relative strength of the [O III] ,5007 and [O III] lines. This is a temperature diagnostic, and can be used as an indicator of whether emission line gas properties are more consistent with shock heating or photoionization as the primary excitation mechanism. In our near-infrared spectra we were able to detect 5007 in the central region, , and . (In the central region, we detected also 4959 with the expected flux of about one third 5007). In the optical spectra, [O III] 4363 was detectable only in the central component and , not in the extended emission line gas to the east, and . The ratio of [O III] ,5007/[O III] is 110 in the nucleus and about 95 in the spectral component (which includes primarily emission from the component seen in Fig. 4). The relative calibration between the near-IR and optical spectrum could be incorrect by some 30%. In any case, the line ratios are clearly quite high, and unlikely to be consistent with the values of 10–20 predicted for pure shock ionization models (Solórzano-Iñarrea, Tadhunter, & Axon, 2001; Dopita & Sutherland, 1996). The ratios we find are comparable to or less than those predicted by pure photoionization models or those found in low- radio galaxies considered to be primarily photoionized (Solórzano-Iñarrea, Tadhunter, & Axon, 2001), while somewhat higher than that found for 4 galaxies (ratios 50) that had significant kinematic signatures of shocks. The ratios we find are therefore basically consistent with photoionization being the dominant excitation mechanism in the gas, but not inconsistent with mixed models that include precursor ionization contributions from shocks.
In each individual region, the gas seems fairly quiescent, with no particularly large linewidths. In the arc spectrum, the [O II] doublet is resolvable throughout the extended emission line region. As can be seen from Fig. 7, the line centers in the eastern components are redshifted, with the farthest component having a larger relative velocity. Internal to component , some kinematic signature of slightly increasing velocity with distance is also visible (particularly in the upper spectrum showing the slit placed on the arc position). These eastern emission line regions surround part of the eastern radio lobe, and the redshifted velocity gradient is consistent (for the orientation of the object) with this gas being pushed out by the radio lobe. It is surprising that the velocities are not higher, however, if the material has been directly entrained in the lobe. The emission line gas in component (mostly image component ) also is consistent with the probable orientation of the object, in that it exhibits a slight blueshift. Both emission line region velocities are consistent with outflow along the jet direction. This is also a kinematic signature of rotation, although the rotation axis would have to be anti-correlated with the angular momentum axis of the black hole producing the jet. Best, Röttgering, & Longair (2000a) suggest that a rotation of the halo and the host galaxy could explain some of the kinematic signatures in the emission line gas they studied around – 2 3C radio galaxies. In general, the total velocity shifts and widths are moderate, at most a few hundred km s-1; there is nothing similar to the thousands of km s-1 shifts seen in radio galaxies like 3C 368, where radio-jet interactions causing shocks must be important.
3.3.3 Decomposition of the spectra
We have so far discussed only the emission line properties of the gas, but we have clearly detected significant continuum in the central components, as well as stellar absorption lines. We therefore wish to separate, if possible, the different spectral components which contribute to our observed spectra. We will discuss each spectrum in turn.
The Central Component Figure 11 shows an attempt to isolate the various contributions to the observed continuum for the central component. We start by subtracting the emission lines and the nebular thermal continuum (i.e., free-bound, free-free, and two-photon). For the latter, we have assumed Case B for the hydrogen emission, a temperature of 15000 K (except as noted), an average ionization fraction of 0.1 for helium, and the low-density limit for two-photon emission. For most of the lines, we simply have fitted a Gaussian profile assuming an interpolated continuum for a baseline.
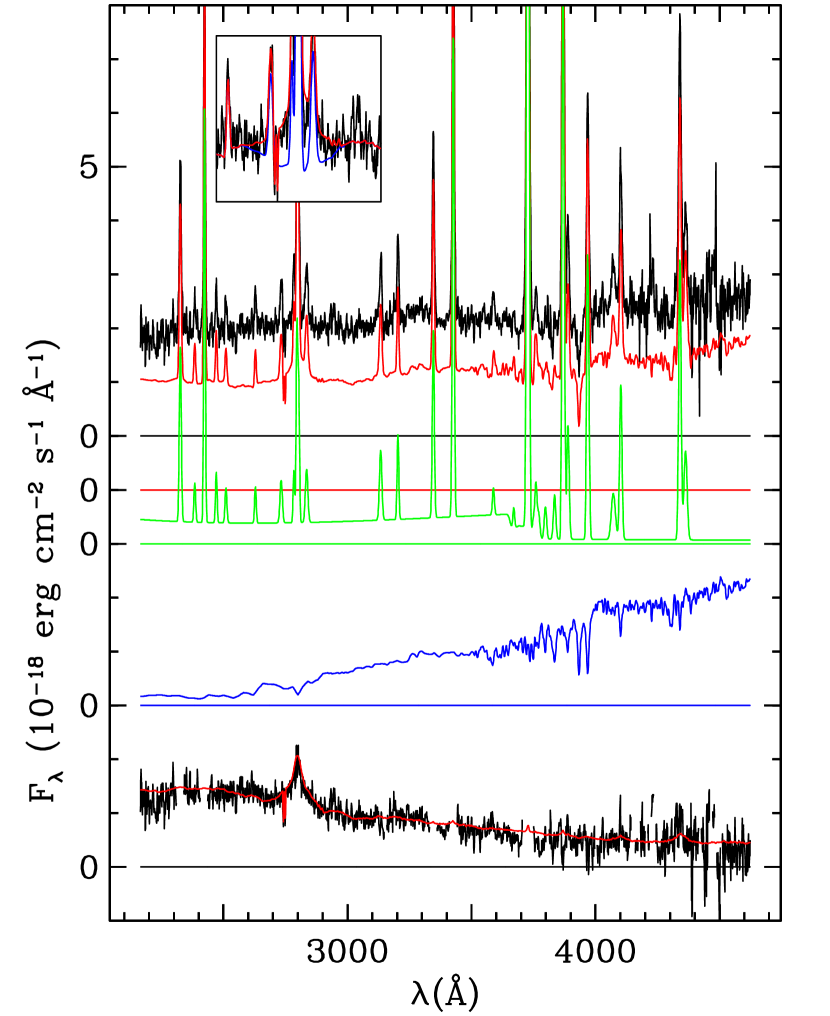
However, some lines are affected by features in other components; for these, an iterative approach was required to arrive at a self-consistent solution. The lines affected include the Balmer emission lines, the [Ne III] ,3968 lines, and lines in the vicinity of the Mg II ,2803 doublet.
Once we have fixed the fluxes for the H and H lines, the scaling of the thermal emission is determined. The [Ne III] emission is confused by H emission and absorption and by Ca II H absorption, but its ratio of 1/3 (in photon units) to the stronger [Ne III] line allows it to be subtracted quite accurately.
The observed spectrum clearly shows the Ca II K absorption line and evidence for a 4000 Å break, the latter, at least, indicating the presence of a relatively old stellar population. The presence of old stars can also be inferred from the closely -law radial-surface-brightness profile at rest-frame wavelengths of 1 µm (RS97) and 0.8 µm (§3.2). However, no single or composite stellar population could be found that would adequately reproduce the entire residual continuum, and we also find a broad component to the Mg II emission, indicating direct or scattered emission from a quasar nucleus.
To isolate the contribution from the stellar component, we have tried to find one that would leave as smooth a residual as possible. We have experimented with stellar models comprising various combinations of Bruzual & Charlot (1996) isochrone synthesis stellar populations (restricted to the higher-resolution, solar-metallicity ones that roughly match the resolution of our data). We rapidly converged towards a dominant contribution from a population older than about 1.5 Gyr, necessary to provide the observed curvature in the spectrum between about 2800 and 3600 Å, while also fitting the 4000 Å break and absorption features at longer wavelengths. However, populations older than about 3 Gyr, which otherwise fit well, oversubtract the flux at the long-wavelength end. With the S/N of this composite spectrum, we cannot rule out small admixtures of a younger population but no significant portion of the light can come from populations with ages of 50 Myr or younger because of constraints on the residual flux at short wavelengths.
In the following subsection, we attempt to isolate the elliptical component, and there derive a stellar population of 2–4 Gyr. Therefore, for simplicity, in Fig. 11, we have used a single, instantaneous burst population with an age of 3 Gyr, which fits as well as any of the composite populations we have tried. This model should be regarded as a proxy for any more complex star-formation histories that could give similar SEDs.
The inset in Fig. 11 shows the region around the Mg II line in more detail, including a blue trace showing the consequence of omitting the broad Mg II profile from the QSO model spectrum. The appearance of “oversubtraction” around the Mg II line is wholly due to the dip in the stellar population model at that wavelength. The broad Mg II profile itself is well fit by a Lorentz profile with a rest-frame FWHM of 56 Å. It is not clear whether we are seeing the broad-line region directly or via scattering by dust or electrons. If we are seeing it directly, and the broad-line region has an extinction similar to that inferred for the QSO continuum from the hard x-ray spectrum (Donahue, Daly, & Horner, 2003), only a very small percentage of the lines of sight can be unobscured. If the scattering is by dust, particularly (as would seem likely) optically thick dust, there are a number of combinations of scattering parameters that would preserve the approximately gray scattering that we seem to see over our restricted wavelength range (see, e.g., Zubko & Laor 2000). If the scattering is by electrons, the lack of substantial broadening beyond the typical QSO profile is inconsistent with the scattering electrons having a temperature K (see, e.g., Cimatti et al. 1996).
There are several cases among radio galaxies for which spectropolarimetric observations have detected broad Mg II lines (Dey & Spinrad, 1996; Cimatti et al., 1996, 1997), and sometimes this broad emission is discernible in the total flux as well. The example most similar to our observations of 3C 280 is that of 3C 356 (Cimatti et al., 1997), for which the broad Mg II is detected in the apparent nuclear component. Whereas we obtain a total flux of erg cm-2 s-1 for the broad component, corresponding to a luminosity of erg s-1, Cimatti et al. (1997) find a flux for 3C 356 corresponding to a luminosity of erg s-1 (for our assumed cosmological parameters). Given that their slit width was twice ours, these values are identical within the uncertainties. When we subtract both the emission-line and stellar models from the observed spectrum, we are left with the black trace at the bottom of Fig. 11, which shows a continuum that decreases with wavelength, with a superposed broad Mg II profile (the latter has a displaced Mg II absorption doublet). We have made a composite QSO SED by smoothly joining, just shortward of the Mg II profile, the Zheng et al. (1997) composite spectrum (which we take to be more representative of radio-loud quasars, but which does not extend shortward of 3000 Å) to that of Francis et al. (1991). We have simply scaled this spectrum to our residual near 3200 Å, and aside from adding the Mg II absorption profile, we have made no other adjustments. This composite QSO spectrum is a good fit to our residual spectrum. We add this QSO model to our stellar and emission-line models to obtain the model for our observed spectrum, shown in red just under the observed data at the top of Fig. 11. Note that at about 3000 Å, the quasar, the stellar component, and the thermal continuum all make roughly equal contributions to the total continuum observed in our slit.
Another source of emission is also possible in this central component. The close alignment of the radio map with component indicates that much of the F622W flux in could be optical synchrotron emission. If we assume that a synchrotron component with spectral index 1.3 is also contributing to the central spectrum, we can make a good model fit by adding a 25% contribution from the synchrotron component and by decreasing the quasar contribution by 50% and the old stellar population by 10% (these percentages are referenced to the F622W filter). This model fit is essentially as good as the one without optical synchrotron.
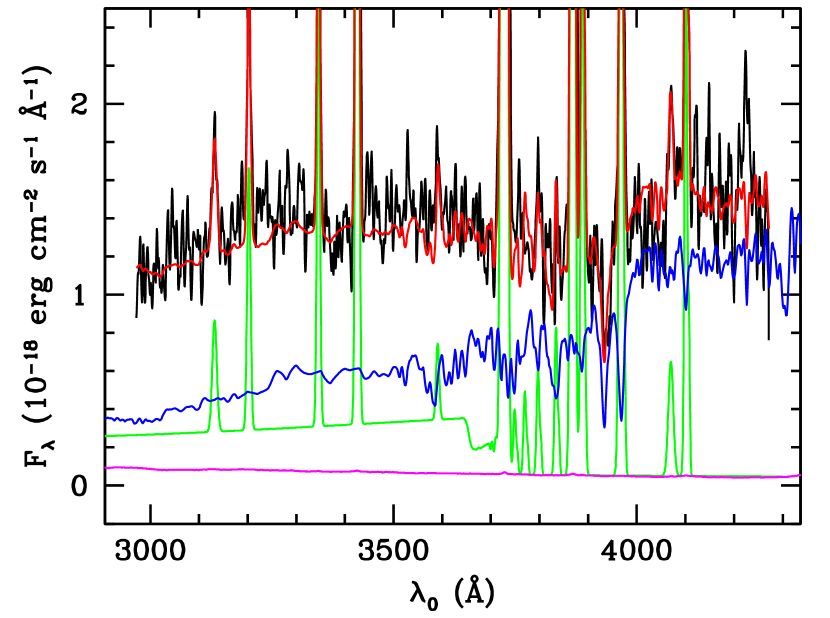
The Elliptical Component We have carried out a similar analysis on the spectrum extracted from a region east of the nucleus that is reasonably clear of observed structure in the HST WFPC2 images. Because of its proximity to the nucleus, this region gives us our best hope of obtaining a relatively uncontaminated spectrum of the underlying elliptical component dominating the IR images. The spectrum obtained for this region is shown in Fig. 12. Although there is still substantial emission in this region, the stellar component dominates the continuum longward of about 3700 Å. The age of the stellar population is not well determined: any solar-metallicity models from Gyr to Gyr could be fitted fairly easily, as could somewhat younger populations with higher metallicities.
The Western Component and the Arc
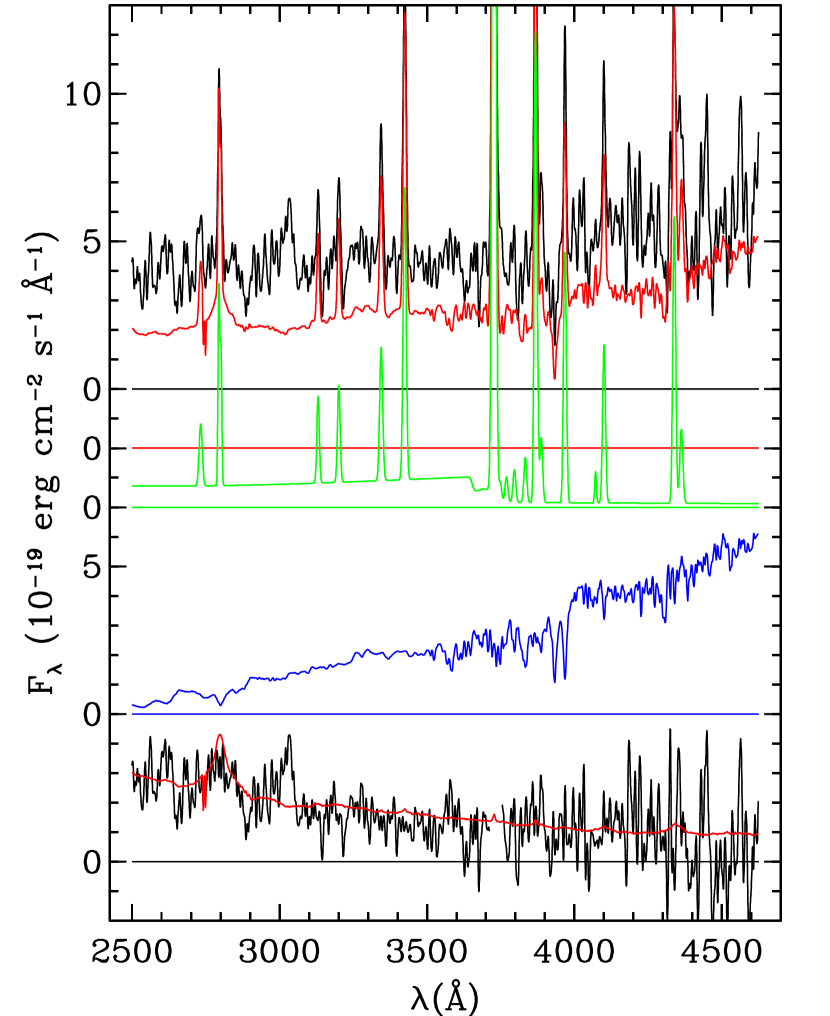
We have applied this same spectral decomposition procedure to the spectra of the western component W ( in Fig. 4) and of the arc (). In both cases, we assume a contaminating stellar population from the spheroidal component similar to that found above from the “clear” region east of the nucleus.
The spectrum of component shows relatively strong emission (Fig. 13). In this case it was necessary to assume a lower of K for the nebular thermal continuum in order to achieve a satisfactory fit; this lower temperature is not unreasonable, given clouds with densities similar to those in the central component at a greater distance from the ionizing source.
After we subtract off the emission component, we are constrained by purely spectroscopic considerations in the amount of 3-Gyr-old stellar light from the spheroidal component we can subtract. If we try using only this one stellar population, we are left either with an oversubtraction of the 4000 Å break or with a significant residual with a fairly flat (in ) SED. The best solution we have found incorporates an additional stellar component with an age of Gyr. The slightly sloping residual remaining can be accomodated by our standard QSO spectrum without violating constraints on broad Mg II emission. However, if we were to try to accommodate enough scattered QSO light to avoid the need for the young stellar population, we would run into problems with the lack of broad Mg II emission. We could wash out this feature with scattering by hot electrons, but this would require electrons with velocity dispersions km s-1. Electrons at this temperature would not be confined to the relatively small discrete components seen at long wavelengths for object .
As a check on this model, we can estimate the relative flux expected from the spheroidal component at the position of our “clear” region east of the nucleus and at the position of component from the NICMOS F160W image and compare this ratio to that for our scaling of the 3 Gyr populations in these two regions. Our best estimate gives a ratio of about 1.4 (for the region centered on to the “clear” region) from the NICMOS image, compared with a ratio of scaling factors for the 3 Gyr population in the spectral decompositions of 1.25. These are identical within the errors.
Once again, we cannot claim uniqueness for this decomposition. However, if the only important contributors to the observed spectrum are nebular emission, stars, and scattered quasar light, we do have reasonable evidence for a moderately young stellar population contributing to object , although well over half of the light at rest-frame 3500 Å (leaving out the spheroidal component) is due to nebular thermal continuum. It seems quite likely that the two peaks seen in the longer wavelength images of (see Fig. 4) are regions dominated by younger stars (with average ages around 100 Myr), whereas the more uniform and diffuse appearance of at shorter wavelengths shows mostly the distribution of the emission-line gas and scattered quasar continuum.
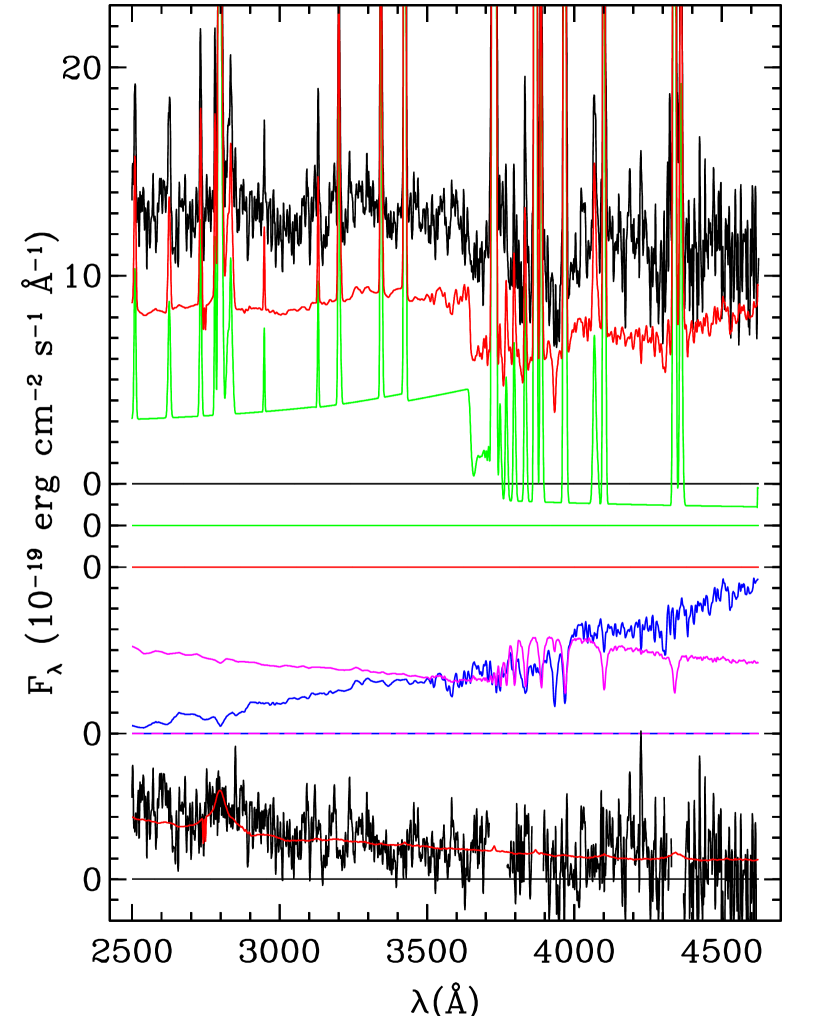
Our data on the spectrum of the arc is more restricted in wavelength, but the decomposition is well constrained. Careful measurement of relative positions along the slit indicates that we were successful in obtaining a spectrum of the arc, with little contamination from other components. The spectrum is shown in Fig. 14. The nebular thermal continuum is well determined by the strong H line, and the scaling of the spheroidal component is constrained both by the Ca II K absorption and the overall shape of the continuum. We have experimented with adding in a younger population that might be intrinsic to the arc, but there is no room for any significant stellar population younger than Gyr. This finding is consistent with the invisibility of the arc in the NICMOS F160W image.
3.4 Properties and Analysis of the Stellar Components
Our spectroscopic analysis has indicated the presence of stars due primarily to two components: the underlying elliptical and an additional younger stellar population in the object . Using the high-resolution near-infrared imaging, we can check whether the broad band colors of these components are consistent with the spectroscopic determination of the ages of the stellar components. We can estimate the elliptical contribution to the F622W band by taking the elliptical model from the best-fit to the infrared and (convolving with the appropriate PSF) estimating the elliptical contribution to the F622W band. From RS97, we found the optical–IR colors were consistent with a 2 – 4 Gyr old stellar population; the F160W flux from the elliptical agrees with this earlier result.
This is more difficult for the younger stellar population we infer to be present in component . The two discrete peaks visible in the F160W NICMOS image are most likely associated with this stellar component, while in the bluer passbands the contribution from the thermal continuum is dominating. To estimate the optical–IR colors of this stellar component alone, we have first measured the total flux in the F622W image that contributed to spectrum W (in the 1″ slit with aperture width of 086), which is dominated by component . From our spectral decomposition shown in Fig. 13 we estimate that this young stellar population should contribute 25% of the flux over the rest-frame passband of the F622W filter. Seeing was good during these observations and most of the flux seen in the F622W image should have been confined within the spectral aperture. We correct the F622W flux by this factor and use this value as the blue photometry point. The stellar components should be the primary contributors to the flux in the F160W filter (at rest-frame m). We take the elliptical-subtracted F160W image (as shown in Fig. 5) and measure the flux in the same aperture (which includes the double peaked component and some background). The ratio of the corrected F622W flux to the F160W flux for the young stellar component of is 3.3, but uncertainties in how much flux of each component would be included in the slit could give ratios different by a factor of two. Nonetheless, the flux ratio between these two filters predicted for a stellar population of 100 Myr is 2.8; our broadband photometry is therefore quite consistent with the ages of the stellar populations we derived from the spectroscopy.
In order to assess the mass of the elliptical component in a direct fashion, we have attempted to measure the stellar velocity dispersion in the central spectrum by using the Ca II K absorption line, which falls in a relatively clean part of the spectrum. This was done by convolving with the instrumental profile the average of three stars (two G0 IV and one F8 IV stars that fit the integrated stellar spectrum well) from the KPNO coude feed spectral atlas (Leitherer et al., 1996), then finding the Gaussian that would bring this profile up to the observed Ca II K profile. The resultant sigma was found to be 270 50 km/s, corresponding to a massive elliptical.
While the Ca II K absorption line is not the optimal line to use in determinations of velocity dispersion, it is the only one available to us. Interstellar contamination is unlikely to be significant in a galaxy that is dominated by relatively old stars. In addition, we get a good fit to the strength of the Ca II K line from the spectral synthesis model, which leaves little room for additional ISM absorption. The Ca II H and K lines are, however, intrinsically broad, so they are less sensitive indicators of velocity dispersion than are narrower lines. Kormendy & Illingworth (1982) found that inclusion of these lines in the determination of velocity dispersions by the Fourier quotient technique resulted in a systematic overestimate of the velocity dispersion by about 20%, possibly due to the effect of slight mismatches between the template and galaxy spectrum, together with the steep continuum gradient in the region of the H and K lines. We believe that our direct convolution of template spectra (after flattening the nearby continuum), while lacking the precision of the Fourier quotient technique (as reflected in our error estimate), is not likely to introduce significant systematic errors.
We can use the present-day velocity dispersion—black hole mass relation (e.g., Tremaine et al., 2002) to make an estimate of the mass of the black hole in 3C 280, assuming that this relationship does not evolve with cosmic time. We have made a rough aperture correction using the formula of Jorgensen, Franx, & Kjaergaard (1995) to the radius used by Tremaine et al., which raises our estimate of sigma to 290 kms-1, corresponding to a black hole mass of , typical for a radio galaxy in the local Universe.
We obtained another estimate of the black hole mass from the luminosity of the galaxy, using the correlation of van der Marel (1999). We corrected the -band magnitude of the galaxy to rest-frame -band using the elliptical galaxy model of Fioc & Rocca-Volmerange (1997). Correcting for passive evolution of 0.9 magnitudes in -band using the same model, we estimate the black hole mass to be , in good agreement with our estimate from the velocity dispersion of the galaxy.
4 Discussion
Our imaging and spectroscopic observations of 3C 280 have allowed us to determine the probable sources of the rest-frame optical and UV emission we observe from most of the morphological components. We attempt to draw these data together in combination with our high resolution radio mapping to provide a coherent physical picture of the galaxy.
4.1 Extended Emission-Line and UV Continuum Structure
The rest-frame UV continuum structure mirrors the [O II] image closely. The most likely emission sources that provide both line and continuum emission with similar morphologies are (1) H II regions with their associated young stars, and (2) line and thermal emission from hot gas, produced either from external photoionization or from shocks. We find no evidence for large populations of extremely young stars in our spectra that could produce H II regions. On the other hand, our observations indicate that nebular continuum emission is a large contributor to all of the UV components, and the line ratios discussed above tend to favor photoionization over shocks. In addition, no large velocity gradients or line widths were found in any of the components, which also indicates that direct shock heating of the gas is unlikely to be important.
In the eastern components, the [Ne III]/[Ne V] line ratios drop off with distance from the nucleus, supporting photoionization as the primary excitation mechanism in these components. The eastern components show morphological placement and kinematic signatures that make it likely that the gas has been lightly entrained in the outskirts of the radio lobe expansion, yet is not being violently disturbed or heated by associated shocks.
Some of the most intriguing features of the rest-frame UV image of 3C 280 are the arc between components and , and component itself. The apparent edge brightening in and seen in the HST F622W image likely results from illumination effects involving photoionization and/or scattering. The decomposition of the arc spectrum shows that the continuum is almost entirely nebular thermal emission, and the line emission is probably mostly due to photoionization from the quasar nucleus, as there is no evidence for young stars in the arc.
To produce the unusual arc morphology, however, the main possibilities are (1) that the arc is a tidal feature resulting from an interaction between component (an associated galaxy, in this view) and the central mass of 3C 280, that is then photoionized by the quasar; or (2) that the arc morphology is formed by a shock front, caused by the radio source or jet in some way. The closest analogy at low redshift to this arc that we are aware of is the similarly smooth semicircular arc seen in [O III] emission in the quasar 3C 249.1 (Stockton & MacKenty, 1983, 1987). This arc also appears to be principally a gaseous feature, with no evidence of associated stars. This similarity, however, is not very illuminating, since the origin of this arc is also uncertain. Stockton & MacKenty (1983) suggested a tidal origin, but it is also true that the arc and a straight counter-feature are both roughly aligned along the radio axis. If these features are tidal, their alignment with the radio axis would be solely a result of enhanced emission within the quasar opening angle. The arc “echo” in 3C 280 (if real) might be difficult to account for in this picture. The placement of on the radio axis would also have to be viewed as a coincidence, aside from its enhancement due to scattering and photoionization.
Alternatively, the arc (and perhaps the flattened component ) might be due to emission at or behind a shock front that originated somewhere near the radio axis. Both line and continuum emission could come from the shock-heated gas, and are generally expected to occur down-stream of the shock as the gas cools. Photoionization of the material then could also occur after the shocked gas bubble had formed. The arc “echo” might then be a natural second feature caused by whatever shock system created the arc in the first place. However, while we have no way of easily discriminating shock ionization from pure photoionization in the arc, the edge brightening and the low velocities relative to the nucleus lead us to believe that this gas is not currently being severely affected by shock. Perhaps some of the relative velocity in the arc could be hidden by making it a transverse velocity, but the velocities in the gas are certainly very quiescent.
An emission-line arc, though not nearly as precise and circular as the one in 3C 280, is seen around the radio lobe of the low- radio galaxy PKS 2250-41 (Tadhunter et al., 1994). The arc is associated with blue continuum emission, and is likely to have come from a shock caused by the impact of the radio jet on a region of ambient material with higher-than-average density. However, in that case, the arc clearly follows the lobe radio contours; in 3C 280, the arc is not associated with a radio lobe at all (unlike the material on the east side, which does appear to be related to the eastern radio lobe).
If we had detected a stellar component in the arc with ages older than the likely age of the radio source, we would have had fairly compelling evidence for a tidal origin for this feature. As it is, we cannot come to any such firm conclusion: the arc could indeed be a tidal feature, but it seems equally possible that it is some sort of shock phenomenon associated with the radio jet. The similarity to the arc associated with 3C 249.1 remains striking, and it may be that a more detailed study of this object would prove illuminating for our understanding of 3C 280.
In , while the [O III] ,5007/[O III ]4363 line ratio we observe is more consistent with photoionization than with pure shock excitation, it is certainly consistent with combined models, in which shocks ionize pre-shock gas. A definite problem with a shock formation interpretation is the presence of stars with ages of Myr. These are probably too old to be consistent with jet-induced star formation associated with the current radio source, and it is difficult to believe that the alignment would be preserved if they had been produced in a previous radio outburst. However, the gap in at the longer wavelengths aligns quite well with the jet; this is reminiscent of the jet-associated gap in Cygnus A (Jackson et al., 1994; Cabrera-Guerra et al., 1996). If this rest-frame 0.8 m morphology is associated with the young stellar component, and we take the gap as jet-associated, then it is difficult to explain this gap without invoking jet-induced star formation.
In the radio galaxy 3C356, a discrete aligned component showing a 4000 Å break falls directly on the jet axis, yet has infrared-to-optical colors that are too red to be consistent with a stellar population young enough to be the result of jet-induced star formation from the current epoch of radio activity (Lacy & Rawlings, 1994). In this case, Lacy & Rawlings (1994) suggest that the stellar population induced by the jet might have had an initial mass function (IMF) heavily weighted towards the high mass end, resulting in a population (after a few years) dominated by red supergiants. This would allow for red colors in less than the lifetime of the radio source. Such top-heavy IMFs are observed in starburst galaxies, and have been suggested as a possible consequence of jet-induced star formation (Rees, 1989; Bithell & Rees, 1990). In our case, we see no obvious signatures of very young massive stars in our spectrum of . In fact, a large contribution from red supergiants would hurt, rather than help, our decomposition of its spectrum, and we would still need to identify another blue component to allow us to match the observed spectrum. However, we cannot exclude the possibility that by varying metallicity effects and using high mass stars with a range of evolutionary states we could produce an integrated spectrum close to that we have identified as a -Myr-old population.
Morphologically, we see some structures that must be related to the radio lobe and jet expansion and interaction with the galaxy and ambient medium, yet line diagnostics and kinematics give little evidence of shocks. Possibly most of the aligned emission line gas in 3C 280 has passed through the shocks, and is now cooling and being photoionized. This is consistent with 3C 280 playing some intermediate role between the compact steep-spectrum objects that Best, Röttgering, & Longair (2000b) say are primarily shock-excited, and the extended, less aligned, radio galaxies from the same sample which are dominated by photoionization. This interpretation is also consistent with 3C 280’s intermediate radio size (and therefore intermediate age of radio activity) in the sample of Best, Röttgering, & Longair (2000a).
4.2 The Elliptical Galaxy
Although much of the aligned light is in the rest-frame UV components, the underlying old elliptical also appears to be extremely well aligned with the radio axis. The elliptical is well fit by a de Vaucouleurs profile both in the high resolution, rest-frame 0.8 m NICMOS image and at rest-frame 1 m from a deep Keck image. Although we cannot rule out from the imaging alone the possibility of a contribution from some extended aligned, red component with a similar spatial profile, spectrocopy indicates that the stellar population should be fairly dominant at rest-frame 4000Å, and we see no evidence for a non-stellar red component.
The stellar population is clearly fairly old; our spectroscopic fit gives a range of about 2–4 Gyr, assuming solar metallicities. We also find that the galaxy has a high mass, with a stellar velocity dispersion km s-1. On any reasonable interpretation of the evidence, this is a massive, old, relaxed galaxy, fully in place by , and it is difficult to understand the quite precise alignment of this distribution of old stars with the radio axis and with other morphological components such as the gap in object and the baseline of the arc . The easiest way out is simply to say that this is a single example, and that the alignment is pure chance. But, at low redshifts, Roche & Eales (2000) find a similar alignment for the three most powerful radio galaxies (3C 330, 3C 341, and 3C 348) in their sample of 16 3C galaxies. This alignment is especially compelling for 3C 348 (see also West 1994), which is the most powerful radio galaxy at low redshift besides Cygnus A. For Cyg A itself, the inner optical structure has long been known to be aligned with the radio axis, although the large-scale stellar distribution is not (its axis makes an angle of about 54° with respect to the radio axis). At intermediate redshifts, Lacy et al. (1999) found significant alignment of a low-radio-luminosity sample of FR II radio galaxies at with the radio axis; in many cases this alignment was clearly due to stellar emission rather than to AGN-related emission. At high redshifts, Zirm et al. (2003) find evidence for significant alignment of the rest-frame optical host galaxies in their -band NICMOS study of a sample of 3C –2 radio galaxies, including 3C 280. (Of this sample of 9 objects, 3C 280 exhibited the closest alignment to the radio axis, so it may indeed simply be an unusual example). However, careful studies of dust disks (often assumed to be perpendicular to the rotation axis of a galaxy) and major axes of low- 3C host galaxies using the HST 3C snapshot survey have shown no preferential alignment or misalignment of the disk with respect to the jet axis in FR II sources (de Koff et al., 2000), especially if corrected for the three-dimensional orientation of the jets (Schmitt et al., 2002). Thus the evidence is mixed, although there is sufficient cause to believe that the effect might be real to justify some speculation on how it might have come about.
In order to produce an alignment between the large-scale stellar distribution, there must be some mechanism that would coordinate the alignment of the rotation axis of the central black hole with the formation of the spheroid. The relation between black-hole mass and the mass of the spheroid (Ferrarese & Merritt, 2000; Gebhardt et al., 2000; Tremaine et al., 2002) demonstrates that it is likely that the formation of these two components is closely coupled, although it seems far easier to imagine mechanisms for obtaining simply the mass correlation than ones that give both the mass correlation and a preferential alignment between the black-hole axis and the morphology of the spheroid. Under the standard cold dark matter (CDM) scenario, elliptical galaxies are formed from successive mergers of smaller units. Nevertheless, they cannot be too small without running afoul of the well-known color (i.e., metallicity)—luminosity relation for ellipticals (Bower, Lucey, & Ellis, 1992; Ellis et al., 1996). Under this picture, they must form from a relatively small number of major mergers (e.g., Kauffmann & Charlot, 1998). It seems unlikely that, in such mergers, the rotation axis of the final central black hole (if produced mainly from successive mergers of black holes associated with the merging galaxies) will be preferentially aligned with the final stellar distribution. In fact, one would expect that typical high-angular-momentum mergers might well produce an anticorrelation.
This argument assumes that findings relevant to elliptical galaxies in general can be applied without reservation to powerful radio galaxies at high redshift. However, such objects are extremely rare: there are only about a dozen radio galaxies in the currently observable Universe with the radio power of 3C 280 or greater at redshift less than 1.5. Such rare objects may have had a special history. Furthermore, if material around the parent population of radio galaxies is preferentially distributed along the same axis as that of the stellar distribution, there will be a bias in favor of detecting radio sources for which the radio axis lies along this same direction (Eales, 1992).
If radio galaxies at high redshifts are among the precursors of the brightest cluster galaxies (BCGs) at low redshift (West, 1994), we can tap into the various arguments that the formation of BCDs has indeed differed substantially from that of other cluster galaxies (Sandage, 1976; Tremaine & Richstone, 1977; van den Bergh, 1983). In particular, West (1994) shows that the inner regions of BCGs are typically aligned with their large scale environments, and he proposes that they have been formed quite early from subgalactic clumps that have merged preferentially along the axes of dark-matter filaments. Such mergers, West argues, will tend to have low angular momentum, and they will result in prolate stellar structures in which gas will eventually settle into a disk at the center, rotating with an axis aligned with that of the stellar distribution. Under these circumstances, if the gas from this disk is being accreted onto a central black hole at a reasonable rate, the axis of the black hole will be brought into alignment with the axis of the prolate spheroid fairly quickly ( years for typical parameters; Rees 1978; Scheuer & Feiler 1996; Natarajan & Pringle 1998). Note that these arguments do not depend critically on the initial formation scenario. All we really need is (1) a stellar distribution in the form of a prolate ellipsoid, (2) sufficient gas settling into a disk at the center and forming or accreting onto a black hole, (3) enough time for the torque of the stellar mass distribution to align the axis of the disk with the axis of the galaxy, and (4) similarly, enough time for the disk to align the rotation axis of the black hole with the disk axis.
5 Summary
The key points of this paper, based on our analysis of new radio maps, optical and IR imaging data, and spectroscopy of 3C 280 are:
-
1.
We confirm the close association of the extended emission regions on the east side of 3C 280 with the eastern radio structure. These are almost certainly a result of the interaction of the radio jet and lobe material with ambient gas, even though the velocities and line widths do not show obvious kinematic signatures of such an interaction.
-
2.
The radio structure on the western side shows evidence of beamed emission, both at the base of the jet and in the strongly peaked hot spots associated with the western lobe. This beaming is consistent with previous evidence that places the western lobe nearer to us.
-
3.
The spectrum of the central component and of all of the extended emission components appear to be more consistent with photoionization by the quasar nucleus than with shock ionization, although mixed models cannot be excluded.
-
4.
In four regions the spectrum can be decomposed into various combinations of four basic components: emission lines and associated nebular thermal continuum, the old stellar population comprising the elliptical galaxy, a younger stellar population, and scattered quasar light. In particular, component shows, in addition to strong emission lines and nebular thermal continuum (and probably scattered quasar light), a stellar population Myr old. This age is difficult to reconcile with jet-induced star formation.
-
5.
The light from the arc appears to be strongly dominated by gaseous emission, with little or no light from stars and little, if any, scattered quasar light. We have not been able to resolve the physical origin of the arc morphology—the most plausible alternatives are that it is either a gaseous tidal tail or a shock front due to the passage of the radio jet.
-
6.
The unresolved core () in the F622W image noted by RS97 can be identified with a quasar spectral component clearly present in the central spectrum; i.e., we may have a direct view of a highly obscured quasar nucleus, or (more likely) at least of quasar light scattered from a region very close to the nucleus.
-
7.
The spheroidal distribution of old stars in 3C 280 is very well fit by an -law profile, with an effective radius of kpc. The major axis of the galaxy appears to be aligned with the radio axis to an accuracy better than 5°. If this type of close alignment is found in larger samples of objects, this result may affect our understanding of how powerful radio galaxies are formed.
References
- Best, Longair, & Röttgering (1996) Best, P.N., Longair, M.S., & Röttgering, H.J.A. 1996, MNRAS, 280, L9
- Best, Longair, & Röttgering (1998) Best, P.N., Longair, M.S., & Röttgering, H.J.A. 1998, MNRAS, 295, 549
- Best, Röttgering, & Longair (2000a) Best, P.N., Röttgering, H.J.A., & Longair, M.S. 2000, MNRAS, 311, 1
- Best, Röttgering, & Longair (2000b) Best, P.N., Röttgering, H.J.A., & Longair, M.S. 2000, MNRAS, 311, 23
- Bithell & Rees (1990) Bithell, M., & Rees, M. J. 1990, MNRAS, 242, 570
- Bower, Lucey, & Ellis (1992) Bower, R. G., Lucey, J. R., & Ellis, R. S. 1992, MNRAS, 254, 601
- Bruzual & Charlot (1996) Bruzual, G., & Charlot, S. 1996, unpublished
- Cabrera-Guerra et al. (1996) Cabrera-Guerra, F., Pirez-Fournon, I., Acosta-Pulido, J., Wilson, A., Tsvetanov, Z. 1996, in Cygnus A: Study of a Radio Galaxy, eds. C.L. Carilli and D.E. Harris (Cambridge: CUP), p. 23.
- Chambers, Miley, & van Breugel (1987) Chambers, K.C., Miley, G., & van Breugel, W. 1987, Nature, 329, 609
- Cimatti et al. (1996) Cimatti, A., Dey, A., van Breugel, W., Antonucci, R., & Spinrad, H. 1996, ApJ, 465, 145
- Cimatti et al. (1997) Cimatti, A., Dey, A., van Breugel, W., Hurt, T., & Antonucci, R. 1997, ApJ, 476, 677
- Crane et al. (1993) Crane, P. et al. 1993, ApJ, 402, L37
- de Koff et al. (2000) de Koff, S., et al.2000, ApJS, 129, 33
- Dey et al. (1997) Dey, A., van Breugel, W., Vacca, W. D., & Antonucci, R. 1997, ApJ, 490, 698
- Dey & Spinrad (1996) Dey, A., & Spinrad, H. 1996, ApJ, 459, 133
- Dickinson, Dey, & Spinrad (1995) Dickinson, M., Dey, A., & Spinrad, H. 1995, in Galaxies in the Young Universe, ed. H. Hippelein (Springer-Verlag, Heidelberg), p. 164
- Dickson et al. (1995) Dickson, R., Tadhunter, C., Shaw, M., Clark, N., & Morganti, R. 1995, MNRAS, 273, L29
- Dopita & Sutherland (1996) Dopita, M. A. & Sutherland, R. S. 1996, ApJS, 102, 161
- Donahue, Daly, & Horner (2003) Donahue, M., Daly, R. A., & Horner, D. J. 2003, ApJ, 584, 643
- Eales (1992) Eales, S. A. 1992, ApJ, 397, 49
- Ellis et al. (1996) Ellis, R. S., Colless, M., Broadhurst, T., Heyl, J., & Glazebrook, K. 1996, MNRAS, 280, 235
- Ferrarese & Merritt (2000) Ferrarese, L., & Merritt, D. 2000, ApJ, 539, L9
- Fioc & Rocca-Volmerange (1997) Fioc, M., & Rocca-Volmerange, B. 1997, A&A, 326, 950
- Francis et al. (1991) Francis, P. J., Hewett, P. C., Foltz, C. B., Chaffee, F. H., & Weymann, R. J. 1991, ApJ, 373, 465
- Gebhardt et al. (2000) Gebhardt, K., et al. 2000, ApJ, 539, L13
- Jackson et al. (1994) Jackson, N., Sparks, W.B., Miley, G.K., Macchetto, F. 1994, A&A, 284, 65
- Jorgensen, Franx, & Kjaergaard (1995) Jorgensen, I., Franx, M., & Kjaergaard, P. 1995, MNRAS, 276, 1341
- Kauffmann & Charlot (1998) Kauffmann, G., & Charlot, S. 1998, MNRAS, 294, 705
- Kormendy & Illingworth (1982) Kormendy, J. & Illingworth, G. 1982, ApJ, 256, 460
- Lacy & Rawlings (1994) Lacy, M. & Rawlings, S. 1994, MNRAS, 270, 431
- Lacy et al. (1999) Lacy, M., Ridgway, S. E., Wold, M., Lilje, P. B., & Rawlings, S. 1999, MNRAS, 307, 420
- Lacy et al. (2002) Lacy, M., et al. 2002, AJ, in press
- Leitherer et al. (1996) Leitherer, C., et al. 1996, PASP, 108, 996
- Liu & Pooley (1991) Liu, R. & Pooley, G. 1991, MNRAS, 249, 343
- Longair, Best, & Röttgering (1995) Longair, M. S., Best, P. N., & Röttgering, H. J. A. 1995, MNRAS, 275, L47
- McCarthy et al. (1987) McCarthy, P.J., van Breugel, W., Spinrad, H., & Djorgovski, S. 1987, ApJ, 321, L29
- Natarajan & Pringle (1998) Natarajan, P. & Pringle, J.E. 1998, ApJ, 506, 97
- Oke et al. (1995) Oke, J. B., et al. 1995, PASP, 107, 375
- Osterbrock (1989) Osterbrock, D. E. 1989, Astrophysics of Gaseous Nebulae and Active Galactic Nuclei (University Science Books, Mill Valley, California)
- Rees (1978) Rees, M. J. 1978, Nature, 275, 516
- Rees (1989) Rees, M. J. 1989, MNRAS, 239, 1P
- Ridgway et al. (2001) Ridgway, S. E., Heckman, T. M., Calzetti, D., & Lehnert, M. 2001, ApJ, 550, 122
- Ridgway & Stockton (1997) Ridgway, S.E., & Stockton, A. 1997, AJ, 114, 511
- Rigler et al. (1992) Rigler, M., Stockton, A., Lilly, S. J., Hammer, F., & Le Fevre, O. 1992, ApJ, 385, 61
- Roche & Eales (2000) Roche, N., & Eales, S. A. 2000, MNRAS, 317, 120
- Saikia & Kulkarni (1994) Saikia, D. J. & Kulkarni, V. K. 1994, MNRAS, 270, 897
- Sandage (1976) Sandage, A. 1976, ApJ, 205, 6
- Scheuer & Feiler (1996) Scheuer, P.A.G. & Feiler, R. 1996, MNRAS, 282, 291
- Schmitt et al. (2002) Schmitt, H. R., Pringle, J. E., Clarke, C. J., & Kinney, A. L. 2002, ApJ, 575, 150
- Solórzano-Iñarrea, Tadhunter, & Axon (2001) Solórzano-Iñarrea, C., Tadhunter, C. N., & Axon, D. J. 2001, mnras, 323, 965
- Spinrad (1982) Spinrad, H. 1982, PASP, 94, 397
- Stockton & MacKenty (1983) Stockton, A., & MacKenty, J. W. 1983, Nature, 305, 678
- Stockton & MacKenty (1987) Stockton, A., & MacKenty, J. W. 1987, ApJ, 316, 584
- Stockton, Ridgway, & Kellogg (1996) Stockton, A., Ridgway, S.E., & Kellogg, M. 1996, AJ, 112, 902
- Tadhunter et al. (1994) Tadhunter, C., Shaw, M., Clark, N. and Morganti, R. 1994, A&A, L21
- Tremaine et al. (2002) Tremaine, S. et al. 2002, ApJ, 574, 740
- Tremaine & Richstone (1977) Tremaine, S., & Richstone, D. O. 1977, ApJ, 212, 311
- van Breugel (1996) van Breugel, W.J.M. 1996, in Extragalactic Radio Sources, IAU Symp. 175, ed. R. D. Ekers, C. Fanti, & L. Padrielli (Kluwer, Dordrecht), p. 577
- van den Bergh (1983) van den Bergh, S. 1983, PASP, 95, 275
- van der Marel (1999) van der Marel, R. P. 1999, AJ, 117, 744
- Vernet et al. (2001) Vernet, J., Fosbury, R. A. E., Villar-Martín, M., Cohen, M. H., Cimatti, A., di Serego Alighieri, S., & Goodrich, R. W. 2001, A&A, 366, 7
- West (1994) West, M. J. 1994, MNRAS, 268, 79
- Wilson & Tsvetanov (1994) Wilson, A. S. & Tsvetanov, Z. I. 1994, AJ, 107, 1227
- Young et al. (2002) Young, A. J., Wilson, A. S., Terashima, Y., Arnaud, K. A., & Smith, D. A. 2002, ApJ, 564, 176
- Zheng et al. (1997) Zheng, W., Kriss, G. A, Telfer, R. C., Grimes, J. C., & Davidsen, A. F. 1997, ApJ, 475, 469
- Zirm et al. (1999) Zirm, A. et al. 1999, in The Hy-Redshift Universe: Galaxy Formation and Evolution at High Redshift, ed. A. J. Bunker & W. J. M. van Breugel, ASP Conf. Proc., 193, p. 114
- Zirm et al. (2003) Zirm, A., Dickinson, M., & Dey, A. 2003, ApJ, 585, 90
- Zirm (2003) Zirm, A. 2003, thesis. Johns Hopkins University
- Zubko & Laor (2000) Zubko, V. G., & Laor, A. 2003, ApJS, 128, 245
| Telescope | Detector | Filter | Exposure | Pixel Scale | Data Quality |
|---|---|---|---|---|---|
| CFHT | Orb2048 | 7449/31 | 4 2700 s | 0087 | 066 |
| Keck | InSb256 | 27 96 s | 015 | 058 | |
| HST | WFPC2 | F622W | 8 1100 s | 010 | 014 |
| HST | WFPC2 | F814W | 2 1100 s | 010 | 015 |
| HST | NICMOS | F160W | 5 1026 s, 300 s, 514 s | 0075 | 015 |
| Nucleus | W1 | |||||||
|---|---|---|---|---|---|---|---|---|
| Line | (Å) | FWHM (Å) | FluxaaFlux units are 10-18 erg cm-2 s-1. | EW (Å) | (Å) | FWHM(Å) | FluxaaFlux units are 10-18 erg cm-2 s-1. | EW (Å) |
| C II] | 4646.3 | 16.9 | 61.9 | 31.3 | 4644.4 | 15.2 | 39.8 | 30.8 |
| He II | 4762.4 | 13.1 | 9.5 | 4.8 | 4 | 3.2 | ||
| [Ne IV] | 4841.0 | 14.1 | 122 | 63.5 | 4838.5 | 11.9 | 87.0 | 63.2 |
| [O II] | 4935.5 | 12.4 | 12.7 | 6.5 | 4931.6 | 7.9 | 7.8 | 6.1 |
| He II | 5013.5 | 16.2 | 10.9 | 5.6 | 5013.4 | 12.5 | 9.7 | 7.7 |
| [Mg VII] | 5250.8 | 14.7 | 11.1 | 5.4 | 5245.5 | 15.4 | 10.1 | 7.6 |
| He II | 5462.1 | 21.6 | 25.8 | 12.2 | 5457.5 | 11.4 | 12.0 | 9.5 |
| [Mg V] | 5560.6 | 15.2 | 20.9 | 9.7 | 5555.1 | 7.0 | 8.4 | 6.3 |
| Mg II bbWidths set equal in deblending of Mg II ,2803. | 5585.2 | 15.2 | 110ccSum of both Mg II ,2804. | 51.4 | 5581.4 | 13.8 | 43.2 | 30.3 |
| Mg II | 5599.8 | 15.2 | .. | .. | 5596.1 | 13.8 | 34.9 | 24.5 |
| [Fe IV] | 5662.6 | 26.3 | 31.0 | 14.7 | 5658.1 | 33.9 | 21.0 | 15.5 |
| O III | 6260.7 | 18.7ddGaussian fit gives flux 37 (in these units); flux error is systematic and larger than average. | 24.9 | 11.7 | 6254.0 | 8.8 | 7.4 | 5.8 |
| He II | 6398.4 | 15.9 | 28.2 | 12.8 | 6394.5 | 11.7 | 20.4 | 15.5 |
| [Ne V] | 6683.7 | 17.9 | 68.6 | 31.3 | 6678.7 | 10.0 | 35.2 | 27.1 |
| [Ne V] | 6843.9 | 17.2 | 168 | 73.7 | 6838.5 | 10.3 | 90.0 | 65.5 |
| [Fe VII] | 7167.4 | 19.6 | 11.0 | 5.1 | ||||
| [O II] ,3729 | 7444.8 | 20.0 | 594 | 307 | 7442.0 | 16.8 | 469.1 | 355.0 |
| [Fe VII] | 7510.0 | 26.9 | 21.1 | 11.7 | 7502 | 17 | 7.2 | 5.7eeFlux and EW variations –3 and –4 respectively. |
| H10 | 7580.3 | 10.8 | 9.7 | 12.2eeFlux and EW variations –3 and –4 respectively. | ||||
| H9 | 7655.6 | 11.1 | 15.2 | 16.6 | ||||
| [Ne III] | 7728.0 | 20.9 | 247 | 122 | 7722.9 | 12.9 | 186.3 | 173.7 |
| H8 | 7767.3 | 23.2 | 42.3 | 20.8 | 7762.9 | 12.9 | 31.0ffFlux and EW variations and –10 respectively. | 26.6 |
| [Ne III] + H , | 7926.6 | 21.6 | 94.9 | 44.2 | 7922.2 | 16.8 | 95.3 | 106.5 |
| [S II] ,4076 | 8132.0 | 34.1 | 26.8 | 10.9 | 8125.6 | 21.2 | 17.1 | 14.9 |
| H | 8192.8 | 22.8 | 65.0 | 26.6 | 8188.5 | 14.1 | 55.8 | 46.3 |
| H | 8669.5 | 24.8 | 142.0 | 57.9 | 8188.5 | 14.1 | 55.8 | 46.3 |
| [O III] | 8715.2 | 28.4 | 53.2 | 21.7 | 8710.3 | 17.5 | 37.5 | 33.2 |
| Mg II absorption | 5476.4 | 4.3 | 1.4 | |||||
| Mg II absorption | 5491.0 | 3.2 | 1.3 | |||||
| Ca II absorption | 7856.2 | 36.9ggProblems with sky lines; Gaussian fit gives FWHM 28.3, EW 9.91. | 13.5 | |||||
| Component | OffsetaaOffset to the east (along slit) of center of aperture from the nucleus. Each aperture is 086 wide. | Line | (Å) | FWHM (Å) | FluxbbFlux units are 10-18 erg cm-2 s-1. | EW (Å) |
|---|---|---|---|---|---|---|
| E1a | 224 | C II] | 4644.6 | 21.2 | 19.2 | 88.9 |
| He II | 4761.8 | 9.2 | 4.3 | 17.6 | ||
| [Ne IV] | 4838.9 | 11.5 | 19.4 | 119.3 | ||
| Mg II ccWidths set equal in deblending of Mg II ,2803. | 5586.9 | 7.2 | 5.3 | 25.0 | ||
| Mg II ccWidths set equal in deblending of Mg II ,2803. | 5596.0 | 7.2 | 5.4 | 25.0 | ||
| He II | 6395.8 | 9.7 | 5.2 | 24.6 | ||
| [Ne V] | 6684.6 | 18.4 | 6.1 | 25.7 | ||
| [Ne V] | 6840.5 | 16.2 | 13.6 | 56.7 | ||
| [O II] ,3729 | 7443.6 | 15.1 | 125.0 | 473 | ||
| H9 | 7660.3 | 19.7 | 4.8 | 33.4 | ||
| [Ne III] | 7725.4 | 14.3 | 47.8 | 225 | ||
| H8 | 7767.5 | 11.8 | 8.6 | 48.4 | ||
| [Ne III] + H , | 7924.2 | 13.3 | 21.8 | 112.4 | ||
| H | 8190.3 | 14.1 | 16.7 | 76.9 | ||
| H | 8666.4 | 22.6 | 39.3 | 207.1 | ||
| E1b | 310 | C II] | 4646.2 | 13.9 | 11.7 | 91.4 |
| [Ne IV] | 4841.7 | 9.6 | 6.4 | 46.7 | ||
| Mg II ccWidths set equal in deblending of Mg II ,2803. | 5587.0 | 7.2 | 7.3 | 69.4 | ||
| Mg II ccWidths set equal in deblending of Mg II ,2803. | 5600.3 | 7.2 | 3.2 | 28.1 | ||
| [Ne V] | 6837 | 19 | 4.5 | 33 | ||
| [O II] ,3729 | 7446.1 | 15.8 | 9.7 | 833 | ||
| [Ne III] | 7727.9 | 14.1 | 26.0 | 251.0 | ||
| H8 | 7767.5 | 19.4 | 7.7 | 69.7 | ||
| [Ne III] + H , | 7928.7 | 13.5 | 10.2 | 127 | ||
| H | 8196.1 | 13.2 | 9.9 | 151 | ||
| H | 8665.6 | 21.9 | 15.1 | 73ddH region very noisy in E1B, poor continuum determination. | ||
| E1c | 396 | C II] | 4649.1 | 13.1 | 10.4 | 150 |
| [Ne IV] | 4842.3 | 10.5 | 4.7 | 70.4 | ||
| Mg II ccWidths set equal in deblending of Mg II ,2803. | 5588.0 | 7.7 | 5.0 | 75.9 | ||
| Mg II ccWidths set equal in deblending of Mg II ,2803. | 5601.8 | 7.7 | 4.1 | 60.8 | ||
| [O II] ,3729 | 7449.8 | 18.8 | 79.6 | 2206 | ||
| [Ne III] | 7733.3 | 17 | 10.3 | 140 | ||
| [Ne III] + H , | 7932.6 | 11.4 | 6.9 | 391 | ||
| E2a | 510 | C II] | 4652.9 | 11.4 | 13.4 | 172 |
| He II | 4765.7 | 7.8 | 3.9 | 49 | ||
| Mg II | 5591.3 | 10.3 | 13.8 | 144 | ||
| Mg II | 5606.9 | 9.9 | 8.9 | 95 | ||
| [Ne V] | 6849.8 | 10.2 | 3.3 | 29.5 | ||
| [O II] ,3729 | 7456.0 | 14.5 | 135.3 | 1848 | ||
| H9 eeIn E2A, H8 and H9 are detected, but because the continuum is uncertain, they are fit together with [Ne III] , yielding upper limits to the fluxes. | 7674.3 | 14.6 | 3.8 | 71 | ||
| [Ne III] eeIn E2A, H8 and H9 are detected, but because the continuum is uncertain, they are fit together with [Ne III] , yielding upper limits to the fluxes. | 7737.6 | 13.6 | 17.4 | 205 | ||
| H8 eeIn E2A, H8 and H9 are detected, but because the continuum is uncertain, they are fit together with [Ne III] , yielding upper limits to the fluxes. | 7780.5 | 14.6 | 3.6 | 55 | ||
| [Ne III] + H , | 7938.2 | 19.0 | 12.2 | 192 | ||
| H | 8202.2 | 11.7 | 6.8 | 45 | ||
| H | 8680.3 | 12.0 | 11.3 | 102 | ||
| E2b | 611 | C II] | 4654.3 | 18 | 7.8 | 86 |
| [Ne IV] | 4841.4 | 18 | 6.1 | 78 | ||
| Mg II ccWidths set equal in deblending of Mg II ,2803. | 5591.1 | 5.4 | 2.9 | 22 | ||
| Mg II ccWidths set equal in deblending of Mg II ,2803. | 5606.4 | 5.4 | 2.8 | 29 | ||
| [Ne V] | 6847.5 | 9.2 | 4.3 | 83 | ||
| [O II] ,3729 | 7455.5 | 14.3 | 53.6 | 1400 | ||
| [Ne III] | 7735.9 | 19.9 | 8.0 | 137 |
| Component | Line | (Å) | FluxaaFlux units are erg cm-2 s-1. | FWHM(Å) |
|---|---|---|---|---|
| Central | [O III]5007 | 9989.6 | 4.46 | 20.3 |
| Central | [O III]4959 | 9889.1 | 1.39 | 26.8 |
| Central | H | 9709.8 | 1.47 | 37.3 |
| Central | H | 13105 | 1.96 | 32 |
| W | [O III]5007 | 9990.5 | 2.69 | 18.9 |
| W | H | 9715.4 | 1.29 | 38.6 |
| E1 | [O III]5007 | 9992.0 | 2.18 | 26.8 |
| E2 | [O III]5007 | 10004.5 | 0.63 | 6.0 |