Kinematics and binaries in young stellar aggregates.
II. NGC 6913M29
Between 1996 and 2003 we have obtained 226 high resolution spectra of 16 stars in the field of the young open cluster NGC 6913, to the aim of constraining its main properties and study its internal kinematics. Twelve of the program stars turned out to be members, one of them probably unbound. Nine are binaries (one eclipsing and another double lined) and for seven of them the observations allowed to derive the orbital elements. All but two of the nine discovered binaries are cluster members. In spite of the young age (a few Myr), the cluster already shows signs that could be interpreted as evidence of dynamical relaxation and mass segregation. However, they may be also the result of an unconventional formation scenario. The dynamical (virial) mass as estimated from the radial velocity dispersion is larger than the cluster luminous mass, which may be explained by a combination of the optically thick interstellar cloud that occults part of the cluster, the unbound state or undetected very wide binary orbit of some of the members that inflate the velocity dispersion and a high inclination for the axis of a possible cluster angular momentum. All discovered binaries are hard enough to survive average close encounters within the cluster and do not yet show sign of relaxation of the orbital elements to values typical of field binaries.
Key Words.:
Binaries: spectroscopic – Stars: early type – ISM: bubbles – Open clusters and associations: general – Open clusters and associations: individual (NGC 6913)1 Introduction
This is the second paper of a series devoted to the results of a long term, high resolution spectroscopic study of early type members of young open clusters, trapezium systems and OB associations. The aims of this series are discussed in Paper I (Munari and Tomasella 1999).
NGC 6913, the topic of this paper, is a young open cluster harboring O-type members and lying close to the plane of the Galaxy (, (J2000); , ). Despite appearing in the Messier catalog as M29, few papers in literature deal with it, furthermore showing some disagreement in the results. Cluster distance is reported to be 2.2 kpc by Morgan and Harris (morgan_harris (1956)) and Massey et al. (massey (1995)), 1.5 kpc by Joshi et al. (joshi (1983)), and 1.1 kpc by Hoag et al. (hoag (1961)), while Tifft (tifft (1958)) suggested that NGC 6913 is indeed the results of two separate groups of stars, one at 1.6 kpc and the other somewhere between 1.9 and 2.4 kpc. The mean and differential reddening span a range of values too: 0.78, =0.64 according to Joshi et al. (joshi (1983)), =0.71 and =1.82 for Wang and Hu (wang (2000)), and =1.03 following Massey et al. (massey (1995)). Similarly, estimated ages span from 0.31.75 Myr of Joshi et al. (joshi (1983)) to 10 Myr of Lyngå (linga (1987)).
The internal and galactic kinematics of NGC 6913 has not been so far investigated in literature. The cluster radial velocity used by Hron (1987) in modeling the rotation curve of the Galaxy, 25 km sec-1, was assembled by scanty literature data that apparently missed all brightest cluster members, and is largely off our much more accurate and representative 16.9(0.6) km sec-1 value (see sect. 3.2). Internal kinematics and binary content of NGC 6913 are unknown because no detailed radial velocity study of its members has been ever pursued, and proper motions investigations (Sanders sanders (1973), Dias et al. dias (2002)) are not deep and accurate enough for a firm membership segregation over a wide range of magnitudes, do not cover all candidate members and do not allow resolution of the internal kinematics.
In this paper we aim to look in more details to NGC 6913 general properties (like astrometric membership, photometry, reddening, distance, mass and age) and to present and discuss the results of our extensive spectroscopic study of NGC 6913 based on 226 high resolution spectra monitoring of 16 stars in the field of the cluster over the time span 1996-2003. These observations are used to constrain the internal velocity dispersion, the cluster galactic motion, the individual rotational velocities, and the internal kinematical and evolutionary status of the cluster. Spectroscopic orbits are calculated for the discovered binary stars.
| # | H61 | S73 | KJ86 | HD | HIP/TYC | notes | |||
|---|---|---|---|---|---|---|---|---|---|
| 1 | 1 | 135 | 125 | 194378 | HIP 100586 | 8.603 | 0.431 | +0.07 | V2031 Cyg |
| 2 | 2 | 159 | 145 | 229239 | HIP 100612 | 9.035 | 0.730 | –0.14 | |
| 3 | 3 | 157 | 144 | 229238 | TYC 3152 1325 1 | 8.935 | 0.801 | –0.07 | |
| 4 | 4 | 149 | 138 | 229234 | TYC 3152 1369 1 | 8.979 | 0.638 | –0.20 | |
| 5 | 5 | 125 | 118 | 229221 | TYC 3152 1451 1 | 9.260 | 0.767 | –0.25 | V1322 Cyg |
| 6 | 6 | 139 | 127 | 229227 | HIP 100600 | 9.419 | 0.632 | –0.18 | |
| 7 | 7 | 174 | 156 | 229253 | TYC 3152 236 1 | 10.171 | 0.099 | –0.31 | |
| 8 | 8 | 147 | 136 | TYC 3152 1309 1 | 10.388 | 0.733 | –0.17 | ||
| 9 | 9 | 146 | 134 | 229233 | TYC 3152 1137 1 | 10.494 | 0.346 | +0.02 | |
| 10 | 10 | 182 | 162 | 229261 | TYC 3152 1415 1 | 10.510 | 0.252 | –0.31 | var |
| 11 | 11 | 178 | 158 | TYC 3152 1019 1 | 11.307 | 0.518 | +0.26 | ||
| 12 | 12 | 122 | 115 | TYC 3152 676 1 | 12.091 | 0.025 | –0.06 | ||
| 13 | 13 | 167 | 150 | TYC 3152 1467 1 | 11.692 | 0.862 | +0.83 | ||
| 14 | 14 | 148 | 137 | TYC 3152 1423 1 | 11.552 | 0.426 | +0.04 | ||
| 15 | 143 | 132 | TYC 3152 54 1 | 11.534 | 1.120 | +0.28 | |||
| 16 | 103 | TYC 3152 1453 1 | 10.983 | 0.528 | –0.30 |
2 Spectroscopic observations
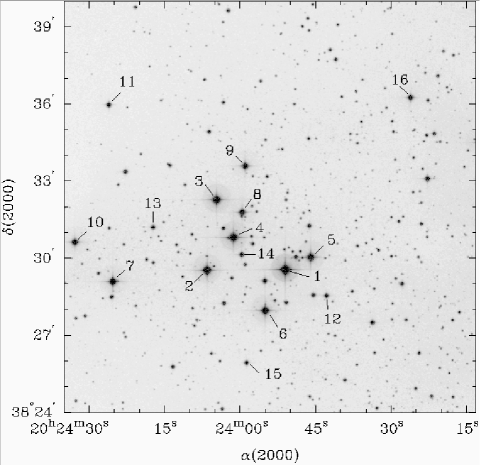
Table 1 summarizes the main properties of the 16 selected program stars, and Figure 1 provides a finding chart for them. The program stars have been spectroscopically observed over the period 1996-2003 with the 1.82 cm telescope and Echelle+CCD spectrograph of the Astronomical Observatory of Padova at Asiago (Italy). Table 2 provides the journal of observations. The instrumental set-up, spectra extraction and calibration, accuracies, etc. are identical to Paper I and the reader is referred to it for details.
2.1 Spectral classification and radial velocities
Scanty information exists on the spectral classification of the program stars. Wang and Hu (wang (2000)) derived spectral types from low resolution spectra (5.3 Å/pix) covering the range 4200-6900 Å. Kazlauskas and Jasevicius (1986) obtained photoelectric photometry in the Vilnius system, that we have converted into spectral types using the reddening free color parameters defined by Strayžis (1977) appropriate for the = =3.6 reddening law that applies to NGC 6913 according to Johnson (1962). We have also derived spectral classification of the program stars using our Echelle spectra, classified against the Yamashita et al. (1977) spectral atlas. Even if spectral classification of Echelle spectra has to be carried out with care (lines to be compared normally fall on different Echelle orders), nevertheless the resulting spectral types look quite reasonable, and, given the far superior spectral resolution and high S/N, also possibly more accurate than those of Wang and Hu (wang (2000)). The three estimates of the spectral type are compared in Table 3. The last two columns of the table give the reddening and distance when Fitzgerald (1970) intrinsic colors and our spectral classification are compared to , photometry in Table 1. The positions of the program stars on the reddening corrected HR diagram are shown in Figure 2.
| date | D | (Å) | star # |
|---|---|---|---|
| 1996.06.28 | 0.38 | 4100-6700 | 1,2,4,5,6,7,10,12,14 |
| 1996.06.29 | 0.38 | 4100-6700 | 3,8,9,11,13 |
| 1996.08.01 | 0.38 | 4100-6700 | 1,2,3,4,8,9 |
| 1996.08.02 | 0.38 | 4100-6700 | 5,6,10,11,12 |
| 1996.08.03 | 0.38 | 4100-6700 | 1,2,3,4,5,8,9 |
| 1996.08.04 | 0.38 | 4100-6700 | 6,10,11,12 |
| 1996.08.20 | 0.38 | 4100-6700 | 3,6,7,10,11 |
| 1996.08.21 | 0.38 | 4100-6700 | 1,2,4,5,8,9,12 |
| 1996.08.28 | 0.38 | 4100-6700 | 1,2,4,5,6,12 |
| 1996.08.29 | 0.38 | 4100-6700 | 3,7,8,9,10,11,13,14 |
| 1996.09.06 | 0.38 | 4100-6700 | 1,2,3,4,5,6,7,8,9,12,14 |
| 1996.09.07 | 0.38 | 4100-6700 | 5,10,13 |
| 1997.07.25 | 0.38 | 4100-6700 | 1,5 |
| 1997.07.26 | 0.38 | 4100-6700 | 2,3,4,6,7,8,9,10,11,12 |
| 1997.07.29 | 0.38 | 4100-6700 | 13,14 |
| 1997.07.30 | 0.38 | 4100-6700 | 11 |
| 1997.08.10 | 0.38 | 4100-6700 | 2,3,4,7,8,9,10 |
| 1997.08.11 | 0.38 | 4100-6700 | 1,5,6,11 |
| 1997.08.12 | 0.38 | 4100-6700 | 12 |
| 1997.08.13 | 0.38 | 4100-6700 | 1,4,7,11,12 |
| 1997.08.14 | 0.38 | 4100-6700 | 1,4,7,11,12 |
| 1997.08.15 | 0.38 | 4100-6700 | 11 |
| 1998.09.09 | 0.38 | 4500-9500 | 1,4,7,12 |
| 2000.09.12 | 0.38 | 4500-9500 | 2,3,6,8,13,14 |
| 2000.09.13 | 0.38 | 4500-9500 | 2,3,6,8,13,14 |
| 2000.09.14 | 0.38 | 4500-9500 | 2,3,6,8 |
| 2000.09.16 | 0.38 | 4500-9500 | 2,3,4,5,6,13,14 |
| 2000.09.17 | 0.38 | 4500-9500 | 1,2,6,7,14 |
| 2001.07.27 | 0.19 | 4500-9500 | 2,3,4,7,10 |
| 2001.07.27 | 0.38 | 4500-9500 | 6 |
| 2001.07.28 | 0.38 | 4500-9500 | 7,10,15 |
| 2001.07.28 | 0.19 | 4500-9500 | 2,3,4,6 |
| 2001.07.29 | 0.19 | 4500-9500 | 2,3,4,6 |
| 2001.07.29 | 0.38 | 4500-9500 | 7,15 |
| 2001.07.29 | 0.19 | 4500-9500 | 2,3,4,6 |
| 2001.07.30 | 0.19 | 4500-9500 | 1 |
| 2001.09.09 | 0.38 | 4500-9500 | 11,12 |
| 2001.09.09 | 0.19 | 4500-9500 | 1 |
| 2001.10.29 | 0.19 | 4500-9500 | 1,2,3,4 |
| 2001.11.02 | 0.19 | 4500-9500 | 1,4,6 |
| 2001.11.29 | 0.19 | 4500-9500 | 2,3 |
| 2001.11.30 | 0.19 | 4500-9500 | 1,3,7,10 |
| 2001.12.28 | 0.38 | 4500-9500 | 3,7,15,16 |
| 2002.01.02 | 0.38 | 4500-9500 | 7,15 |
| 2002.01.03 | 0.38 | 4500-9500 | 16 |
| 2002.01.04 | 0.38 | 4500-9500 | 3,7,16 |
| 2002.01.06 | 0.38 | 4500-9500 | 15,16 |
| 2003.05.21 | 0.19 | 4500-9500 | 1,5,16 |
| 2003.05.22 | 0.19 | 4500-9500 | 16 |
Radial velocities from individual observations (hereafter referred to as epoch radial velocities) of the program stars are given in Table 4. For O and B type program stars they rest on individual measurement of HeI and HeII lines. For the other, cooler program stars the radial velocities come from measurement of the metallic absorptions lines (mainly Fe I, Mg I, Ti II). The radial velocities of the Be program star #5 pertain to the emission lines, which completely fill helium and hydrogen absorption lines.

2.2 Binaries and orbital solutions
About half of the program stars have turned out to be spectroscopic binaries. Table 5 summarizes the barycentric velocity, the membership and the binary status based on epoch radial velocities in Table 4. Table 6 gives the spectroscopic orbits computed for all the binary stars but #6 and 16, which are clearly binaries but the available radial velocities are not enough to determine the orbital period and thus to allow to derive an orbital solution. Therefore the RV⊙ quoted for stars #6 and 16 in Table 5 is the mean of the measurements, not the barycentric velocity, and the two velocities tend to differ with increasing eccentricity and paucity of measurements. Consequently, the RV⊙ of stars #6 and 16 quoted in Table 5 which differ by slightly more than 3 from the cluster mean velocity cannot be considered as a firm indication that stars #6 and 16 are field stars.
Similarly to Paper I, the spectroscopic orbits have been obtained with a Fortran code written by Roger F. Griffin (Cambridge University) and adapted to run under GNU/Linux by us.
Program stars #1–7 have been observed also by Liu et al. (liu89 (1989), liu91 (1991)) who reported some epoch radial velocities for them. Such data appear affected by large errors for the O and B stars (program stars #2–7), which make them useless in our analysis. They are instead in good agreement with our velocities for star #1, much cooler having a spectral type F0 III. The reason for the poor quality of the Liu et al. radial velocities of hot stars probably lies in the shortness of the wavelength range they observed (150 Å) and by the fact that it is dominated by H, which we ignored in our analysis given the Balmer progression and its excessive scatter compared to the much more performing HeI and HeII lines. It is also worth noticing that Liu et al. did not recognized star #7 as double lined, in spite having observed it at orbital phase 0.66 when the velocity separation between the components is 140 km sec-1 (cf. Figure 3) and therefore outstanding.
The spectroscopic orbits of stars #2 and 11 in Figure 3 and Table 6 are to be considered quite preliminary, given their small amplitude, high eccentricity and limited number of observations. Further observations are obviously encouraged for these two stars. Photometric observations of the double lined star #7 are in progress to the aim of constraining the orbital inclination and derive individual masses, and they will reported elsewhere when completed.
| spectral type | |||||
|---|---|---|---|---|---|
| # | WH00 | Vilnius | our | d (kpc) | |
| 1 | F0 III | F1 V | F0 III | 0.11 | 0.2 |
| 2 | B0 I | B1 Ia | B0 I | 0.97 | 2.0 |
| 3 | B0 I | B1 Ia | B0 I/II | 1.06 | 1.4 |
| 4 | O7 II | B1 Ia | O9 Ib | 0.92 | 2.3 |
| 5 | B0 IIIe | B0 IIIe | 1.07 | 1.2 | |
| 6 | B0 II | B2 Ia | B0 V | 0.93 | 1.1 |
| 7 | B4 II | B3 V | B5 IV | 0.26 | 1.6 |
| 8 | B0 III | B0 III | B0 Ib/II | 0.99 | 3.0 |
| 9 | A4 V | F0 V | A4 V | 0.23 | 0.3 |
| 10 | B6 II | B2 V | B5 V/IV | 0.41 | 1.2 |
| 11 | A5 V | A5 III/II | 0.39 | 1.9 | |
| 12 | B2 V | B2 V | 0.26 | 5.3 | |
| 13 | G6 III | G5 III | 0.00 | 1.1 | |
| 14 | A8 II | A4 V | F7 IV | 0.00 | 0.7 |
| 15 | B1 II | B3 Ib | B1 III | 1.38 | 1.6 |
| 16 | B1 II | B0 V | 0.83 | 2.8 | |
| # 5 | ||
|---|---|---|
| HJD | RV⊙ | err |
| 50263.424 | 19.8 | 1.5 |
| 50296.514 | 19.5 | 1.2 |
| 50299.487 | 18.1 | 0.9 |
| 50316.566 | 18.8 | 0.9 |
| 50324.479 | 19.3 | 0.9 |
| 50333.434 | 19.8 | 0.9 |
| 50333.559 | 19.8 | 0.9 |
| 50655.500 | 20.5 | 0.9 |
| 50671.566 | 19.9 | 1.7 |
| 51895.302 | 26.3 | 0.9 |
| 52781.402 | 18.9 | 1.0 |
2.3 Rotation velocities
Rotational velocities for the program stars are given in Table 5. They have been derived from HeI lines for stars #2, 3, 4, 6, 7, 8, 10, 12, 15, 16 and FeI lines for the remaining ones, following the numerical relations for the Asiago Echelle spectrograph calibrated in Paper I (its Figure 7). No rotation velocity is derived for the Be program star #5 because all HeI lines are badly affected by emissions. The correspondence of the rotational velocity scale between HeI and FeI lines (which we have been forced to used in all program stars with a spectral type later than B) has been carefully checked on a grid of Kurucz rotationally broadened spectra we have calculated on purpose.
From the spectral classification in Table 3, the stellar radii over the HR diagram as tabulated by Straižys and Kuriliene (1981) and the observed projected rotation velocity, we have derived in the last column of Table 5 the projected rotation period (/) for the binaries with an orbital solution in Table 6. The projected rotation period is obviously an upper limit to the true rotation period. Compared to the orbital period in Table 6, it can be used to infer about the co-rotation status of the binaries.
Star #1 is an SB1 eclipsing binary and therefore the projection factor converge toward unity, which allows a direct comparison between rotation and orbital periods, the former being twice longer. The lack of synchronicity could be related to the primary evolving away from the main sequence and the time scales of the two processes.

| # | RV⊙ | binary | member | V | Prot/ |
|---|---|---|---|---|---|
| (km s-1) | (km s-1) | (days) | |||
| 1 | +8.60.5 | yes | no | 261 | 5.0 |
| 2 | –176 | yes | yes | 1283 | 10 |
| 3 | –18.50.6 | yes | yes | 842 | 15 |
| 4 | –15.00.6 | yes | yes | 1032 | 10 |
| 5 | –19.40.3 | no | yes | ||
| 6 | –25.60.9 | yes | (yes) | 2535 | |
| 7 | –183 | yes | yes | 465 | 3.8 |
| 8 | –15.50.4 | no | yes | 672 | |
| 9 | –5.6 0.5 | no | no | 222 | |
| 10 | –14.80.7 | no | yes | 647 | |
| 11 | 03 | yes | no | 416 | 11 |
| 12 | –176 | yes | yes | 1657 | 1.5 |
| 13 | –14.60.2 | no | yes | 02 | |
| 14 | –19.90.4 | no | yes | 113 | |
| 15 | –162 | no | yes | 1154 | |
| 16 | –274 | yes | (yes) | 32520 |
Given the masses estimated from the spectral type and the amplitude of radial velocity variation, star #7 probably has a high inclination too, possibly being eclipsing itself. The rotational velocity in Table 5 pertains to the B5 IV primary, the measurement of the secondary being too uncertain given the difference in brightness. The rotation and orbital periods are quite close, and in view of the uncertainties at play, the primary in star #7 looks synchronized.
Stars #3 and 12 are evidently not co-rotating, because the projected rotation period is at least several times shorter than the orbital period in Table 6, and working on can only enlarge the difference. For the remaining binary stars #2, 4 and 11, no conclusion can be drawn about the co-rotation status, the projected rotation period being longer than the orbital one.
2.4 Cluster membership
Sanders (sanders (1973), hereafter S73) has published an astrometric investigation of 228 stars in the field of NGC 6913, identifying 92 possible members. He has however used only one plate pair, with an epoch separation of just 22 yr, with moreover the first epoch plate “severely blackened by the moon”. Consequently, noting the too large fraction of detected members among the measured stars, he warned that the cluster separation from the field is not satisfactory, and that the member/non-member status he assigned may be frequently in error. S73 limiting magnitude is =13.8, with a completness limit not fainter than =13.0 that corresponds to 1.2 M⊙ on the main sequence of NGC 6913. Dias et al. (dias (2002), hereafter D02) have used proper motions from the Tycho-2 catalog to accomplish the astrometric member segregation, following the analytical approach of Sanders (1971). They have in common 24 stars with S73. As Figure 4 shows, for 6 of the 24 common stars the membership status of S73 and D02 are in disagreement, and for the remaining 18 there is a fair agreement.
| orb. element | program star # | |||||||
|---|---|---|---|---|---|---|---|---|
| 1 | 2 | 3 | 4 | 7 | 11 | 12 | ||
| P | (days) | 2.70466(1) | 1.7075(1) | 697(7) | 3.51042(5) | 3.4588(1) | 1.56842(4) | 4.0350(5) |
| e | 0.0 | 0.8(7) | 0.21(5) | 0.0 | 0.35(2) | 0.4(2) | 0.13(9) | |
| K | (km sec-1) | 60.1(7) | 26(6) | 13.5(6) | 50.9(8) | 87(2), 125(5) | 16(5) | 79(6) |
| (km sec-1) | +8.6(5) | –17(6) | –18.5(6) | –15.0(6) | –18(3) | 0(3) | –17(6) | |
| T0 | (+2450000) | 1132.626(4) | 1362.2(1) | 652(25) | 892.40(1) | 923.96(6) | 782.3(1) | 668.7(3) |
| (deg) | 0.0 | 187(14) | 134(12) | 0.0 | 282(7) | 283(49) | 344(26) | |
| a | (106 km) | 2.24(2) | 0.4(17) | 126(6) | 2.45(4) | 3.84(9) | 0.3(1) | 4.3(3) |
| f(m) | 0.061(2) | 0.001(9) | 0.16(2) | 0.048(2) | 0.19(1) | 0.0005(5) | 0.20(4) | |
| r.m.s. | (km sec-1) | 1.41 | 1.09 | 1.36 | 1.72 | 1.57 | 1.49 | 1.57 |
A firm membership segregation is required for any kinematical investigation of the cluster, and to achieve the best possible result, the astrometric data should be complemented by radial velocities and placing of the program stars on the HR diagram.
The radial velocity distribution of the program stars is presented in Figure 5, where the cluster grouping at 16.9 km sec-1 is evident, with a dispersion of =2.0 km sec-1.
Table 7 summarizes the membership status according to the astrometric investigations of S73 and D02, the photometry presented and discussed by Crawford et al. (1977) and Joshi et al. (1983), the spectral classification of Wang and Hu (2000), our reddening free HR diagram of Figure 2 and the radial velocities in Table 5. Their combination provide our final, adopted membership reported in the last column of Table 7.


3 Internal kinematic of NGC 6913
3.1 A foreground cloud hiding part of the cluster
As reviewed in the Introduction, all previous investigations of NGC 6913 agree on the large differential and total reddening affecting the cluster. Inspecting the Palomar charts it is evident how NGC 6913 lies close to a very thick interstellar cloud that seem to hide part of it.
Our and literature estimates about the cluster distance converge toward a 1.6 kpc value. Studies of the interstellar extinction toward NGC 6913 (Crawford et al. 1977, Neckle and Klare 1980) agree on a steep increase of the extinction at 1 kpc, about halfway the distance to the cluster, as if a single, major cloud is responsible for the majority of the extinction all the way to NGC 6913.
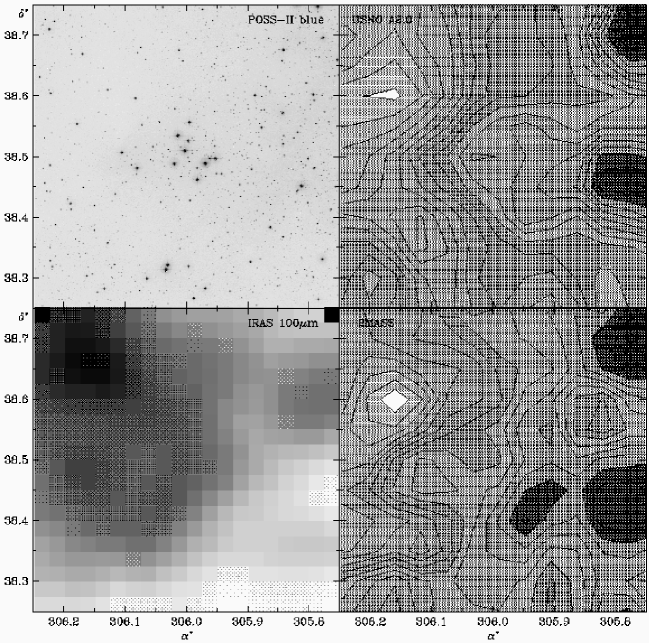
In Figure 6 we compare the same field centered on NGC 6913 as seen on Palomar POSS-II blue charts and by IRAS satellite at 100 m. The north-east quadrant is clearly deprived of stars in the optical image, while it is bright in the far infrared, a clear sign of thick dust absorbing in the optical and emitting in the IR. Star counts from USNO-A2.0 (stars detected in both blue and red POSS-I prints) and near-infrared 2MASS survey (stars detected both in as well as and bands) strongly support the argument of a strong foreground interstellar extinction crossing the field of NGC 6913 and increasing steeply toward the north-east quadrant.
We expect this foreground optically thick cloud to hide from view part of the cluster, even if the cluster center seems confidently identifiable with the grouping of the massive O and B stars seen in the optical.
3.2 Cluster mass
There are no published estimates of the NGC 6913 total mass. Two static approaches are considered in this subsection, a dynamical one is investigated in sect. 3.4.
A lower limit to the cluster mass is obtained by adding the mass appropriate to the spectral type of known members (luminous mass). Taking Wang and Hu (2000) spectral types of all S73 probable members classified by them and calibration into masses from Straižys and Kuriliene (1981), it results
| (1) |
S73 warned that a sizeable fraction of his members could be spurious. We assume here that they compensate for those fainter than the S73 completness magnitude, and therefore 700 M⊙ is taken as a fair indication of the total luminous mass of the cluster.
Assuming that the members of NGC 6913 distribute according to the Salpeter (1955) law offers another possibility to estimate the cluster mass. It seems fair to assume that all O and B type cluster members have been detected and recognized as such in the Wang and Hu (2000) spectral survey of NGC 6913. They are 31 in total, spanning the range between 6 and 67 . This allows to estimate the constant
| (2) |
which provides an initial total stellar mass for the cluster amounting to
| (3) |
distributed in about member stars. This is an upper limit to current cluster mass, because () stars became unbound early in the cluster evolution when it started to lose gaseous mass blowed away by the energetic winds of the first massive stars that formed, () the relaxation mechanism leads to evaporation of the lighter members, and () the mass function appears to flatten toward lower masses (cf. Briceño et al. 2002). The Salpeter’s and observed mass functions are compared in Figure 7. In sect.3.5 and Figure 8 will later show how there are possible evidences that the cluster is at least partially relaxed. Supposing that the associated evaporation of members affects stars fainter than S73 completness magnitude, it is found that
| (4) |
distributed in 350 members, comparable to the luminous mass in Eq.(1).
3.3 Tidal and half-mass radii
Cluster member venturing on orbits wider than the cluster tidal radius have a fair chance to become unbound due to the action of the gravitational field of the Galaxy. The cluster tidal radius is defined as (cf. Binney and Tremaine 1987):
| (5) |
where , are the radius of the cluster galactic orbit and the galactic mass contained within (=8.3 kpc and =9.5 1010 M⊙). Inserting Mcl=700 M⊙ provides R 10 pc, corresponding to 20′ at the estimated 1.6 kpc cluster distance. On photographs, the cluster tidal radius is conventionally taken as the distance from the cluster center at which the stellar density drop to field value, estimated by Lyngå (1987) to be for NGC 6913, which corresponds to 4.7 pc at the cluster adopted 1.6 kpc distance. For Rt=4.7 pc Eq.(5) would provide a much lighter cluster mass, Mcl=50 M⊙. Eq.(5) describes a statistical relation of equilibrium between cluster and galactic potentials that can be realized only on times scales long enough for perturbation fluctuations to average. Given the very young age of NGC 6913 (corresponding to just 2% of its galactic orbital period), the conditions supporting Eq.(5) can hardly be matched, and a Mcl estimated via Eq.(5) cannot be trusted. For the same reasons, the estimated from star counts has to be preferred to the value estimated using Eq.(5).
| astrom. | photom. | spctr | ours | ||||||
|---|---|---|---|---|---|---|---|---|---|
| # | S73 D02 | C77 J83 | W00 | dist. rv | |||||
| 1 | y n | n n | n | n n | N | ||||
| 2 | y y | y y | y | y y | Y | ||||
| 3 | y y | y y | y | y y | Y | ||||
| 4 | y y | y y | y | y y | Y | ||||
| 5 | y y | y y | y | y y | Y | ||||
| 6 | y y | y y | y | y (y) | Y | ||||
| 7 | y y | n y | y | y y | Y | ||||
| 8 | y y | y y | y | y y | Y | ||||
| 9 | n n | y | n n | N | |||||
| 10 | y y | n y | y | y y | Y | ||||
| 11 | n n | n | y n | N | |||||
| 12 | n n | y | n y | (N) | |||||
| 13 | y y | n y | y | y y | Y | ||||
| 14 | y y | n y | y | n y | Y | ||||
| 15 | y y | n | y | y y | Y | ||||
| 16 | y | y (y) | Y |
The half-mass radius (Rhm) is a useful quantity frequently used in N-body simulations. We have estimated it by measuring the radius that contain half of the 700 M⊙ luminous mass of Eq.(1), which turned out to be 8′, corresponding to Rhm=3.7 pc at distance of 1.6 kpc. Following Binney and Tremaine (1987) the virial radius can be expressed as
| (6) |
3.4 Internal velocity dispersion and dynamical mass
The mean radial velocity of NGC 6913 members is
| (7) |
with an observed dispersion of =2.0 km sec-1. The average uncertainty of the radial velocity of individual members is =1.0 km sec-1, which leads to an intrinsic radial velocity dispersion of NGC 6913 members amounting to
| (8) |
the three quantities being related as . Many of the physical quantities for NGC 6913 derived in the following critically depend upon this number. We are confident that our observations, reductions and measurements are state-of-the-art and involve so many high resolution observations of such a large number of stars over a so long period of time, that doing much better with 2m-class telescopes is hardly feasible. On the other hand, the high competition to access larger instruments prevents them to be assigned on programs like the present one that require such a massive telescope usage (even if equipped with MOS devices). Undoubtly, observations of more member stars over longer period of times would be useful to better constrain the intrinsic radial velocity dispersion, but this does not appear as an easy task. Therefore, we believe that in absence of deeper/better efforts, our measurement of the intrinsic radial velocity dispersion of NGC 6913 is worth some dynamical considerations that we develop in the rest of this paper.
The virial theorem links the cluster mass within the radius to the velocity dispersion in the form
| (9) |
For a virial radius of 9 pc, the virial cluster mass becomes
| (10) |
There is a large difference between luminous and virial total mass for the cluster (a factor of sixty, 7 102 vs 4 104 M⊙). Could it be intra-cluster mass ? Wang and Hu (2000) have derived a differential reddening across the cluster amounting to =1.82 mag. Even supposing the effect is solely caused by intra-cluster extinction (from above discussion the major contribution to differential reddening should actually come from the optically thick, foreground dust cloud) the amount of dust required to produce it is of the order of 4 103 M⊙, derived assuming a simple spherical symmetry, constant density, a standard dust-to-gas ratio ( atoms cm-2, Kilian 1992) and that a =1.82 mag differential extinction is accumulated as result of the line of sight crossing the whole cluster. Even under these assumptions the corresponding amount of intracluster material is far from filling the gap between the luminous (i.e. Eq.1) and dynamical mass (i.e. Eq.10).

Possible explanations to solve such a discrepancy
could be any combination of the following effects:
(i) the large and optically thick interstellar cloud discussed in
sect. 3.1 hides from view a significant portion of the cluster, causing an
underestimate of the tidal radius and luminous mass from star counts.
Deep infrared imaging at band and longer wavelengths could test
this scenario;
(ii) the cluster is still relaxing and some of the stars considered as
members are actually unbound leaving the cluster at velocities just larger
than the escape one, inflating the apparent dispersion of radial velocities.
An example could be star #6 which is a member according to both astrometric
investigations and combined photometric+spectroscopic criteria, and lies
projected close to cluster center sporting one of the earliest spectral
types (B0 V). Its radial velocity is well determined in () km sec-1, which is however 8.7 km sec-1 away from the cluster mean velocity
of () km sec-1. The difference exceeds 4.
The escape velocity from NGC 6913 is
| (11) |
supporting the possibility that star #6 is actually escaping. Kroupa et al.
(2001) N-body simulations of young clusters confirm that the observed
dispersion of radial velocities could be biased by unbound members;
(iii) some cluster members could be components of very wide binaries,
which orbital motion amount to just a few km sec-1 and cannot be detected
by observations spanning less than some decades;
(iv) a cluster angular moment larger than zero, with the axis pointing away
from the line of sight, could pass unnoticed given the restricted number of
observed stars and still contribute a fraction of the observed radial
velocity dispersion. A cluster rotation having a projected radial component
of 1.5 km sec-1 at half mass radius could be enough to bring the
virial mass in agreement with the luminous mass.

3.5 Evaporation of members
Lighter cluster members seem evaporating from NGC 6913 as the comparison in Figure 7 between the observed and Salpeter mass function supports, and as mass segregation in Figure 8 suggests.
In fact, for O and B type members the mean mass is M⊙ and being km sec-1 the radial velocity intrinsic dispersion, the mean kinetic energy of O and B type members is
| (12) |
If the cluster is relaxing toward energy equipartition, this is the mean kinetic energy to which its members are aiming, and there must be a value of the mass below which the velocity exceeds the escape value and the stars tend to evaporate. Such limiting mass follows from
| (13) |
However, this is actually an upper limit to the mass below which the members tend to leave the cluster due to evaporation. In fact, if the cluster core seems already relaxing in spite of the very young age, this could not be yet the case for the lower density outer regions of the cluster, with the relaxation being a process moving outward from the cluster center on timescales longer than the NGC 6913 age. Only devoted, deep photometric investigations can address what is the turning mass in NGC 6913 for which lighter members are already experiencing evaporation and what is its radial dependence.
3.6 Crossing time, relaxing time, mass segregation
Crossing time and relaxing time are theoretical quantities which play a relevant role in cluster dynamics. In fact they are closely related to the mass of the cluster, its dynamical status and the number of members. The crossing time is related to virial radius and cluster mass by ( from Eq.7)
| (14) |
and the relaxing time relates to number of members, cluster mass and half mass radius as
| (15) |
(from Spitzer spitzer (1987), derived for the case of globular clusters with similar mass members).
In the case of the luminous mass, 700 M⊙ and =92 (cf setc. 2.4), it is =45 Myr and =30 Myr, significantly longer that the estimated cluster age (5 Myr). For the Salpeter’s mass 3100 M⊙ and =104 (cf. Eq. 3), the crossing time reduces to =20 Myr while the relaxation time goes up to =650 Myr, both still larger than cluster lifetime.
NGC 6913 appears relaxed, at least in its core (where the relaxation time is expected to be shorter given the higher mass density) as mass segregation in Figure 8 shows. It is worth to note that concentration of massive stars toward cluster center is observed in some clusters to be present since their birth and not as a the result of purely dynamical evolution (i.e. the Orion trapezium system, see Hillenbrand & Hartmann, hillenbrand (1998)) and that some N-body simulations (Portegies Zwart et al. portegies (2001)) show mass segregation to happen in clusters over ages shorter then the canonical trelax. So, the apparent concentration of heavier members toward the center of NGC 6913 could also be due to mechanism other than dynamical relaxation.
3.7 Binaries
The dispersion of velocities in NGC 6913 is 2.9 km sec-1. Binaries with orbital velocities faster than it tend to survive close encounters, those orbiting slower risk ionization (Kroupa 2000). An orbital velocity of 2.9 km sec-1 corresponds to an orbital period of days for a binary with a total mass of 5.5 M⊙, which would go clearly undetected in the course of a 6-yr long monitoring like ours. Such a binary would have an angular separation of 0.4 arcsec (within detection threshold of current observational techniques from the ground) which would rise to 4.4 arcsec for members with a total mass of 67 M⊙ and decrease to 0.07 arcsec for members with a total mass of 1 M⊙.
All binaries detected in this investigation appear strongly bound, not ionizable by close encounters with other cluster members, and quite probably primitive (the short cluster age argue against a capture scenario). Their large eccentricities and non synchronous orbits indicates how far they still are from tidal circularization of the orbits and locking of the rotation and orbital periods which characterize the field binaries. Wider, more ionizable binaries are beyond the realm of spectroscopy, and would be profitably searched for by high spatial resolution imaging.
4 Desiderata
A deep and wide field photometric investigation of NGC 6913 and surrounding field would be a good starting point to better constraint the total mass, tidal radius and drop in the luminosity function of the cluster, and to address the large discrepancy between observed luminous mass, integrated IMF mass and the observed virial mass. At the cluster distance and reddening, UBVRI photometry complete to will map all cluster members more massive than 0.8 M⊙, thus venturing well into the realm of masses that should be already evaporating from the cluster. Such a photometric investigation, which is highly encouraged, should extend over a radius of not less that 20′ from the cluster center and should include JHKL bands to overcome the very strong differential extinction caused by the foreground interstellar cloud discussed in sect. 3.1. Once members lighter than those here investigated will be firmly identified, a study of their radial velocity distribution would add a good deal of constraints to the kinematical status and evolution scenario of NGC 6913.
Acknowledgements.
We would like to thank R.Griffin for the provided software and P.M.Marrese for securing the four spectra obtained during 2003. CB has been finacially supported by ASI I-R-050/02 and I-R-117/01 grants.References
- (1) Bertelli G., Bressan A., Chiosi C., Fagotto F., Nasi E., 1994, A&AS 106,275
- (2) Bessell M.S., 2000, PASP 112, 961
- (3) Binney J., Tremaine S. 1987, Galactic Dynamics, Princeton University Press
- (4) Briceño, C.; Luhman, K. L., Hartmann, L., Stauffer, J.R., Kirkpatrick, J.D. 2002, ApJ 580, 317
- (5) Crawford D.L., Barnes J.V., Hill G., 1977, AJ 82, 8, 606
- (6) Dias W.S., Lepine J.R.D., Alessi B.S., 2002, A&A 388, 168
- (7) FitzGerald M. P., 1970, A&A 4, 234
- (8) Hillenbrand L.A., Hartmann L.W., 1998, AJ 492,540
- (9) Hoag et al., 1961, Publ. US. Nav. Obs. 17, 347
- (10) Hron J., 1987, A&A 176, 34
- (11) Johnson H.L. 1962, in Nebulae and Insterstellar Matter, B.M.Middlehurst and L.H.Aller ed.s, Stars and Stellar Systems series, The University of Chicago Press
- (12) Joshi U.C. et al., 1983, PASJ 35, 405
- (13) Kazlauskas, A., Jasevicius, V. 1986, Bull. Vilnius Astron.Obs. 75, 18
- (14) Kilian J.,1992, A&A 262, 171
- (15) Kroupa P. 2000, in Massive Stellar Clusters, A. Lancon and C. Boily ed.s, ASP Conf. Ser. 211, pag. 233
- (16) Kroupa P., Aarseth S., Hurley J., 2001, MNRAS 321, 699
- (17) Liu T., Janes K.A., Bania T.M., 1989, AJ 98, 2, 626
- (18) Liu T., Janes K.A., Bania T.M., 1991, AJ 102, 3, 1103
- (19) Lyngå G., 1987, Catalogue of Open Cluster Data (5th Ed.)
- (20) Massey P. et al., 1995, ApJ 454, 151
- (21) Morgan W.W., Harris D.L., 1956, Visitas Astron. 2, 1124
- (22) Munari U., Tomasella L. 1999, A&A 343, 806
- (23) Neckel Th., Klare G., 1980, A&AS 42, 251
- (24) Peña J.H., Peniche R., Garcia Cole A., Plascencia J.C., Parrao L., Peña R. 2001, Odessa Astron. Pub. 14, 159
- (25) Portegies Zwart S. et al., 2001, MNRAS 321, 199
- (26) Salpeter E.E., 1955, ApJ 121, 161
- (27) Sanders W.L., 1971 A&A 14, 226
- (28) Sanders W.L., 1973 A&A 9, 221
- (29) Spitzer L., 1987, Dinamical evolution of Globular Cluster, Princeton University Press
- (30) Straižys V. 1977, Multicolor Stellar Photometry, Mokslas Publishers, Vilnius
- (31) Straižys V., Kuriliene, G. 1981, Ap&SS 80, 353
- (32) Tifft W.G., 1958, AJ 63,127
- (33) Wang J.J., Hu J.Y., 2000, A&A 356, 118
- (34) Yamashita, Y., Nariai, K., Norimoto, Y. 1977, An Atlas of Representative Stellar Spectra, The Univ. of Tokyo Press
![[Uncaptioned image]](/html/astro-ph/0310090/assets/x9.png)