Searching for the Intra-Group Medium in Loose Groups of Galaxies.
Abstract
We have conducted a study with the VLA, the DRAO ST, and the FUSE satellite to search for the intra-group medium in two loose groups of galaxies: GH 144 and GH 158. The VLA observations provide a census of the dense H I content of these groups in the form of individual galaxies and free-floating H I clouds as traced by the 21-cm H I line, while the FUSE observations trace the diffuse neutral and hot ionized gas that may fill the intra-group medium, populate the halos of individual galaxies, or reside in a skin around denser, neutral clouds. While nothing was detected in GH 158, in GH 144 we detected two previously unknown H I-rich low-surface brightness group galaxies. In addition, Ly-, Ly-, C III and N V were detected towards GH 144. Using this suite of data, we were able to place limits on the mass of various portions of this group. If virialized, GH 144 has a mass of 21012. Of that mass, 8% lies in the individual catalogued galaxies, and no more than that same fraction again could lie in the dense, neutral medium as constrained by our VLA observations. The absorption lines imply a diffuse gas with a volume density greater than 10cm from a layer less than 22 kpc thick, assuming a metallicity of 0.4 . While the extent of this gas is uncertain, it seems unlikely that this diffuse gas contributes a significant fraction of the group mass. Given the depth of the absorbing material, and its separation from the nearest galaxies, it seems most likely that it originates from a small clump in the intra-group medium; perhaps an ionized high-velocity cloud, but it may be associated with one of our new H I detections. This was an ambitious first attempt to search for the IGM in emission and absorption, and while it was only partially successful we show what is possible and what more is needed for its success.
1 Introduction
The vast majority of galaxies, including the Milky Way, reside in poor groups: collections of a few large () and tens of smaller galaxies (Tully 1987). Long known to be the basic building blocks of large scale structure, the importance of understanding galaxy groups has grown with possibility that groups may contain most of the baryons in the Universe in the hot phase of their intragroup medium (e.g. Tripp & Savage 2000, Tripp, Savage, & Jenkins 2000). Loose groups also represent a laboratory for the study of structure formation. While some groups may still be in the process of forming themselves (Zabludoff & Mulchaey 1998), they may also host ongoing galaxy formation. Analogs to the high velocity clouds seen around the Milky Way may exist in other groups and represent material falling onto galaxies for the first time (see Wakker & van Woerden 1997 and references therein for further discussion). Furthermore, Blitz et al. (1999) and Braun & Burton (1999, 2000) have argued that an important subset of high velocity clouds lie at large distances and, therefore, represent the large population of “mini-halos” predicted in Cold Dark Matter (CDM) models of structure formation.
The basic problem is that the baryon density in the local Universe derived from stars, neutral hydrogen, molecular hydrogen, and hot X-ray emitting gas represents less than a third of the baryon density observed at high redshift (z 2) in the Ly forest (e.g. Fukugita, Hogan, & Peebles 1998). A large fraction of the “missing” baryons could lie in a diffuse, warm intergalactic medium with temperatures of K, as predicted by a number of hydrodynamic simulations of galaxy and structure formation (e.g. Cen et al. 1995, Davé et al. 2001). While such gas would be extraordinarily difficult to detect in emission, it is evident in absorption. Tripp et al. (2000) and Tripp & Savage (2000) used STIS (Space Telescope Imaging Spectrograph) observations of OVI absorbers to suggest that most of the baryons in the local Universe do reside in this warm component in the intragroup medium. Follow-up simulations by Cen et al. (2001) suggest that this warm intergalactic medium should be pervasive and is a natural outcome of the growth of large scale structure.
One question that arises is whether or not there is any neutral gas associated with the recently detected O VI absorbers in the intergalactic medium in nearby groups; for example, does the O VI absorption arise in the extended halos of individual galaxies, or is it associated with the outer edges of intergalactic HI clouds? There is a long history of efforts to correlate Ly absorption line systems with known galaxies or intergalactic 21 cm line H I emission with mixed success (e.g. van Gorkom et al. 1996). While some teams (e.g. Lanzetta et al. 1995) claim that the majority of nearby Ly absorbers probe the extended gaseous halos of individual galaxies, others (e.g. Tripp, Lu, & Savage 1998, Stocke et al. 1995) find no correlation between nearby absorption line systems and individual galaxies. Simulations of structure formation suggest that absorption line systems and individual galaxies reside in the same large-scale filaments (Davé et al. 1999). More recently, Penton, Stocke, & Shull (2002) found that nearly a quarter of nearby Ly absorbers arise in galaxy voids and that absorbers cluster more weakly than galaxies. The detection of O VI absorption in nearby groups affords us the opportunity for a sensitive search for intergalactic H I emission in the same groups. Such emission may be related to the high- velocity clouds seen around the Milky Way, and perhaps throughout the Local Group.
In and near our Galaxy, H I with velocities deviating from differential galactic rotation is very common. Historically, gas clouds with large non-rotational velocities (100 km s-1) have been called “high-velocity clouds” (HVCs). It is now known that these represent a variety of phenomena (see Wakker & van Woerden 1997 for a review). Some HVCs are probably related to a galactic fountain (Shapiro & Field 1976, Bregman 1980); some are tidal debris connected to the Magellanic Stream (e.g. Putman et al. 2003) or other satellites (e.g. Lockman 2003); some may be infalling intergalactic gas (e.g. Complex C; Wakker et al. 1999, Richter et al. 2001, Tripp et al. 2003); and some may be associated with dark matter halos and be the remnants of the formation of the Local Group (e.g. Blitz et al. 1999, Braun & Burton 1999, de Heij et al. 2002). There is some variation between models in this last scenario. Blitz et al. (1999) suggest that all HVCs reside at distances of 1 Mpc and have H I masses of 107, which is only a small fraction of their total mass. In contrast, Braun & Burton (1999) proposed that only compact HVCs (CHVCs) are at large distances. Best fit models of this scenario by de Heij et al. (2002), suggest the clouds have masses of 105.5 to 107, sizes of 2 kpc, and are distributed within 150-200 kpc of the Milky Way and M31.
A strong test of the models proposed by Blitz et al. (1999), Braun & Burton (1999) and de Heij et al. (2002) is to ask “would one expect to see similar H I clouds in other galaxy groups?”. While H I clouds with masses predicted by Blitz et al. (1999) should be easily detected in other nearby groups, only the higher mass clouds of Braun & Burton (1999) and de Heij et al. (2002) would be visible. More importantly, however, for cloud sizes of 2 kpc and typical peak H I column densities of 1019 cm-2, the average volume density is 10-3 cm-3. At such low volume and column densities one expects that most of the hydrogen is ionized by the extra-galactic radiation field and thus the H I represents the tip of the iceberg. Such clouds could be more easily detected in absorption.
In this paper we set out to address both the nature of the IGM in groups similar to the Local Group and the nature of HVCs in these groups and, by analogy, in the Local Group. Our approach is to search parts of two loose groups of galaxies for HI emission associated with HVC analogs and to search for evidence of hot gas in the same groups via FUSE spectra along lines of sight through the same areas. In this way, we should be able to detect both the neutral and ionized components of any IGM present in these two groups. By obtaining both sets of data we should also be able to infer whether hot gas is associated with the halos of individual galaxies, with clumps of material in the IGM potentially analogous to HVCs, or with the group as a whole. If there is HI emission associated with absorbing systems, then we can accurately derive a metallicity for these objects and compare that with HVCs around the Milky Way and throughout the Local Group.
The paper is laid out as follows. In Section 2, we explain how the two groups were selected and describe their known properties. Section 3 discusses the VLA and FUSE observations of these groups. We present the resulting data in Section 4, and discuss the implications for the IGM and HVCs and our future plans in Section 5.
2 Sample Selection
In order to simultaneously study dense neutral gas in emission and diffuse neutral and ionized gas in absorption, we required the fortunate alignment of a galaxy hosting an active galactic nucleus (AGN) to serve as a probe of a foreground loose group of galaxies. Furthermore the AGN needs to be bright enough in the ultraviolet to observe with FUSE. We selected probes from Veron-Cetty & Veron (1998) with bright far-ultraviolet fluxes, F210ergs s cmÅ-1, which were within 2° of the center of a galaxy group from the CfA group catalog (Geller & Huchra 1983, hereafter GH83). Upon individual investigation of the resulting groups, we selected two loose groups and two probes to observe: GH 144 and GH 158 with Mrk 817 and Mrk 290 behind them. The known properties of these groups are discussed below.
2.1 GH 144 – Mrk 817
GH83 list GH 144 as being composed of the 3 galaxies listed in Table 1: NGC 5631 (E), NGC 5667 (Scd), and NGC 5678 (Sb). GH 144 is located at a velocity of 1945 km s-1; within 1000 km s-1 and 6° of its center, an additional 11 galaxies are listed in NED111The NASA/IPAC Extragalactic Database (NED) is operated by the Jet Propulsion Laboratory, California Institute of Technology, under contract with the National Aeronautics and Space Administration. some of which may be part of the group. The location of these galaxies, plus a few others and Mrk 817 are shown in Figure 1. While this is a generous range, it assures that we have included all group members in the plot. When corrected for Virgocentric infall by GH83, the velocity of the group is 2319 km s-1. Assuming H0=65 km s-1 Mpc-1, the group is at a distance of 36 Mpc. At 36 Mpc, 1° is 628 kpc. Mrk 817 is located at a projected distance of 650 kpc from the group center and 370 kpc from the nearest galaxy, UGC 9391. This sightline is closer to the group center than many of the group galaxies. Gas detected in absorption towards Mrk 817 could be associated with the group potential or individual galaxies.
2.2 GH 158 – Mrk 290
GH 158 is composed of at least the 5 galaxies listed in Table 2 (GH83): NGC 5981 (Sbc), NGC 5982 (E), NGC 5985 (Sb), NGC 5987 (Sb), and NGC 5989 (Sc), with an additional 10 galaxies within 1000 km s-1 and 6° cataloged in NED. The location of these galaxies, plus a few others and Mrk 290 are shown in Figure 2. With a Virgo-infall corrected velocity of 3147 km s-1, GH 158 has a distance of 48 Mpc. At this distance, 1°= 837 kpc. Mrk 290 is at a projected distance of 1 Mpc from the group center and 480 kpc from the nearest galaxy: NGC 5987. This sightline probes the outskirts of the group, so it is more likely that any hot gas seen is associated with a previously unidentified individual galaxy rather than with the group potential.
3 Observations
3.1 VLA Observations
We observed portions of the loose groups GH 144 and GH 158 in the 21 cm line of H I with the Very Large Array222The Very Large Array (VLA) is part of the National Radio Astronomy Observatory, which is a facility of the National Science Foundation, operated under cooperative agreement by Associated Universities, Inc.. in its compact D configuration. For GH 144, the VLA pointing is centered on Mrk 817, while for GH 158, the pointing is between Mrk 290 and NGC 5987. The groups were observed on 19 and 20 August, 2000 for approximately 8.5 hours each. The fields were observed using split intermediate-frequencies (IF) in 4 IF mode. This yielded a velocity resolution of 5.2 km s-1 over a total bandwidth of 600 km s-1. Flux calibration was done via observations of 3C147 and 3C295. Throughout the observations of the groups, we interspersed observations of secondary phase calibrators about once per hour.
Calibration and reduction was carried out using AIPS in the usual manner. As our observations were taken almost entirely during daylight, there was a lot of solar interference present throughout our data. Thus, we had to aggressively flag our data; as much as 15% of the data was discarded, almost all of which was on the shortest baselines. Each individual IF was continuum subtracted in the uv-plane with UVLIN using line-free channels near the end of each cube. The continuum-subtracted data was then CLEANed and mapped using a robust weighting scheme (albeit close to natural weighting) in the AIPS task IMAGR. The resulting data cubes for each IF were then glued together to form a final 600 km s-1 wide cube. For each field we mapped a region of 1° in diameter, out to 1% of the peak sensitivity of the primary beam of the VLA. The resulting properties of the data cubes are listed in Table 3.
Our final cubes had synthesized beamsizes of 58 and 1 sensitivities of 0.7 mJy/Beam and 0.5 mJy/Beam at the centers of the primary beams. This translates into a 1 sensitivity of 10 per channel and column density sensitivities of 1.210cm-2 per channel and 8.510cm-2 per channel for GH 144 and GH 158, respectively. The sensitivity of our observations is worse by a factor of two at a radius of 15, by a factor of 4 at a radius of 21.8, and is 42 worse at 32, the edge of our cubes. For both groups we searched for H I features not only in these cubes, but also in cubes smoothed in both velocity and spatially. The smoothed cubes had noise levels reduced by up to 40% of their original value.
3.2 DRAO Observations
Additional H I observations of GH 158 were made with the Dominion Radio Astrophysical Observatory (DRAO) Synthesis Telescope (ST) at Penticton (Canada) in July and August 2001. This instrument consists of seven 9-m radio antennae on an east-west line with a maximum spacing of 600-m. For a more detailed description of the telescope see Landecker et al. (2000). Observations were carried out by the staff at DRAO. A “complete survey” was made by combining observations from 12 different configurations, with each configuration making a full 12 hour observation of the field. The resulting visibility data were edited and calibrated by the observatory staff, who also produced the initial raw data cube.
To set the flux scale of the data, we compare the fluxes of continuum sources in the data cube with those in a “matched continuum” map produced by the observatory staff. This “matched continuum” is from a continuum channel away from the line emission and has better determined fluxes than the line data. Examining continuum sources in the line-free regions of the data cube show that the continuum is flat across the bandwidth to within 5%. The continuum subtracted data cube was produced by scaling the data cube to match the continuum source fluxes and then subtracting the “matched continuum” map from the data cube. This is the standard procedure for continuum subtraction of DRAO ST data. Because of the dense sampling of the uv-plane by the ST, the sidelobe level is quite low (4%). This fact combined with the relatively low dynamic range of the data means that CLEANing is not necessary.
The resulting data have a beamsize of 70″ x 59″, over a field of view of 2.5°. The characteristics of the DRAO observations are summarized in Table 3. The DRAO sensitivity was 25 worse than the VLA observations of the same field. As for the VLA data, we searched for H I emission in this data cube and in ones which had been smoothed in velocity and spatially. Again, the smoothed cubes had noise levels reduced by up to 40% of that in the original cubes.
3.3 FUSE Observations
A full description of the Far Ultraviolet Spectroscope Explorer (FUSE) satellite and its detectors is given by Moos et al. (2000) and Sahnow et al. (2000). Our data were taken from the survey of Wakker et al. (2003). These authors describe the steps in the data reduction, which we now summarize. First the data are screened to remove bad intervals, then they are corrected for satellite and detector motion, extracted, and wavelength and flux calibrated. The result is a spectrum for each of 8 detector segments. Four of these (LiF1A, LiF2B, SiC1A and SiC2B) cover the wavelength range near Ly (1025.722 Å), but the SiC channels are much noisier than the LiF channels. For spectra with high S/N ratio it is preferable to use only the LiF1A data, whereas for noisier spectra the S/N ratio can be substantially improved by combining LiF1A and LiF2B. Wakker et al. (2003) further describe how to align the FUSE spectra using H I data, and how to remove the contaminating H2 lines at 1031.191 and 1032.356 Å. This data has been recalibrated with the newest version (v.2.1.7) of the FUSE data pipeline, yielding an improved wavelength scale compared to Wakekr et al. (2003).
Mrk 817 is relatively bright near 1030 Å (a flux of 9.410-14 erg cm-2 s-1 Å-1 (the 16th highest in the FUSE sample) and two long observations are available, 76.3 and 86 ksec in length. The final spectrum presented by Wakker et al. (2003) has a signal-to-noise ratio in the LiF1A channel of 28.8 per 20 km s-1 resolution element near 1030 Å which is the third highest in the sample. On the other hand, Mrk 290 is relatively faint (94th in the FUSE sample) and only a short (12.8 ksec) integration is available, yielding a final S/N ratio in the combined LiF1A+LiF2B data of just 4.4 per resolution element.
For Mrk 817 HST-GHRS (the Goddard High Resolution Spectrograph on the Hubble Space Telescope) data are also available, from HST program 6593, PI Stocke. These data were analyzed in detail by Penton et al. (2000).
4 Results
4.1 GH 158-Mrk 290
For our observations of GH 158, we chose the VLA field so that Mrk 290 was near the center of the field, yet we would still have the nearest galaxy, NGC 5987, within the 1° field. Unfortunately, this still places NGC 5987 near the edge of our field, where the sensitivity has dropped off to 1% of the peak sensitivity, and it was undetected. To enhance our sensitivity we Hanning smoothed our data in steps up to 42 km s-1 resolution and with a Gaussian filter up to 2′ and 3′ resolution to best match the optical size of galaxies in the field. While the data was up to 2.5 more sensitive, no H I emission was seen in this or our original VLA data.
For the DRAO pointing we chose to center the larger field between the group center and Mrk 290, so that 7 group galaxies lie within the half power radius of the primary beam. No signature of H I emission was present for any of the galaxies in this data. Hanning smoothing by up to 8 in velocity and Gaussian smoothing to a resolution of 2′ did not reveal any emission despite improving our sensitivity by 2.5. While two group galaxies, NGC 5985 and NGC 5987, have previously been detected in H I, their expected fluxes of 35.1 Jy km s-1and 21.9 Jy km s-1over velocity widths of 500 km s-1 and 550 km s-1 respectively (Huchtmeier & Richter 1989), imply an average flux below the 2 level. While the “horns” of their double-horned profile may be higher than this, most of the flux would be at even lower significance. The large velocity width of the two galaxies may also mean that not all of the emission is contained in our bandwidth. Clearly, more time spent observing this field, preferably with a larger bandwidth but similar velocity resolution, would be beneficial in detecting any H I present.
Figure 3 shows the Ly, Ly, O VI1031.926, O VI1037.617 and C III977.200 lines in the spectrum of Mrk 290, for a 500 km s-1 velocity range centered around the average heliocentric velocity of GH158, 2850 km s-1. There is no Ly associated with GH158 with v 2800 km s-1, and any absorption at higher velocities would be confused with Galactic C II and C II∗ absorption. The Ly and C III data are very noisy (S/N1), although there may be a hint of C III absorption near 2600 km s-1. Intra-group O VI 1031.926 would fall at the velocity of geocoronal O I* 1040.943 emission. Figure 3, therefore, shows only the O VI data taken during orbital night. Still, intra-group O VI at 2600 km s-1 is not apparently detected, with a detection limit of 100 mÅ, or NOVI 1014 cm-2. Compared to typical values found in Galactic high-velocity clouds (log NOVI =14.0) this is not a very significant limit. In summary, the data quality is too low to derive useful limits or values on the possible intergalactic absorption associated with GH158. A longer FUSE observation of Mrk 290 has been allocated time for cycle 4, which will provide better sensitivity for a more detailed study of this group.
4.2 GH 144-Mrk 817
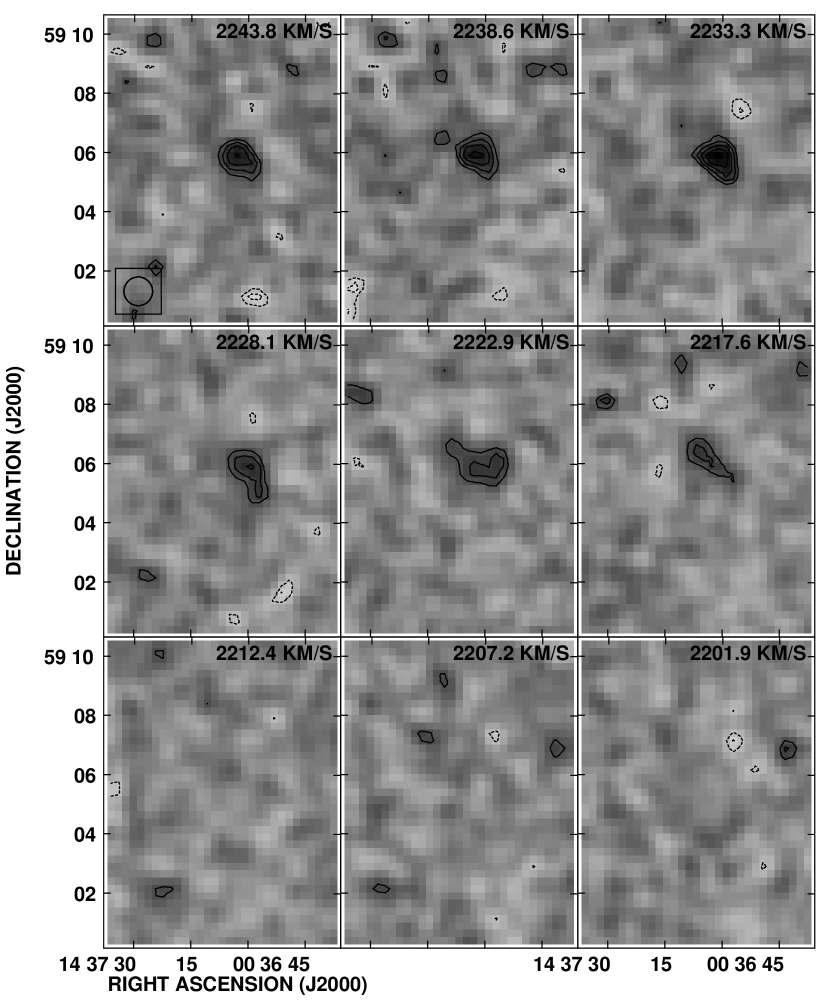
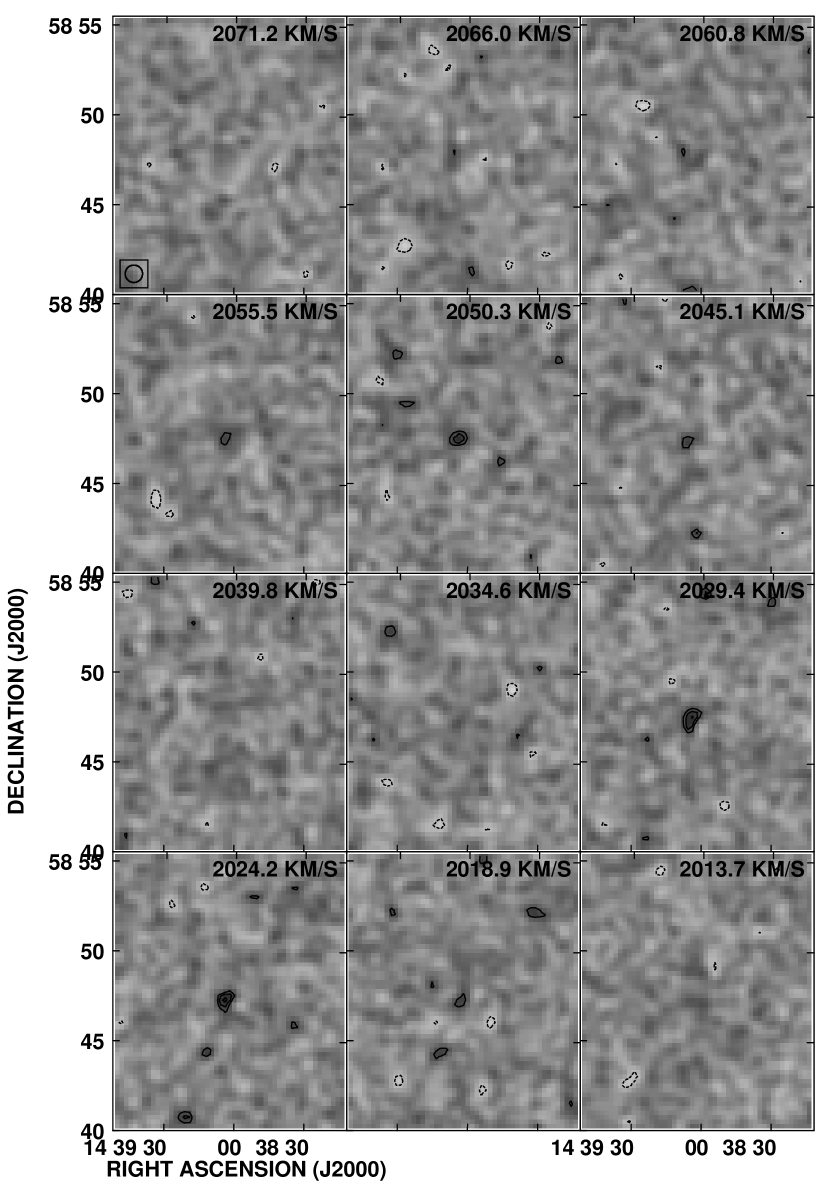
Our VLA observations of GH 144 were centered on Mrk 817 and no known group galaxies lie in the field of view, however, we did detect 2 H I clouds in the field. Channel maps of these two detections are shown in Figures 4 & 5, and the H I spectra are shown in Figures 6 & 7. The coordinates and basic properties of our detections are listed in Table 4. They have been named following IAU guidelines using the first letter of each author’s last name and their J2000 coordinates: PWWF J1437+5905 and PWWF J1439+5847.
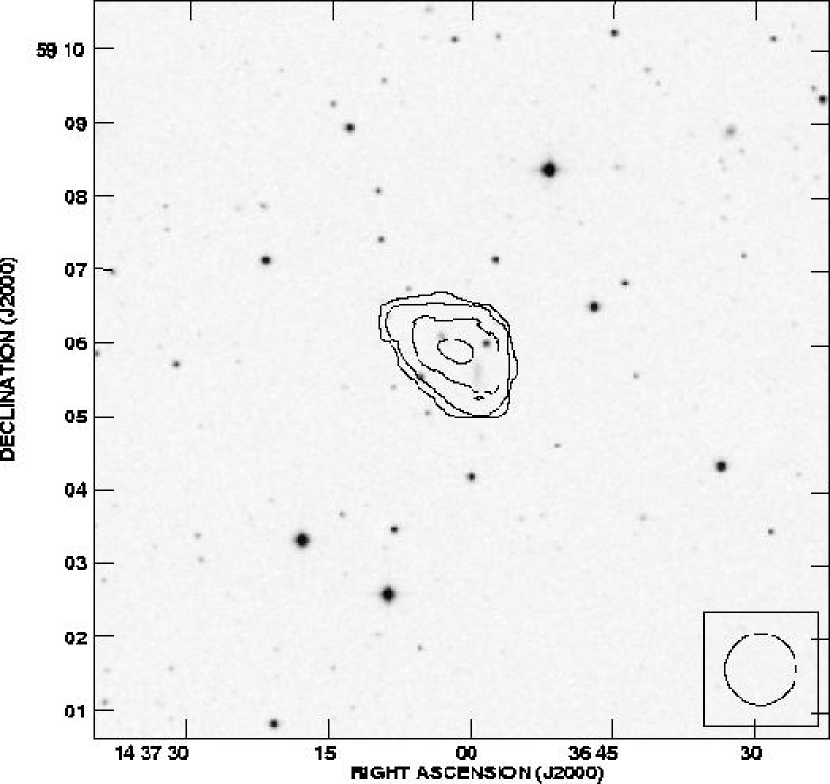
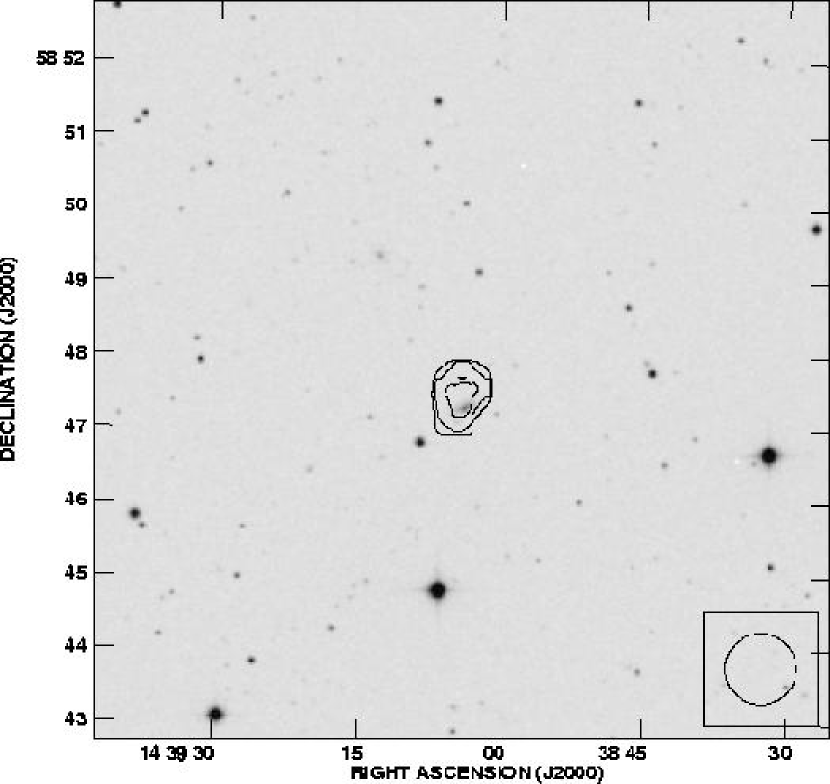
As seen in Figures 4 & 5, PWWF J1437+5905 has a peak flux greater than 6, and remains above 3 for 6 channels (31 km s-1), while PWWF 1439+5847 has a peak flux of 5 and spans 10 channels (52 km s-1) with a flux above 3 for 8 of those channels. After correcting for the response of the primary beam, we find that both detections have beam–diluted peak column densities of 2.61019 cm-2, and H I masses of 3.4109 and 2.5109 . PWWF J1437+5905 lies on the edge of our bandpass, so its total velocity width and H I mass are certainly higher. Figures 8 and 9 illustrate the probable association of both detections with optical counterparts, with unknown redshifts, on the Digital Sky Survey (DSS). This suggests that both objects are typical low surface brightness galaxies. Neither galaxy is cataloged in NED, but both of these galaxies have been detected in a shallower but wider VLA H I study of GH 144 around the sightline to Mrk 817 conducted by McEntaffer et al. (Hibbard, 2002, private communication).
These galaxies are both likely members of GH 144. While PWWF J1437+5905 has a projected separation from the group center of 926 kpc and 288 km s-1, it is surrounded both spatially and in velocity space by other group members. PWWF J1439+5847 is also 926 kpc from the group center, but is only 100 km s-1 from the group velocity. These objects are both isolated within the group residing 580 kpc and 800 kpc, and 290 km s-1 and 60 km s-1 from the nearest group member respectively. Finally, both of these galaxies have a projected separation of 200 kpc from Mrk 817, making them the closest group galaxies to any potential absorber.
Figure 10 shows the Ly, Ly, Ly, O VI1031.926, O VI1037.617 and C III977.200 lines in the UV spectrum of Mrk 817, for a velocity range of 500 km s-1 relative to the average heliocentric velocity of GH144, 1945 km s-1. Table 5 lists the derived properties for these lines. Penton et al. (2000) already reported the Ly absorption in the GHRS spectrum, and listed velocities of 1933 and 2097 km s-1, equivalent widths of 2913 and 13515 mÅ, and -values of 3413 and 404 km s-1. The corresponding Ly lines are then expected to have equivalent widths of 43 and 213 mÅ. The weaker intergalactic line is too weak too discern in the FUSE spectrum. On the other hand, for the higher-velocity Ly line the corresponding Ly is clearly detected, at 2070 km s-1, with an equivalent width of 257 mÅ. The absorption at slightly shorter wavelengths is likely Galactic O VI at velocities =60–140 km s-1which blends with the Ly line, however it may also be O VI associated with the M101 group which lies 5° (800 kpc) away. The two Lyman lines at 2085 km s-1 lie on a curve of growth that corresponds to a -value of 2510 km s-1 and log =13.550.14. For the -value of 40 km s-1 given by Penton et al. (2000), log is not substantially different (13.490.05).
Any redshifted O VI1031.926 near 2100 km s-1 is obscured by Galactic O I1039.230 absorption, as well as O I geocoronal emission. The strong absorption feature near 2000 km s-1 is due to O I absorption in high-velocity cloud complex C (see e.g. Wakker 2001). The apparent broad feature in the O VI1037.617 spectrum is an artifact – it is only seen in one of the two observations. The detection limit in this wavelength region is 25 mÅ, corresponding to log NOVI 13.6.
The features at 2025 and 2125 km s-1 in the C III spectrum are measured at 185 and 95 mÅ, and are likely to be intergalactic C III in GH144. A gaussian fit to the lines yields 8 and 13 km s-1. With these -values, the corresponding column densities are log NCIII =12.550.15 and 12.140.20. Despite the narrow linewidth of the low velocity component, it is also visible in the noisier LiF2B channel so we are confident of its reality. Note that these features does not align in velocity with either the Ly and Ly absorption, but the two components bracket the Ly component at 2097 km s-1.
Since the sightline to Mrk 817 passes far from any galaxies in GH144, it is likely that photo-ionization by the extragalactic background is the dominant source of ionization. Savage et al. (2002) calculated a photo-ionization model using CLOUDY (Ferland 2003 and references therein) assuming a standard extragalactic radiation field composed of QSOs and the cosmic microwave background for an O VI absorber at slightly higher redshift, but with a similar value for (see their Fig. 7). CLOUDY estimates the column density and volume density of hydrogen (neutral plus ionized) based on fixing , NOVI, and metallicity for a given radiation field. Using the Savage et al. model and assuming a metallicity of 0.4 , the O VI detection limit for GH144 toward Mrk 817 implies an ionization parameter and a total hydrogen volume density . Using the derived column density and volume density, the model yields a depth, L, for the absorbing gas of 22 kpc. The predicted O VI column density, and inferred depth, scales non-linearly with the assumed metallicity, so that if a metallicity of 0.1 is assumed, the O VI detection limit implies , and L 150 kpc.
N V1238.821 at a velocity of 2041 and 2106 km s-1 may be detected, with an equivalent width of 154 and 134 mÅ. Using the fitted linewidth of =60 km s-1, this would imply a column density of =13.10.2. This would imply . On the other hand, the upper limit set by the O VI non-detection implies log , which yields 12.9. Since the N V detection is very tentative this is not incompatible. Better data would obviously be useful.
The C IV lines are unfortunately not covered by the GHRS spectrum. At the prediction is log NCIV 13.2. Such a line would be easily detectable (optical depth 1) and since Mrk 817 is bright, a high signal-to-noise spectrum can easily be obtained with HST. An accurate measurement of NCIV would allow the determination of the density of the absorbing gas.
5 Discussion & Conclusions
5.1 The mass of the IGM
The main hope of this study was to find HI emission associated with the diffuse IGM that produces UV absorption lines in both groups: none was found. Our only HI detections were of two galaxies in the GH 144 group. We can use the non–detection of H I and the detection of the IGM in absorption, along with a few assumptions regarding the size of the group, to try and place limits on the total amount of gas in the IGM of GH 144. In particular we will examine what fraction of the total mass of each group could be baryonic and residing in the IGM. Because we lack high–quality FUSE data for GH 158, we will omit it from this excercise.
The first step is to determine what the total masses of each group are based on the assumption that the groups are virialized. While it is very likely that most loose groups have not yet fully collapsed, let alone virialized, as evidenced by the presence of substructure in many groups (e.g. Zabludoff & Mulchaey 1998), this is the only method for determining a total group mass based on the dynamics of the group. Taking the Virial theorem from Binney & Tremaine (1987):
| (1) |
where is the gravitational radius of the group and is the three- dimensional velocity dispersion of the group. As these values are not equal to the observable values, we must convert the equation to use values we can measure: the radial velocity dispersion and the group radius. In the former case, the square of the three-dimensional velocity dispersion is traditionally assumed to be three times the square of the radial velocity dispersion (i.e. the velocity dispersion is assumed to be isotropic): . Relating an observable radius to the gravitational radius is a bit more uncertain, but Binney & Tremaine (1987) state that for “many simple stellar systems”, the radius which contains half the mass is 40% of the gravitational radius: . Therefore, Equation 1 becomes:
| (2) |
where is the radial velocity dispersion, and we assume is half of the maximum separation between group galaxies. Taking the velocity dispersion from GH83, we have the following values for and : 925 kpc and 36 km s-1. These values are calculated by GH83 using only those galaxies they listed as group members (i.e. the bright group galaxies). As a result of not accounting for the fainter population of galaxies likely present in the group, the group size and especially the velocity dispersion as listed by GH83 are not as accurate as they could otherwise be. Keeping this caveat in mind, we find that Mvirial is 210 for GH 144. Is this mass mostly in individual galaxies or is it spread throughout the group?
To answer this question, we use both the virial theorem and the dynamical mass equation:
| (3) |
where Vrot is the rotation velocity of the galaxy (corrected for inclination) and RHI=1.7R25, where R25 is the radius of the galaxy at the 25 mag arcsec-2 isophote. The factor of 1.7 is an average from a sample of spiral galaxies studied by Broeils & Rhee (1997). These values for each large galaxy in the group come from the Lyon-Meudon Extragalactic Database (LEDA) and are listed in Table 6. Summing the total masses of each galaxy, we find that the mass in galaxies is 51011. This is 25% of the virial mass of each group; it will be even less if the true group velocity dispersion is higher. Is the remaining the group mass in the form of diffuse gas or is it dark matter?
It is at this point where we use our observations to place limits on the mass of the IGM in GH 144. This can be done for the dense, yet diffuse, neutral gas traced by the H I 21-cm emission and the lower density diffuse ionized gas traced by the FUSE absorption line data. We must make assumptions regarding the area over which the IGM is spread and its filling fraction over that area in combination with our column density sensitivities from the 21-cm and UV observations. For the H I observations, we have no a priori information to constrain the filling factor, so for starters we will leave it in our results explicitly. In Table 3 the column density sensitivity of our VLA observations is listed. Assuming that the areas we observed are typical of the group as a whole (in that the H I is uniformly distributed), taking a 5 detection limit at the center of the primary beam, and integrating over an area with a radius equal to rmed while explicitly listing the dependence on the number channels our limits are:
| (4) |
where is the number of channels the signal is distributed across and is the filling fraction. Assuming that and taking the velocity dispersion of the group (36 km s-1) the mass limit becomes 31011, or less than 67% of the mass in individual galaxies and less than 15% of the virial mass of the group. With the assumptions regarding the filling factor for the group and the upper limit on the H I column density, this is a highly uncertain value. Nevertheless, the presence of only weak Lyman- absorption implies a very low filling fraction of dense neutral gas in the group. Some of the diffuse gas in these groups may be hot and ionized, so we must look to our UV absorption line data for limits on its contribution to the total mass of the group.
To obtain the total potential gas mass of the groups, we must carry out the same exercise for the diffuse warm and hot ionized gas traced by the UV absorption lines as well. In Section 4.2, we discuss how we determine the density and size scale for the hot gas in GH 144. The O VI line constrains the density to be greater than 10cm-3 for a metallicity of 0.4 . This volume density, combined with the column density of hydrogen, provides a size scale of 22 kpc. So, if this absorbing gas comes from a cloud with a 22 kpc diameter and a filling fraction of 0.5 (based on the number of groups with absorbing gas discussed in Wakker et al., in preparation), then the mass of the cloud is 4105; a negligible fraction of the group mass. If the metallicity of the gas was only 0.1 , then the size scale increases to 150 kpc, and the mass of a cloud with this size is 107; still a negligible fraction of the group mass.
What if the absorbing gas comes from a thin sheet of hot gas spread throughout the group? Taking a depth of 22 kpc, and a diameter of 1.85 Mpc, then we get a mass of 4109 for our original volume density. In any case, in order to increase the mass contribution of this gas to the group mass we must increase the density, but this would imply a smaller region from which the absorption originates. While this is just one line of sight through the group, it seems unlikely that this absorbing gas contributes any significant mass to the IGM. Multiple lines of sight through this group and further studies of other groups similar to GH 144 will help determine if this is a atypical line-of-sight, or if more groups lack diffuse gas. The absence of a significant amount of warm to hot diffuse gas in the IGM of GH 144 is contradictory to both the predictions of models (e.g. Cen et al. 2001, Davé et al. 2001) and observations towards other groups (e.g. Tripp & Savage 2000, Tripp et al. 2000). Instead, it appears that the majority of the mass outside of galaxies in GH 144 can not be identified as diffuse neutral or hot gas, but may have to accounted for as dark matter.
5.2 What is the source of the UV absorption lines?
As discussed in the Introduction, it is a matter of some debate whether Lyman- and O VI absorbers originate in the extended gaseous halos of galaxies (e.g. Lanzetta et al. 1995, Savage et al. 2003), as the ionized layer of intergalactic H I clouds analogous to HVCs (e.g. Sembach et al. 2000), from the intra-group medium (e.g. Tripp & Savage 2000, Tripp et al. 2000), or as part of large-scale filaments (e.g. Davè et al. 1999). One goal of this project was to examine the relation between H I emission and UV absorption line systems to address this question.
Since the UV data for Mrk 290 is not of particularly high quality, we will focus our discussion on the data towards Mrk 817 through the GH 144 group. Ly-, Ly-, and C III lines along this sightline as discussed above, with the more highly ionized C III bracketing one of the two Lyman- lines. The lower velocity, weaker Lyman- line has no other associated lines, but this may be due to our lack of sensitivity. The system of lines at 2100 km s-1 is consistent with what was seen by Wolfe & Prochaska (2000a) in Damped Lyman- protogalaxies where the more highly ionized lines lie outside those of lower ionization, so while the lines do not overlap they likely originate in the same gravitational potential. Wolfe & Prochaska (2000b) interpret this scenario arising from a line-of-sight passing through a neutral disk within a hot, collapsing halo. Their tests of specific models were inconclusive, however. We may be seeing something similar to their scenario with hot gas condensing onto a neutral cloud in the intra-group medium, but this is certainly not the only explanation.
The system of absorption lines towards Mrk 817 is not centered on the velocity of the group (1945 km s-1), but is offset by 100 km s-1 to higher velocities. If these lines are associated with intra-group gas, this may indicate the presence of substructure in GH 144, so that the group may not yet be virialized. There is no H I emission directly associated with this absorption-line system.
Another possibility comes about from examining the size scale of the absorbing material. With the inferred size scales of the gas being only 22 kpc, this implies we are probing the outskirts of the halo of a galaxy, or part of a clumpy IGM. For example, an IGM filled with highly ionized HVCs. In the former case, the closest galaxies to this sightline are PWWF J1437+5905 and PWWF J1439+5847 which lie about 200 kpc away in projection. If the UV absorption lines are associated with gas in the halo of either galaxy, then the halos must be very extended. In velocity space, however, the absorbers have velocities that are consistent with the velocity width of PWWF J1439+5847. The Ly- lines are offset by -112 km s-1 and +52 km s-1 offset while the C III is -20 km s-1 and +71 km s-1 offset. Compare this to the velocity width at 20% of the peak value of 60 km s-1, and it would not be completely unreasonable to believe that they may be associated. If they are, then the total mass of the halo of PWWF J1439+5847 would be only 41010, about 10 the H I mass of the galaxy. Given the huge physical separation, it may be more reasonable to assume that the absorbing gas is instead a clump associated with the IGM or the large-scale filament in which the group resides (e.g. Rosenberg et al. 2003). This clumpy IGM could represent low mass, mostly ionized, HVCs spread throughout the group. These would be of lower mass than would be inferred based on the models of Blitz et al. (1999) and Braun & Burton (1999), but may otherwise be analogous.
More sensitive H I observations and the ability to probe the absorbing gas in multiple sightlines through a single group should provide better constraints on the competing models for the source of the UV absorption lines.
5.3 Future Possibilities
Overall our study has been an ambitious first attempt to study the nature of the intra-group medium in both emission and absorption, which has been only partially successful. It has yielded some interesting insights into the relation of the diffuse warm, absorbing gas with the denser, cooler, neutral, emitting gas in a loose group. While it is difficult to learn much from the study of just a couple groups, Wakker et al. (2004, in preparation) have identified other galaxy groups with background AGN suitable for this type of study. The most fundamental limitations to our study come from the poor H I sensitivity to diffuse, low column density gas and the small area mapped with a single VLA pointing, and the lack of multiple sightlines to background AGNs through these groups. In the former case large area maps made with single dish radio telescopes equipped with multibeam receivers (such as the Parkes Multibeam and the Arecibo ALFA receiver currently under construction) should provide better constraints. In the latter case, we must wait for the next generation of space-based instruments, starting with the Cosmic Origins Spectrograph (COS) on HST. Such instruments will start to revolutionize this field. They will permit fainter AGNs to be used as lightbulbs for absorption line studies allowing for more groups to be studied and even for studies of multiple sightlines through individual groups. As an example, COS will be an order of magnitude more sensitive than FUSE. Future instrumentation on UV/Optical space telescopes should be even better. When such instruments become available, we hope that our work will help serve as a template for future multiwavelength studies of groups of galaxies.
References
- (1) Binney, J., & Tremaine, S. 1987, Galactic Dynamics (Princeton: Princeton UP)
- (2) Blitz L., Spergel D., Teuben P.J., Hartmann D., Burton W.B., 1999, ApJ, 514, 818
- (3) Braun R., Burton W.B., 1999, A&A, 351, 437
- (4) Braun R., Burton W.B., 2000, A&A, 354, 853
- (5) Bregman, J.N., 1980, ApJ, 236, 577
- (6) Broeils, A.H., Rhee, M.-H., A&A, 324, 877
- (7) Cen, R., Kang, H., Ostriker, J.P., Ryu, D., 1995, ApJ, 451, 436
- (8) Cen, R., Tripp, T.M., Ostriker, J.P., Jenkins, E.B., 2001, ApJ, 559, 5
- (9) Collins, J.A., Shull, J.M., Giroux, M.L., 2003, ApJ, 585, 336
- (10) Davé, R., Hernquist, L., Katz, N., Weinberg, D.H., 1999, ApJ, 511, 521
- (11) Davé, R., Cen, R., Ostriker, J.P., Bryan, G.L., Hernquis, L., Katz, N., Weinberg, D.H., Norman, M.L., O’Shea, B., 2001, ApJ, 552, 473
- (12) de Heij V., Braun R., Burton W.B., 2002, A&A, 392, 417
- (13) Ferland, G.J., 2003, ARA&A, 41, 517
- (14) Fukugita, M., Hogan, C.J., Peebles, P.J.E., ApJ, 503, 518
- (15) Garcia, A.M., 1993, A&AS, 100, 47
- (16) Gardiner L.T., Noguchi M., 1996, MNRAS, 278, 19
- (17) Geller M.J., Huchra J.P., 1983, ApJS, 52, 61 (GH83)
- (18) Gibson B.K., Giroux M.L., Penton S.V., Stocke J.T., Shull J.M., Tumlinson, J., 2001, AJ, 122, 328
- (19) Hartmann, D., Burton, W.B., 1997, “Atlas of Galactic Neutral Hydrogen”, (Cambridge: Cambridge UP)
- (20) Huchtmeier, W.K., Richter, O.-G., 1989, “A General Catalog of HI Observations of Galaxies”, (Berlin: Springer-Verlag)
- (21) Hulsbosch A.N.M., 1975, A&A, 40, 1
- (22) Landecker, T.L., et al. 2000, A&AS, 145, 509
- (23) Lanzetta, K.M., Bowen, D.V., Tytler, D., Webb, J.K., 1995, ApJ, 442, 538
- (24) Lockman, F.J., 2003, ApJ, 591, L33
- (25) Moos H.W., et al., 2000, ApJ, 538, L1
- (26) Penton S.V., Stocke J.T., Shull J.M., 2000, ApJS, 130, 121
- (27) Penton S.V., Stocke J.T., Shull J.M., 2002, ApJ, 565, 720
- (28) Putman, M.E., Staveley-Smith, L., Freeman, K.C., Gibson, B.K., Barnes, D.G., 2003, ApJ, 586, 170
- (29) Richter P., Sembach K.R., Wakker B.P., Savage B.D., Tripp T.M., Murphy, E.M., Kalberla P.M.W., Jenkins E.B., 2001, ApJ, 559, 318
- (30) Rosenberg, J.L., Ganguly, R., Giroux, M.L., Stocke, J.T., 2003, ApJ, 591, 677
- (31) Sahnow D.J., et al. 2000, ApJ, 538, L7
- (32) Savage, B.D., Sembach K.R., Tripp T.M., Richter P., 2002, ApJ, 564, 631
- (33) Savage, B.D., et al., 2003, ApJS, 146, 125
- (34) Sembach, K.R., et al. 2000, ApJ, 538, L31
- (35) Sembach K.R., Wakker B.P., Savage B.D., Richter P., Meade M., et al., 2003, ApJS, 146, 165
- (36) Shapiro, P.R., Field, G.B., 1976, ApJ, 205, 762
- (37) Stocke, J.T., Shull, J.M., Penton, S., Donahue, M., Carilli, C., 1995, ApJ, 451, 24
- (38) Tripp, T.M., Lu, L., Savage, B.D., 1998, ApJ, 508, 200
- (39) Tripp, T.M., Savage, B.D., 2000, ApJ, 542, 42
- (40) Tripp, T.M., Savage, B.D., Jenkins, E.B., 2000, ApJ, 534, L1
- (41) Tripp, T.M., et al., 2003, AJ, 125, 3122
- (42) Tully, R.B., 1987, ApJ, 321, 280
- (43) van Gorkom, J.H., Carilli, C.L., Stocke, J.T., Perlman, E.S., Shull, J.M., 1996, AJ, 112, 1397
- (44) van Woerden H., Schwarz U.J., Peletier R., Wakker B.P., Kalberla P.M.W., 1999, Nature, 400, 138
- (45) Veron-Cetty, M.P., Veron, P., 1998, ESO Sci. Rep., 18, 1
- (46) Verschuur G.L., 1969, ApJ, 156, 771
- (47) Wakker B.P., 2001, ApJS, 136, 463
- (48) Wakker B., Howk C., Schwarz U., van Woerden H., Beers T., Wilhelm R., Kalberla P., Danly L., 1996, ApJ, 473, 834
- (49) Wakker B.P., Howk J.C., Savage B.D., van Woerden H., Tufte S.R., Schwarz U.J., Benjamin R., Reynolds R.J., Peletier R.F., Kalberla P.M.W., 1999, Nature, 400, 388
- (50) Wakker B.P., van Woerden H., 1997, ARA&A, 35, 217
- (51) Wakker B.P., et al., 2003, ApJS, 146, 1
- (52) Wakker B.P., Sembach K.R., Savage B.D., 2002, in “The IGM/Galaxy connection”, eds. J. Rosenberg, M. Putman, 281, 289
- (53) Wolfe, A.M., Prochaska, J.X., 2000a, ApJ, 545, 591
- (54) Wolfe, A.M., Prochaska, J.X., 2000b, ApJ, 545, 603
- (55) Zabludoff, A.I., Mulchaey, J.S., 1998, ApJ, 498, L5
| Galaxy | (J2000) | (J2000) | V⊙ | Hubble Type |
|---|---|---|---|---|
| h:m:s | d:m:s | km s-1 | ||
| NGC 5631 | 14:26:33.3 | 56:35:00 | 1979 | E |
| NGC 5667 | 14:30:24.9 | 59:28:16 | 1943 | Scd |
| NGC 5678 | 14:32:05.4 | 57:55:13 | 1922 | Sb |
Note. — All data is taken from NED.
| Galaxy | (J2000) | (J2000) | V⊙ | Hubble Type |
|---|---|---|---|---|
| h:m:s | d:m:s | km s-1 | ||
| NGC 5981 | 15:37:53.3 | 59:23:34 | 1764 | Sbc |
| NGC 5982 | 15:38:39.7 | 59:21:20 | 2904 | E |
| NGC 5985 | 15:39:37.7 | 59:19:57 | 2517 | Sb |
| NGC 5987 | 15:39:58.1 | 58:04:56 | 3010 | Sb |
| NGC 5989 | 15:41:32.5 | 59:45:19 | 2878 | Sc |
Note. — All data is taken from NED.
| GH 144 - Mrk 817 | GH 158 - Mrk 290 | GH 158 - Mrk 290 | |
|---|---|---|---|
| Telescope | VLA | VLA | DRAO ST |
| Configuration | D | D | |
| Observation Dates | 2000 Aug. 19,20 | 2000 Aug. 19,20 | 2001 July & Aug. |
| Integration Time (hr) | 8.1 | 8.1 | 144 |
| Beam Size (arcsec) | 58 | 58 | 7059 |
| Half Power Diameter FOV (deg.) | 0.5 | 0.5 | 2.5 |
| Channel Width ( km s-1) | 5.2 | 5.2 | 3.3 |
| Velocity Coverage ( km s-1) | 1642 - 2254 | 2593 - 3207 | 2474 - 3323 |
| SensitivityaaThe 1, 1 channel RMS noise at the center of each data cube. (mJy/Bm) | 0.7 | 0.5 | 9.8 |
| SensitivityaaThe 1, 1 channel RMS noise at the center of each data cube. (106 ) | 1.0 | 1.4 | 22 |
| SensitivityaaThe 1, 1 channel RMS noise at the center of each data cube. (1018cm-2) | 1.2 | 0.85 | 9 |
| PWWF J1437+5905 | PWWF J1439+5847 | |
|---|---|---|
| (J2000) | 14:37:02 | 14:39:04 |
| (J2000) | +59:05:55 | +58:47:29 |
| V⊙ ( km s-1) | 2233 | 2045 |
| W20 ( km s-1) | 34aaThese are lower limits since this object extends beyond our observed bandpass. | 60 |
| (109) | 3.4aaThese are lower limits since this object extends beyond our observed bandpass. | 2.5 |
| Peak (1019cm-2) | 2.6 | 2.6 |
| Separation (kpc)bbThe projected radial separation between Mrk 817 and each H I detection, assuming they lie at the group distance of 36 Mpc (1′ = 10.5 kpc). | 200 | 221 |
| Separation ( km s-1) | 288aaThese are lower limits since this object extends beyond our observed bandpass. | 100 |
| Ion | V⊙ | Wλ | b | log N |
|---|---|---|---|---|
| km s-1 | mÅ | km s-1 | cm-2 | |
| Lyman- | 1933 | 2913 | 3413 | 12.760.24 |
| Lyman- | 2097 | 13515 | 404 | 13.550.14 |
| Lyman- | 2070 | 257 | 2510 | 13.550.14 |
| N V1238.821 | 2041 | 154 | 308 | 12.840.13 |
| N V1238.821 | 2106 | 134 | 308 | 12.790.15 |
| C III977.20 | 2025 | 185 | 83 | 12.550.15 |
| C III977.20 | 2116 | 95 | 135 | 12.140.20 |
| O VI1037.617 | 21aaThis is a 3 upper limit using the assumed b-value. | 30bbThis is an assumed value based on the approximate widths of the other absorption lines. | 13.53aaThis is a 3 upper limit using the assumed b-value. | |
| Galaxy | R25aafrom LEDA and assuming that all galaxies lie at the group distance. | Vrotbbfrom LEDA | Mdyncccalculated using Equation 3. |
|---|---|---|---|
| kpc | km s-1 | ||
| NGC 5631 | 10.5 | 190ddcalculated assuming Vrot=W20/2, with W20 from LEDA. | 1.51011 |
| NGC 5667 | 8.9 | 120 | 5.11010 |
| NGC 5678 | 17.4 | 210 | 3.11011 |