Towards gravitational wave signals from realistic core collapse supernova models
Abstract
We have computed the gravitational wave signal from supernova core collapse using the presently most realistic input physics available. We start from state-of-the-art progenitor models of rotating and non-rotating massive stars, and simulate the dynamics of their core collapse by integrating the equations of axisymmetric hydrodynamics together with the Boltzmann equation for the neutrino transport including an elaborate description of neutrino interactions, and a realistic equation of state. Using the Einstein quadrupole formula we compute the quadrupole wave amplitudes, the Fourier wave spectra, the amount of energy radiated in form of gravitational waves, and the signal-to-noise ratios for the LIGO I and the tuned Advanced LIGO (“LIGO II”) interferometers resulting both from non-radial mass motion and anisotropic neutrino emission. The simulations demonstrate that the dominant contribution to the gravitational-wave signal is produced by neutrino-driven convection behind the supernova shock. For stellar cores rotating at the extreme of current stellar evolution predictions, the core-bounce signal is detectable () with LIGO II for a supernova up to a distance of kpc, whereas the signal from post-shock convection is observable () with LIGO II up to a distance of kpc, and with LIGO I to a distance of kpc. If the core is non-rotating its gravitational wave emission can be measured with LIGO II up to a distance of kpc (), while the signal from the Ledoux convection in the deleptonizing, nascent neutron star can be detected up to a distance of kpc (). Both kinds of signals are generically produced by convection in any core collapse supernova.
Subject headings:
supernovae: general — hydrodynamics — relativity — gravitational waves1. Introduction
For more than two decades astrophysicists struggle to compute the gravitational wave signal produced by core collapse supernovae (for a review, see eg., Müller 1997). If the core collapse and/or the resulting supernova explosion involves time-dependent asphericities such that the third time-derivative of the quadrupole moment of the mass-energy distribution is nonzero, part of the gravitational binding energy liberated in the event will be emitted in the form of gravitational waves. Such non-sphericities can be caused on large scales by the effects of rotation (Müller, 1982; Finn & Evans, 1990; Mönchmeyer et.al , 1991; Yamada & Sato, 1995; Zwerger & Müller, 1997; Rampp, Müller & Ruffert, 1998; Dimmelmeier, Font & Müller, 2002; Fryer, Holz & Hughes, 2002; Fryer et.al , 2003; Imamura, Pickett & Durisen, 2003; Ott et.al , 2003; Shibata, 2003) and low-mode convection (Herant, 1995; Scheck et.al , 2003), on small scales by flow fluctuations due to high-mode convection (Müller & Janka, 1997; Fryer et.al , 2003), and by anisotropic neutrino emission (Epstein, 1978; Burrows & Hayes, 1996; Müller & Janka, 1997).
Theoretical predictions of the gravitational wave signal from core collapse supernovae have been, and still are, hampered by the complex nature of the supernova explosion physics which is not yet fully understood (Buras et.al , 2003). Reliable simulations require realistic (rotating) pre-collapse stellar models, the incorporation of a realistic equation of state (EoS), a detailed modeling of weak interaction processes, Boltzmann neutrino transport, multi-dimensional hydrodynamics, and relativistic gravity. However, all past studies aimed at studying the gravitational wave signature of core collapse supernovae have considered greatly simplified parameterized models involving one, several or all of the following approximations: A polytropic equation of state, a simplified description of weak interactions and neutrino transport or none at all, parameterized pre-collapse stellar models, and Newtonian gravity (Müller, 1982; Finn & Evans, 1990; Mönchmeyer et.al , 1991; Yamada & Sato, 1995; Zwerger & Müller, 1997; Rampp, Müller & Ruffert, 1998; Dimmelmeier, Font & Müller, 2002; Fryer, Holz & Hughes, 2002; Fryer et.al , 2003; Imamura, Pickett & Durisen, 2003; Kotake, Yamada & Sato, 2003; Ott et.al , 2003; Shibata, 2003). In addition, most of these simulations focussed on the effects of rapid rotation, and on the bounce signal covering only the evolution up to a few ten milliseconds after core bounce.
From observations as well as theoretical modeling it is now commonly accepted that core collapse supernovae do generically involve asphericities besides those expected in the case of a progenitor with a sufficiently rapidly rotating core (for a review see, eg., Müller (1998)). These asphericities are important or may be even essential for supernova dynamics (Herant et.al , 1994; Burrows, Hayes & Fryxell, 1995; Janka & Müller, 1996; Buras et.al , 2003). Recent state-of-the-art axisymmetric (2D) simulations using a Boltzmann solver for the transport (Rampp & Janka, 2002; Buras et.al , 2003) and simplified (as far as neutrino transport and neutrino-matter interactions are concerned) three-dimensional (3D) (Fryer & Warren, 2002) simulations both confirm that convective overturn indeed occurs in the heating region and is helpful for shock revival, thus making explosions possible even when spherically symmetric models fail (Janka & Müller, 1996). However, despite of strong convective action and a corresponding enhancement of the efficiency of neutrino energy transfer to the post-shock matter, even the up to now most realistic simulations of both non-rotating and rotating progenitor models do not produce explosions (Buras et.al , 2003). Multi-dimensional simulations further demonstrate that vigorous aspherical motion is unavoidable in the slowly deleptonizing and cooling proto-neutron star (Keil, Janka & Müller, 1996). Both the hot bubble convection (Müller & Janka, 1997) and the convection in the proto-neutron star (see below) as well as the resulting anisotropic neutrino emission (Burrows & Hayes, 1996; Müller & Janka, 1997) give rise to an interestingly large gravitational wave signal.
Concerning consistent pre-collapse stellar models from evolutionary calculations of rotating stars, major progress has recently been achieved by the work of Heger, Langer & Woosley (2000), who have performed the up to now most realistic evolutionary calculations of rotating massive stars to the onset of core collapse including the effects of rotation, mixing, transport of angular momentum, most recently, also of magnetic torques (Heger et.al , 2003). Including the latter the central angular velocities become of the order of 0.1 rad/s only. Despite of these fairly slow rotation rates the cores are still too fast to lead to typically expected neutron star natal spins, and angular momentum loss is considered as a serious problem (Woosley & Heger, 2003). The low iron core rotation rates, however, suggest that in spite of angular momentum conservation during core collapse, triaxial rotation-triggered instabilities need not to be expected in the collapse simulations. For the time being, we therefore constrain ourselves to axisymmetric models.
In the following we present the gravitational wave signatures of the currently most elaborate and detailed core collapse supernova simulations. One of the considered models starts from an iron core with a rotation rate at the onset of collapse that is in the ballpark of predictions from the latest generation of stellar evolution models. The simulation also contains a state-of-the art description of neutrino-matter interactions and Boltzmann neutrino transport, a realistic equation of state, and 2D axisymmetric hydrodynamics taking into account general relativistic effects. We also present the gravitational wave signature of a state-of-the-art non-rotating supernova model. This model, which is based on another, less massive progenitor, serves the purpose to demonstrate that also from non-rotating stars interesting gravitational wave signals can be expected, which are strong enough to be detectable for supernovae that occur even at large distances in our Galaxy. Finally, we present the gravitational wave signal expected from the Ledoux convection in a proto-neutron star at times after the explosion has taken off (s after core bounce).
The paper is organized as follows. In the next section we discuss the physics employed in our models, and the numerical techniques used to perform the simulations. In Section 3 we present the method used to extract the gravitational wave signature, and in Section 4 we describe the results of our investigation. Finally, in Section 5 we discuss the implications of our findings, and give some conclusions.
2. Input physics and numerical techniques.
For integrating the equations of hydrodynamics we employ the Newtonian finite-volume code PROMETHEUS (Fryxell, Müller & Arnett, 1989). This second-order, time-explicit Godunov code is a direct Eulerian implementation of the Piecewise Parabolic Method (PPM) (Colella & Woodward, 1984), and is based on an exact Riemann solver.
We use spherical polar coordinates , and assume axial symmetry. However, motions in the -direction are allowed, and the azimuthal (rotational) velocity may be nonzero. In the rotating model the rotation axis coincides with the symmetry axis at . In this model we have also imposed equatorial symmetry. The 2D computational grid consists of 400 logarithmically spaced zones in radial direction and, if equatorial symmetry is assumed, of 64 equidistant angular zones covering an angular range . If equatorial symmetry is not assumed, the angular grid consists of 128 equidistant zones in the angular range .
The calculations are performed with the equation of state (EoS) of Lattimer & Swesty (1991) using an incompressibility of bulk nuclear matter of 180 MeV. This EoS is based on a compressible liquid-drop model including nuclei, nucleons, , , and photons.
Neutrino transport is computed with the Boltzmann solver scheme described in detail in Rampp & Janka (2002) and Buras et.al (2003) for and of all three flavors. For each angular bin of the numerical grid the monochromatic moment equations for the radial transport of number, energy, and momentum are solved. This set of equations is closed by a variable Eddington factor that is calculated from the solution of the Boltzmann equation on an angularly averaged stellar background. Beyond this “ray-by-ray” approach we also take into account the coupling of neighboring rays by lateral advection terms and pressure gradients (Buras et.al , 2003). For the transport an energy grid of 17 geometrically spaced bins is used with centers from 2 MeV to 333 MeV.
The simulations were done with a Poisson solver that calculates the gravitational potential from the 2D mass distribution. General relativistic effects are treated approximately by modifying the spherical part of the gravitational potential with correction terms due to pressure and energy of the stellar medium and neutrinos, which are deduced from a comparison of the Newtonian and relativistic equations of motion in spherical symmetry (Keil, Janka & Müller, 1996; Rampp & Janka, 2002). The transport contains gravitational redshift and time dilation, but ignores the distinction between coordinate radius and proper radius. Comparison with fully relativistic, one-dimensional simulations showed that these approximations work well at least when the deviations of the metric coefficients from unity are moderate (Liebendörfer et.al , 2003).
We considered two (solar metallicity) progenitor models with main sequence masses of and , respectively (Woosley, Heger & Weaver, 2002). The former progenitor was adopted as given by the stellar evolution calculation (model s11nr180), while angular momentum was added to the progenitor (model s15r; see also Buras et.al 2003). The angular frequency of model s15r was assumed to be constant in the Fe and Si core and to decrease like outside of km (M⊙). This rotation profile is in agreement with predictions from stellar evolution models (Heger et.al , 2003). We have adopted a value of sec-1 for the central angular frequency, which corresponds to an initial value of , where is the ratio of the rotational energy and the (absolute) gravitational binding energy. This is a relatively small rotation rate compared to those typically assumed in parameter studies based on rotating polytropes (see, eg., Zwerger & Müller (1997); Dimmelmeier, Font & Müller (2002); Ott et.al (2003)). However, it is of the order of the largest rotation rates predicted by state-of-the-art evolutionary calculations of massive stars, and even too fast with respect to observed rotation rates of young pulsars (Heger et.al (2003), see also Sect. 5). Hence, as far as the state of rotation is concerned, our model is meant to represent not an extreme, rare case, but is in accord with the conditions in stellar iron cores as expected from current models for the evolution of rotating massive stars. Due to the smallness of the assumed rotation rate we regarded it unnecessary to relax the initial model into rotational equilibrium (the ratio between the centrifugal force and the gravitational force is below 1% in the progenitor model).
We have also analyzed a proto-neutron star model (pns180), which is the analogue of the model discussed in Keil, Janka & Müller (1996), which covered an angular region of only size. Model pns180 provides complementary information about the gravitational wave signal expected from core collapse supernovae, namely the wave emission from the long-lasting (sec) non-radial motion driven by the deleptonization of the forming neutron star. The M⊙ convective core of the proto-neutron star of model pns180 was formed in the core collapse of a M⊙ star (Keil, Janka & Müller, 1996). Its evolution was followed by Keil (1997) for a period of more than 1.2 sec with a variant of the PROMETHEUS hydrodynamics code (see above) assuming axial symmetry and including a flux-limited (equilibrium) neutrino diffusion scheme, which was applied to each angular bin separately (“1.5D”). The computational grid consisted of 100 radial zones extending out to an initial radius of km and 120 equidistant angular zones covering an angular range , ie., no equatorial symmetry was assumed. During the simulated evolution the grid was contracted with the neutron star shrinking to a final radius of about km (Keil, Janka & Müller, 1996).
3. Calculation of the Gravitational Wave Signature
The (quadrupole) gravitational wave amplitudes and energy spectra resulting from anisotropic mass motion are computed as described in Müller & Janka (1997) (eqs. [10]–[12]) using the Einstein quadrupole formula in the numerically convenient formulation derived by Blanchet, Damour & Schäfer (1990), and by standard FFT techniques. The wave amplitudes due to the anisotropic neutrino emission are obtained with the formalism given in Müller & Janka (1997) (eqs. [28]-[31]) which is based on the work of Epstein (1978).
In order to find out whether the gravitational wave signals of our model stars (assumed to be located at some given distance) are detectable by terrestrial gravitational wave experiments we have also computed the corresponding (optimal with respect to the relative orientation of source and detector) signal-to-noise ratios obtained from matched filtering, which are determined by the relation (Flanagan & Hughes, 1998)
| (1) |
where is the Fourier transform of the gravitational wave amplitude and is the spectral density of the strain noise in the detector. Eq. (1) can also be written as
| (2) |
where is the spectral strain sensitivity (see, eg., Fritschel (2002)), which gives the rms noise level of the antenna at the frequency . The second expression for the signal-to-noise ratio (Eq. 2) is useful when discussing the spectra of the gravitational wave signals of our models (see Section 4.2).
In particular, we have determined the signal-to-noise ratios of our models both for the LIGO I and the tuned Advanced LIGO (“LIGO II”) interferometric gravitational wave detectors (Fritschel, 2002). For LIGO I we used a fit to the strain sensitivity curve LIGO I SRD Goal available from the LIGO web site www.ligo.caltech.edu/docs/G/G030014-00/. In case of the tuned Advanced LIGO interferometer we have computed signal-to-noise ratios for the three different strain sensitivity curves shown in Fig. 1.
Concerning the sensitivity curves shown in this plot and some of our other figures, we point out that both the curves for LIGO II as well as the curve for LIGO I are for a single interferometer. In the case of LIGO I, there are two nominally identical 4 km instruments, plus a 2 km instrument at Hanford. This increases the net sensitivity by a factor in the ideal case of statistical independence and gaussian noise. For LIGO II, there are 3 interferometers (two at Hanford, one at Livingston). They could all be tuned the same way for a directed search, or tuned differently. If all are tuned the same way, the net sensitivity is a factor better at all frequencies than that of a single interferometer. The signal-to-noise ratios given in this publication are for the complete detector consisting of two interferometers (LIGO I) or three like-tuned interferometers (LIGO II), respectively.

Assuming axial symmetry and an observer located at an angle with respect to the symmetry axis of the source, the dimensionless gravitational wave amplitude is related to the quadrupole wave amplitude (measured in units of cm), the lowest-order non-vanishing term of a multipole expansion of the radiation field into pure-spin tensor harmonics (see Eq. [9] of Müller 1997), according to
| (3) |
where is the distance to the source. In the following we always assume .
4. Results
4.1. Wave amplitudes
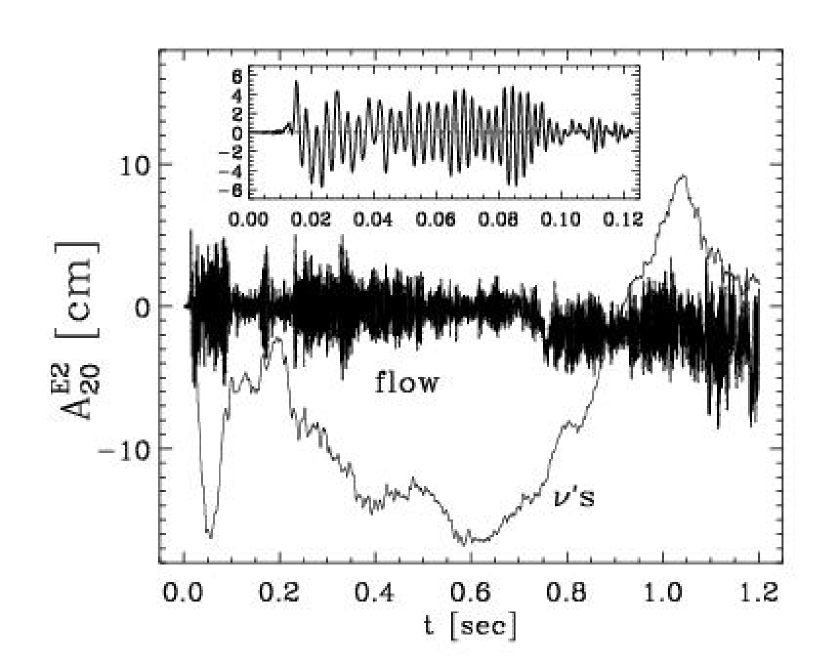
The quadrupole wave amplitudes of models s15r, s11nr180 and pns180 are shown in Figs. 2, 3 and 4, respectively. Besides the waveform resulting from the convective flow, each figure shows the signal due to the anisotropic neutrino emission. Inserts further illustrate details of the wave signal for chosen periods of time, and demonstrate that the wave signal consists of many quasi-periodic variations on time scales of a few milliseconds which remain unresolved when the whole time evolution of the models is shown.
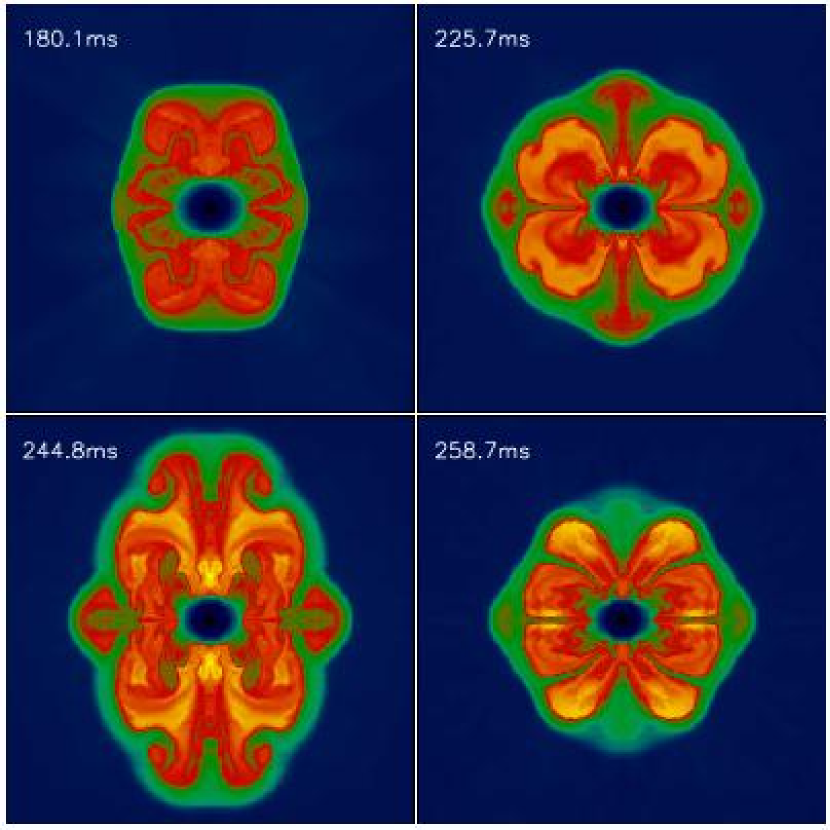
The quadrupole wave amplitude (Eq. 3) of model s15r at bounce is of the order of 20 cm showing (see insert of Fig. 2) the typical prominent spike with subsequent ring-down of a type I gravitational wave signal of a rotating core, which bounces due to the stiffening of the equation of state around nuclear matter density (Mönchmeyer et.al , 1991). The post-bounce wave amplitude stays below cm until about 150 msec when convective mass motions driven by neutrino heating in combination with the increasing rotation rate of the post-shock region amplify the wave signal. The growing rate of rotation of the post-shock region is caused by the accretion of matter with higher angular momentum (as the initial rotation profile is constant to the edge of the Fe core) through the shock, and the specific angular momentum increasing even beyond the edge of the iron core. The post-shock region starts to exhibit large-scale non-radial pulsations (Fig. 5) which produce a long-time (msec) variability on top of the rapidly varying (msec) wave signal of up to 130 cm amplitude.


The non-rotating, and hence initially spherically symmetric model s11nr180 shows, as expected, no signal at bounce (Fig. 3). Until 50 msec after bounce the wave amplitude of this model remains tiny (cm). Only when the neutrino-driven convection sets in at around msec to msec, the wave amplitude grows to the size of a few centimeters. Eventually, as the convective activity becomes stronger, the maximum (absolute) amplitudes rise to values of several 10 centimeters.
Both models, the rotating (s15r) as well as the non-rotating one (s11nr180), do not explode within the displayed time intervals. After an explosion has started we expect a slow decay of the convective activity behind the expanding supernova shock, and hence a declining gravitational wave amplitude from this region over a period of a few msec. The gravitational wave signal afterwards will be dominated by the emission from convection inside the cooling nascent neutron star.
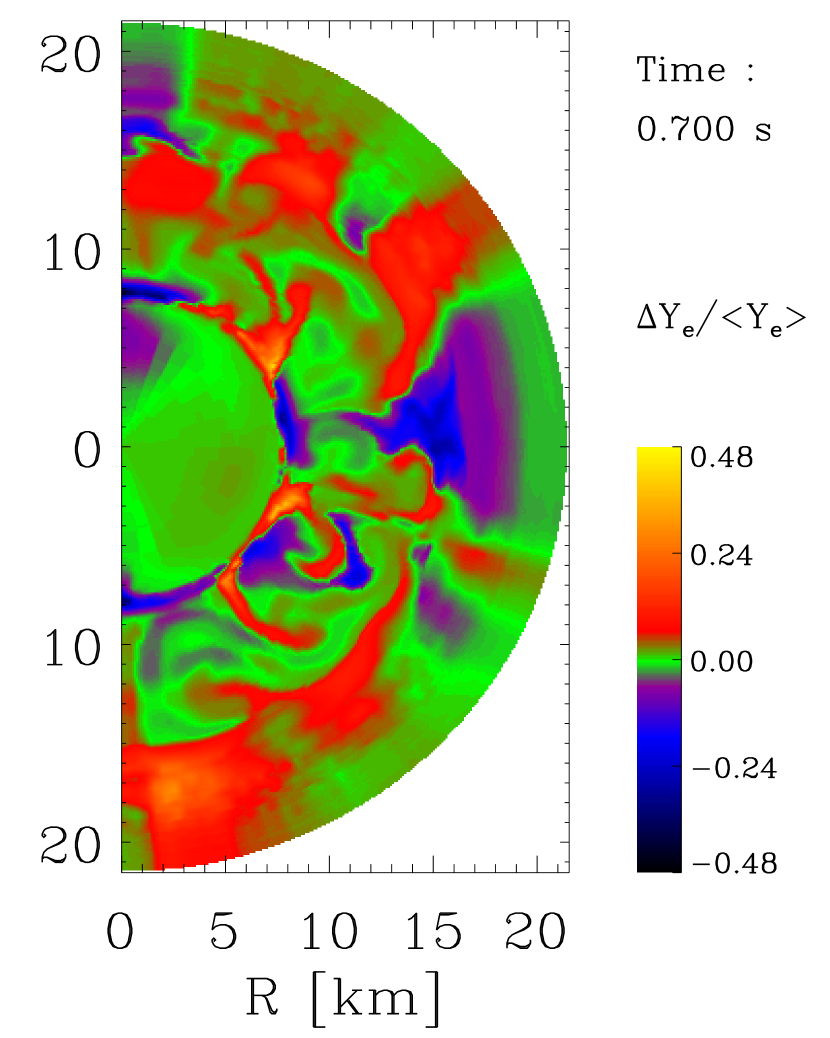
The proto-neutron star model exhibits a gravitational wave signal consisting of rapid (msec) quasi-periodic temporal variations of roughly constant amplitude (cm) modulated on time scales of ms (Fig. 4). While the former variations reflect mass motions, and non-radial proto-neutron star oscillations occurring on the hydrodynamic (sound crossing) time scale, the long-time signal modulations are caused by the varying strength of the activity due to Ledoux convection in the proto-neutron star (Fig. 6).
The wave amplitude associated with anisotropic neutrino emission shows much less time structure and slower temporal variation than that produced by non-radial mass motion. It is characterized by an overall rise of the wave amplitude in case of the rotating model s15r, a quasi-periodic oscillation with a time scale of msec in case of the non-rotating model s11nr180, and an even slower temporal variation (—sec) in case of the proto-neutron star model pns180.
In case of the rotating model (s15r) the temporal variation of the quadrupole wave amplitude of the neutrinos reflects the time scale of the large-scale, non-radial pulsations exhibited by the post-shock region ( to msec; Fig. 5), while the short-time variations ( msec) of the wave amplitude of the mass flow are caused by the convective activity in the hot bubble region. The overall rise of the wave amplitude of the neutrinos is a consequence of the steadily increasing rotation rate (accretion of matter with higher angular momentum) and thus growing rotational flattening of the nascent neutron star. In the non-rotating model (Fig. 3) and the proto-neutron star model (Fig. 4) the temporal variations of the wave amplitudes of the neutrinos are caused by large-scale, localized neutrino-emitting downflows through the neutrino-heated bubble, and by global changes in the location and shape of the convective emission regions, respectively.
4.2. Wave spectra and signal-to-noise ratios
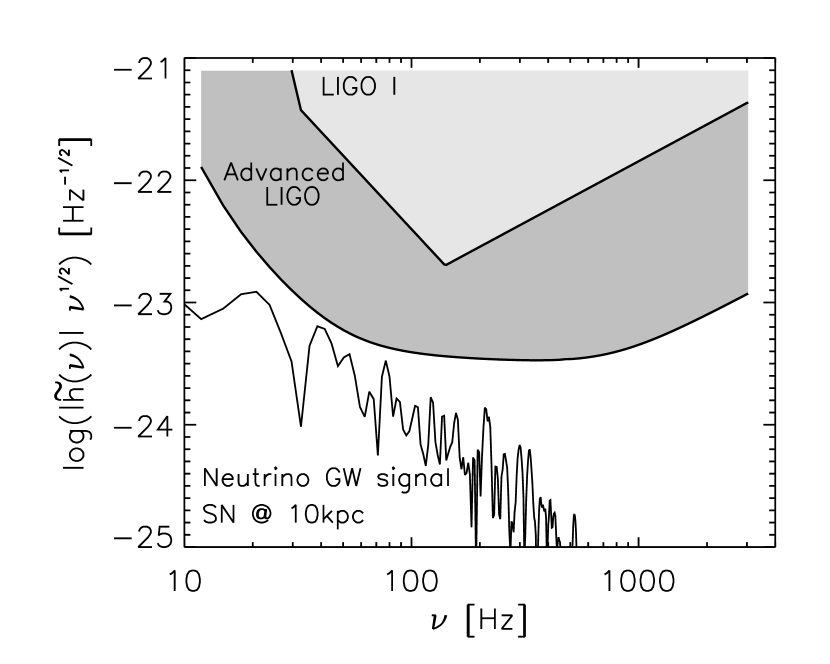
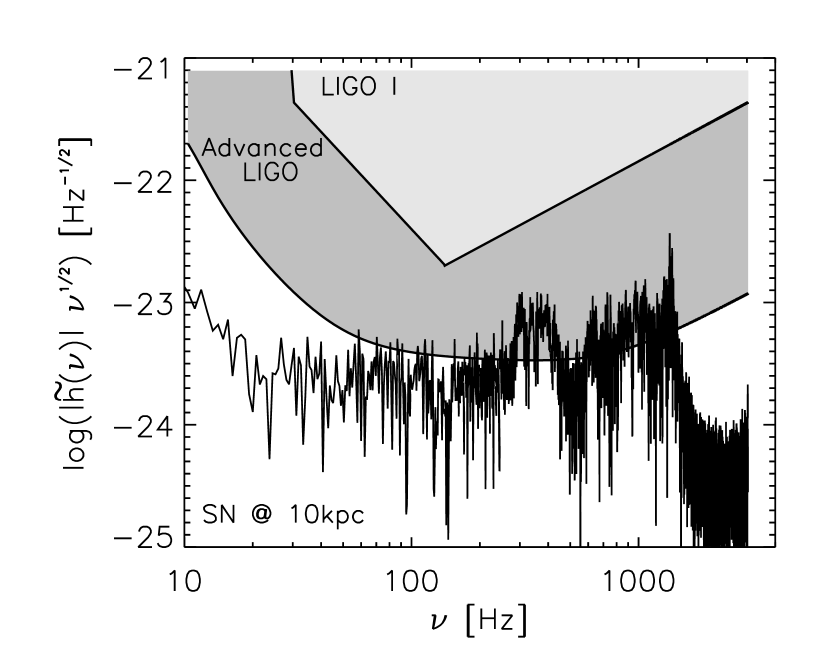
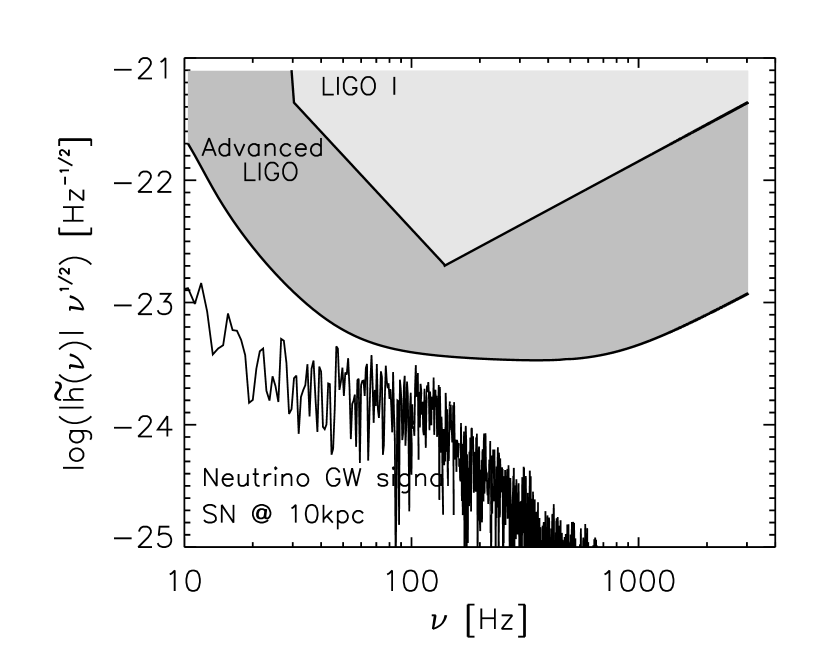
In Figs. 7 to 13 we show the (logarithm) of the quantity appearing in the numerator of Eq. (2). Each figure further gives , the rms noise level (see denominator of Eq. 2) of a LIGO I and LIGO II single interferometer (cf. Sect. 3) as a function of the frequency , the LIGO II curve being the solid curve of Fig. 1. Both quantities determine the signal-to-noise ratio (), which is given for all models and both antennae in Table 1 using again the solid sensitivity curve of Fig. 1. We remind the reader that the values are computed for the complete LIGO I and LIGO II detectors as explained in Sect. 3.
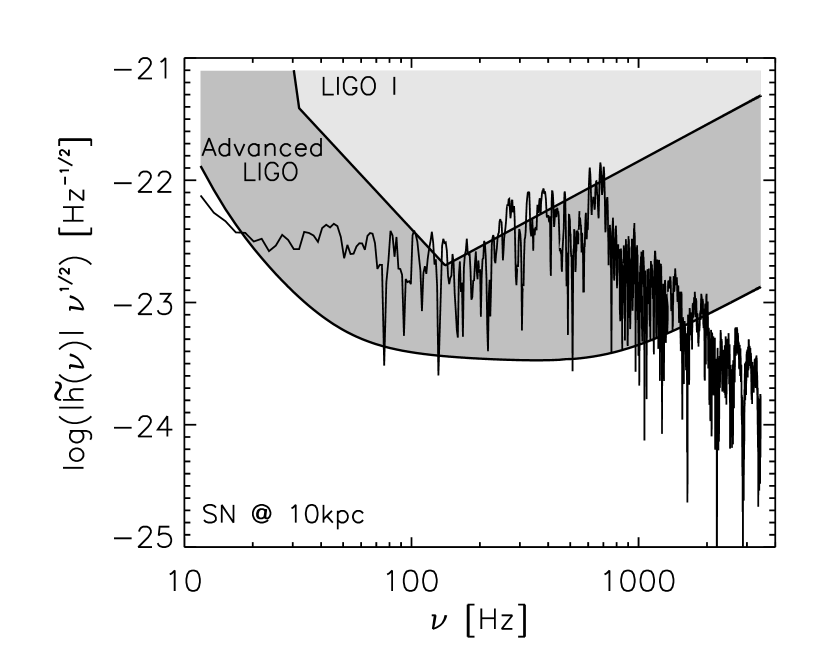


The spectrum of the complete wave train of model s15r caused by both anisotropic mass flow and neutrino emission is displayed in Fig. 7 for a supernova at a distance of kpc. It rises to a broad peak between Hz and Hz and then declines rapidly at higher frequencies. The figure indicates that while the signal-to-noise ratio is probably too small for this event to be detectable by LIGO I, it could be very well detected by LIGO II. This is confirmed by the signal-to-noise ratios computed from Eq. (2) (using the solid sensitivity curve of Fig. 1), which are 3.7 and 67 for the LIGO I and LIGO II detectors, respectively (Table 1). Even at a distance of kpc the signal-to-noise ratio is still for LIGO II, ie., it is probably sufficiently large for a detection of the event (Flanagan & Hughes, 1998). Comparing Fig. 7 with Fig. 8, which shows the spectrum resulting from anisotropic neutrino emission alone, one recognizes that the low-frequency part of the spectrum (below Hz) is dominated by the contribution of the neutrinos, because their quadrupole wave amplitude varies on much longer time scales than that of the mass flow (Fig. 2).
When we Fourier transform just the bounce signal (insert in Fig. 2), ie., the wave signal up to msec past core bounce, we find that its spectrum peaks at a somewhat higher frequency of Hz (Fig. 9) than that of the complete signal. The signal-to-noise ratios drop to 0.7 (LIGO I) and 14 (LIGO II) even when the source is located at a smaller distance of kpc (Table 1).
The spectrum of the non-rotating model s11nr180 (Fig. 10) is qualitatively quite similar to that of the rotating model s15r (Fig. 7), but the corresponding signal-to-noise ratios are much smaller for a source located at the same distance (kpc): (LIGO I) and (LIGO II), respectively (Table 1). Thus, while a non-rotating supernova (model s11nr180) is detectable with LIGO II up to a distance of kpc, a massive star rotating at a rate in the ballpark of predictions by state-of-the-art stellar evolution models will produce a gravitational wave supernova signal which can clearly be seen by LIGO II throughout the Galaxy and in the Magellanic Clouds, and by LIGO I if the supernova occurs less than kpc away from Earth, a distance limit that encompasses all historical Galactic supernovae. As in case of the rotating model, the low frequency part of the spectrum of model s11nr180 is dominated by the contribution from anisotropic neutrino emission (Fig. 11) because of the slower temporal variation of the corresponding quadrupole wave amplitude (Fig. 3).

| model | D [kpc]bbsource distance | S/N I | S/N II | ccradiated gravitational wave energy |
|---|---|---|---|---|
| s15r | 10 | 3.7 | 67 | |
| s15r bncddonly bounce signal of model s15r | 3 | 0.7 | 14 | |
| s11nr180 | 10 | 0.6 | 13 | |
| pns180 | 10 | 0.4 | 8 |
According to our results the “long time” (sec) gravitational wave signal produced by all core collapse supernova events due to convective activity inside the proto-neutron star is detectable with LIGO II () up to a distance of kpc (Fig. 12 and Table 1). The spectrum displays a narrow dominant peak at kHz, and two additional, weaker broad maxima centered at kHz and Hz. Anisotropic neutrino emission again dominates the spectrum at frequencies below Hz (Fig. 13). We point out here that the convective activity in the proto-neutron star may continue beyond the time period covered by our simulation, perhaps lasting more than sec until the deleptonization is complete and the convective motion gets damped by viscous effects. Assuming that the amplitude and the spectrum of the gravitational wave emission does not change considerably during this time, the signal-to-noise ratios quoted for this model in Table 1 may increase by a factor of , as they depend linearly on the size of the Fourier amplitude which grows proportional to the length of the signal.
The signal-to-noise ratios given in Table 1 for the complete tuned Advanced LIGO depend somewhat, but not extremely, on the choice of the sensitivity curve. In case of model s15r the signal-to-noise ratio increases only slightly from 67 to 71 and 70 when using the dotted and dashed curves of Fig. 1, respectively. The corresponding signal-to-noise ratios for model s11nr180 are 13, 17 and 10, and those for model pns180 are 8, 5 and 8. Hence, for the latter two models tuning of the senstivity curve for source optimization can increase the S/N values by up to 70%.
4.3. Amount of Radiated Energy
The energy radiated in the form of gravitational waves is given by (see eg., Eqs. [22], [26] and [28] in Zwerger & Müller (1997))
| (4) | |||||
| (5) |
where is the Fourier transform of , and and are the speed of light in vacuum and Newton’s gravitational constant, respectively. We used both expressions above to compute the radiated energy, and found for all three models very good agreement with numerical differences only in the few percent range.
Our analysis implies that non-spherical core collapse supernovae rotating with rates in the ballpark of predictions by state-of-the-art evolutionary calculations of massive stars emit an energy of a few ( is the solar mass) in the form of gravitational radiation (Table 1). This number might increase for stars more massive than the considered progenitor, and is reduced by roughly one order of magnitude when non-rotating cores or the emission of convective proto-neutron stars are considered. Anisotropic neutrino emission does not contribute much to the amount of radiated energy, as the corresponding quadrupole wave amplitudes show a slower and smaller temporal variation than those due to the non-spherical mass flow.
5. Discussion and conclusions
We have presented the gravitational wave signature of core collapse supernovae using the presently most realistic input physics available. Our analysis is based on state-of-the-art progenitor models of rotating and non-rotating massive stars, whose axisymmetric core collapse is simulated by integrating the hydrodynamic equations together with the Boltzmann equation for the neutrino transport including an elaborate description of neutrino interactions, and a realistic equation of state. We have computed the quadrupole wave amplitudes, the Fourier wave spectra, the amount of energy radiated in form of gravitational waves, and the signal-to-noise ratios for the LIGO I and LIGO II detectors resulting both from non-radial mass motion and anisotropic neutrino emission.
The results show that the dominant contribution to the gravitational wave signal is not produced by the core bounce itself, but instead by the neutrino-driven convection in the post-shock region lasting for up to several hundred milliseconds post bounce. This finding is qualitatively different from that of previous core collapse simulations which have been performed with greatly simplified parameterized models involving (i) a polytropic equation of state, and/or (ii) a simplified description of weak interactions and neutrino transport or none at all, and/or (iii) parameterized pre-collapse stellar models, and/or (iv) Newtonian gravity. We further find that the contribution to the signal from anisotropic neutrino emission is dominant at frequencies below Hz, while non-spherical mass flow dominantly contributes in the range between Hz and Hz. Besides the neutrino-driven convection in the post-shock region, the Ledoux convection inside the deleptonizing proto-neutron star also gives rise to an important gravitational wave signal from core collapse supernovae.
For a stellar iron core rotating with a central angular frequency of s-1, which is relatively small compared to the rotation rates typically assumed in parameter studies based on rotating polytropes (see, eg., Zwerger & Müller (1997); Dimmelmeier, Font & Müller (2002); Ott et.al (2003)), but which is of the order of the largest rotation rates predicted by state-of-the-art evolutionary calculations of massive stars (Heger et.al , 2003), the core bounce signal would be detectable () with LIGO II for a supernova up to a distance of kpc. However, the signal caused by neutrino-driven convection is observable with LIGO II up to a distance of kpc, and even with LIGO I to a distance of kpc.
Due to the smallness of the assumed initial rotation rate we do not expect any significant growth of non-axisymmetric instabilities (eg., bar modes) even after core collapse when angular momentum conservation leads to a spin-up of the core. For the same reason there also occurs no centrifugal hang-up, but a regular bounce at about nuclear matter density. Consequently, the gravitational wave (bounce) signal is not of type II consisting of several distinct spikes, but of type I with one prominent spike at bounce followed by a ring-down (Mönchmeyer et.al , 1991).
As far as the initial state of rotation is concerned, our model represents not an extreme, rare case, but is in accord with more typical iron core conditions as expected from the evolution of rotating massive stars. We point out here that most models used in previous investigations have too large rotational rates in comparison to those observed for newborn pulsars (see eg., Kotake, Yamada & Sato (2003)). Even our initially quite slowly rotating model will produce a pulsar spinning with a period, , between 1 and msec (depending on its final radius of 10–km and assuming angular momentum conservation in the neutron star after the end of our simulations), which is not far from the breakup limit. Millisecond pulsars have rotational energies . If such rapid rotators have to be slowed down to match the rotation rates of observed young pulsars, which is difficult to achieve on short time scales (Woosley & Heger, 2003), the question arises where all this rotational energy has gone, if it is not observable in kinetic energy or electromagnetic radiation from the supernova or pulsar? R-modes do also no longer appear as a likely energy drain (Arras et.al , 2003).
If the core is non-rotating (model s11nr180) its gravitational wave signal due to aspherical motion in the neutrino-heated bubble and due to anisotropic neutrino emission is detectable () with LIGO II up to a distance of kpc, while the signal from the Ledoux convection (model pns180) in the deleptonizing proto-neutron star can be measured at least to a distance of kpc. Both kinds of signals are generically produced in any core collapse supernova.
As our models are axisymmetric, the results may change when 3D effects associated with the convection inside the proto-neutron star and in the hot bubble region are included. Both phenomena are genuinely three dimensional. In this respect the simulations of Fryer & Warren (2002), and their analysis of the gravitational wave emission (Fryer et.al , 2003) may provide an answer to this uncertainty in our results. These authors find that the size and dynamics of the convective structures are similar to those in axisymmetric simulations.
Finally, we want to mention another mechanism which causes a gravitational wave signal in core collapse explosions. Recent simulations by Scheck et.al (2003) indicate that the proto-neutron star is accelerated during the explosion at a rate of up to km/sec2, resulting in large kick velocities in some models. The acceleration can be caused either by asymmetric accretion onto the proto-neutron star, or by the pull of the gravitational potential of matter distributed asymmetrically in the surrounding hot bubble region. Due to the erratic behavior of the accretion downflows the acceleration can temporarily change sign leading to an additional oscillatory component superimposed on or preceding the steady acceleration component.
An order of magnitude estimate of the resulting scale of the gravitational wave signal can be obtained by approximating the proto-neutron star by a point mass (initially at rest), which eg., moves in positive -direction starting at . If the point mass experiences a constant acceleration for a time , its displacement is given by . The only non-vanishing (Cartesian) component of the time-dependent quadrupole moment (measured with respect to the origin of the coordinate system) of such a moving point mass is . The lowest (quadrupole) order contribution to the gravitational wave luminosity of such a moving point mass is due to the temporal variation of its quadrupole moment (Thorne, 1980), and is given by , which can be written as
| (6) |
where is the acceleration in units of km/sec2, and the time of acceleration, measured in seconds. If the motion of the point mass (initially at rest at ) is caused by a periodic acceleration of amplitude and time scale , ie., , the resulting gravitational wave luminosity is given by , or by
| (7) |
where is the acceleration in units of km/sec2, and the oscillation time scale, measured in units of sec. From their simulations Scheck et.al (2003) infer , , , and for the proto-neutron star of mass . Hence, the gravitational wave signal from the acceleration giving rise to the kick of the proto-neutron star is quite small (), and the signal from the oscillatory motion of the proto-neutron star is even smaller (). The former signal is expected to have a frequency of typically Hz, and the latter one should be dominant at about 10 to Hz.
Both signals are very small compared to the signal caused by the bounce of a rotating core, because the accelerations encountered during core bounce are much larger. The accelerations, which cause the varying quadrupolar deformation of the rotating core, are of the order km/sec2, ie., they are roughly a factor of larger than those producing the kick or the oscillatory motion of the proto-neutron star. These accelerations act for only msec (the damping time scale of the post-bounce ringing; see eg., the insert in Fig. 2), which is a factor () shorter than (), and involve a mass of only , which is a factor smaller than . Nevertheless, as scales bi-quadratically with the acceleration and only quadratically with the mass and time scale (see Eqs. 6 and 7), the gravitational wave luminosity of rotational core bounce exceeds that of the proto-neutron star (kick and oscillatory) motion by a factor to .
References
- Arras et.al (2003) Arras, P., Flanagan, E.E., Morsink, S.M., Schenk, A.K., Teukolsky, S.A. & Wasserman, I. 2003, ApJ, 591, 1129
- Blanchet, Damour & Schäfer (1990) Blanchet, L., Damour, T. & Schäfer, G. 1990, MNRAS, 242, 289
- Buras et.al (2003) Buras, R., Rampp, M. Janka, H.-T. & Kifonidis, K. 2003, Phys. Rev. Lett., 90, 241101
- Burrows & Hayes (1996) Burrows, A. & Hayes, J. 1996, Phys. Rev. Lett., 76, 352
- Burrows, Hayes & Fryxell (1995) Burrows, A., Hayes, J. & Fryxell, B.A. 1995, ApJ, 450, 830
- Colella & Woodward (1984) Colella, P. & Woodward, P.R. 1984, J.Comp.Phys., 54, 174
- Dimmelmeier, Font & Müller (2002) Dimmelmeier, H., Font, J.A. & Müller, E. 2002, A&A, 393, 523
- Epstein (1978) Epstein, R. 1978, ApJ, 223, 1037
- Finn & Evans (1990) Finn, L.S. & Evans, C.R. 1990, ApJ, 351, 588
- Flanagan & Hughes (1998) Flanagan, E.E. & Hughes, S.A. 1998, Phys. Rev. D, 57, 4535
- Fritschel (2002) Fritschel, P. 2002, Second generation instruments for the Laser Interferometer Gravitational Wave Observatory (LIGO) (Waikoloa, HI, 2002) (Proc. SPIE vol 4856-39), pp 282-291 (LIGO P020016-00-R)
- Fryer & Warren (2002) Fryer, C.L. & Warren, M.S. 2002, ApJ, 574, L65
- Fryer, Holz & Hughes (2002) Fryer, C.L., Holz, D.E. & Hughes, S.A. 2002, ApJ, 565, 430
- Fryer et.al (2003) Fryer, C.L., Holz, D.E., Hughes, S.A. & Warren, M.S. 2003, astro-ph/0211609, to appear in ”Stellar Collapse” (Astrophysics and Space Science), edited by C.L. Fryer
- Fryxell, Müller & Arnett (1989) Fryxell, B.A., Müller, E. & Arnett, W.D. 1989, Preprint MPA-449 (Max-Planck-Inst. für Astrophysik, Garching, Germany)
- Heger, Langer & Woosley (2000) Heger, A., Langer, N. & Woosley, S.E. 2000, ApJ, 528, 368
- Heger et.al (2003) Heger, A., Woosley, S.E., Langer, N. & Spruit, H. 2003, astro-ph/0301374, to appear in Stellar Rotation, IAU Symp. No. 215, eds. A. Maeder & P. Eenens; and ApJ, in preparation
- Herant et.al (1994) Herant, M., Benz, W., Hix, W.R., Fryer, C.L. & Colgate, S.A. 1994, ApJ, 435, 339
- Herant (1995) Herant, M. 1995, Phys. Rep., 256, 117
- Imamura, Pickett & Durisen (2003) Imamaura, J.N., Pickett, B.K. & Durisen, R.H. 2003, ApJ, 587, 341
- Janka & Müller (1996) Janka, H.-Th. & Müller, E. 1996, A&A, 306, 167
- Keil (1997) Keil, W. 1997, PhD Thesis, Technical University Munich, Germany
- Keil, Janka & Müller (1996) Keil, W, Janka, H.-Th. & Müller, E. 1996, ApJ, 473, L111
- Kifonidis et.al (2003) Kifonidis, K., Plewa, T., Janka, H.-Th. & Müller, E. 2003, A&A, 408, 621
- Kotake, Yamada & Sato (2003) Kotake, K., Yamada, S. & Sato, K. 2003, Phys.Rev., D68, 044023
- Lattimer & Swesty (1991) Lattimer, J.M & Swesty, F.D. 1991, Nucl. Phys. A, 535, 331
- Liebendörfer et.al (2003) Liebendörfer, M., Rampp, M., Janka, H.-T. & Mezzacappa, A. 2003, in preparation
- Mönchmeyer et.al (1991) Mönchmeyer, R., Schäfer, G., Müller, E., & Kates, R. 1991, A&A, 246, 417
- Müller (1982) Müller, E. 1982, A&A, 114, 53
- Müller (1997) Müller, E. 1997, in Relativistic Gravitation and Gravitational Radiation, eds. J.-A. Marck & J.-P. Lasota, CUP, p.273
- Müller (1998) Müller, E. 1998, in Computational Methods for Astrophysical Fluid Flow, eds. O. Steiner & A. Gautschy, Springer, p.343
- Müller & Janka (1997) Müller, E & Janka, H.-Th. 1997, A&A, 317, 140
- Ott et.al (2003) Ott, C.D., Burrows, A., Livne, E. & Walder, R. 2003, astro-ph/0307472, ApJ, in press
- Rampp & Janka (2002) Rampp, M. & Janka, H.-Th. 2002, A&A, 396, 361
- Rampp, Müller & Ruffert (1998) Rampp, M., Müller, E., & Ruffert, M. 1998, A&A, 332, 969
- Scheck et.al (2003) Scheck, L., Plewa, T., Janka, H.-T., Kifonidis, K. & Müller, E. 2003, astro-ph/0307352, Phys. Rev. Lett., submitted
- Shibata (2003) Shibata, M. 2003, Phys. Rev. D, 67, 024033
- Thorne (1980) Thorne, K.S. 1980, Rev. Mod. Phys, 52, 285
- Woosley & Heger (2003) Woosley, S.E. & Heger, A. 2003, astro-ph/0301373, to appear in Stellar Rotation, IAU Symp. No. 215, eds. A. Maeder & P. Eenens
- Woosley, Heger & Weaver (2002) Woosley, S.E., Heger, A. & Weaver, T.A. 2002, Rev. Mod. Phys., 74, 1015
- Yamada & Sato (1995) Yamada, S., & Sato, K. 1995, ApJ, 450, 245
- Zwerger & Müller (1997) Zwerger, T., & Müller, E. 1997, A&A, 320, 209