X–ray/optical observations of A0535+26/HDE 245770 in quiescence
Abstract
We present the result of three BeppoSAX observations of the X–ray binary pulsar A0535+26 in its quiescent state. The source is quite well detected up to 200 keV ( detection in the stronger observation). No Iron line is detected in the MECS data ( upper limit on its equivalent width of 150 eV). There is evidence of a soft excess below 2 keV. Pulsation is detected in all energy bands up to 10 keV, with a pulsed fraction of , not varying with energy. There is a marginal detection () of a cyclotron resonance feature (CRF) at keV in the PDS spectrum. During the BeppoSAX observations HDE 245770, the optical counterpart to A0535+26, was monitored spectroscopically and photometrically. These observations show that the and lines previously observed in absorption returned in emission, indicating that the Be disk formed again. The presence of pulsation and a CRF is a clear indication that accretion onto the polar caps is occurring, and that the propeller mechanism is leaking. The presence of a soft excess could be explained either in terms of thermal emission ( keV) from the neutron star surface, as observed in other accreting X–ray pulsars, or in terms of an overabundance of Mg in the circumstellar matter.
1 INTRODUCTION
The class of High Mass X–ray binaries containing a Be star (Be/HMXRBs) is characterized by transient X–ray outbursts, sometimes reaching Eddington luminosities, interleaved by intervals of low luminosity ( erg/s). It is possible to distinguish two types of outbursts [1]: Type I outbursts, lasting few days and due to the increase of the accretion rate onto the neutron star as it approaches the periastron along the eccentric () orbit; and Type II outbursts (also called “giant” outbursts), lasting tens of days and thought to be due to sporadic episodes of mass ejection from the Be star. The details of the accretion onto the neutron star are complicated by the poorly known outflow mechanism in Be stars: because of the strong spinning of these stars, close to 70% of their break-up velocity [2], circumstellar material will accumulate in the equatorial region in the form of a quasi-Keplerian disk. Type I outbursts are thought to originate when the neutron star passes through this slow, dense disk. Quite recently, theoretical works [3, 4] have shown that tidal interactions can produce truncation of the Be disk at a distance smaller than the periastron separation, suppressing the X–ray activity, and therefore explaining the missing of some Type I outbursts. In this model, long term ( years) cycles arise as stellar material accumulate in the Be disk until tidal interactions sweep it away. The precession/warping of the Be disk accounts for the irregularity of the Type II outburst recurrences.
The study of the quiescent emission in Be/HMXRBs can give important clues on the accretion flow geometry because of the tremendous difference in luminosity in the quiescent and outburst states (more than three orders of magnitude). In particular, we expect that the region responsible for the X–ray emission passes from being optically thick at high luminosity to be optically thin in quiescence, because of the formation of a collision-less shock above the polar caps of the neutron star during outburst states [5]. These variations in X–ray luminosity are responsible of dramatic variations in the pulse shape [6], because for erg/s X–ray photons escape mainly in a direction perpendicular to the magnetic field lines (fan beam emission pattern), while at lower luminosities photons are emitted mainly in a direction parallel to the magnetic field lines (pencil beam). The comparison of pulse shapes at different luminosities (quiescent vs outburst phase, but also at different orbital phases during quiescence) can give therefore some clues on the emission pattern geometry.
Furthermore, the study of the quiescent state in Be/HMXRBs can give important information on the properties of mass accretion at very low accretion rates, and on the possible onset of a propeller state (see Section 4 below), in which the accretion onto the neutron star is centrifugally inhibited.
In this paper we present the results of a campaign of observations performed by BeppoSAX in order to study the quiescent emission of A0535+26 at different orbital phases, and therefore at different luminosity levels. Simultaneous optical observations of HDE 245770 performed at the 1.5m Cassini Telescope of the Bologna Astronomical Observatory are also presented.
2 A0535+26
A0535+26 is the prototype of the Be/HMXRBs. It was discovered during a Type II outburst in 1975 [7, 8], and since then three other giant outbursts and about a dozen of normal outbursts have been observed [9]. X–ray pulsations at 104 s have been detected both during outburst [10] and in quiescence [11]. Because of the long database of observations it was possible to resolve the binary system [12], that exhibits an orbital period of 111 days, and an eccentricity of 0.47. The optical counterpart to A0535+26 is HDE 245770 [13], of spectral type O9.7IIIe–B0Ve [14]. The Be star presents photoelectric variability correlated to the X–ray behavior of A0535+26 [15]: in particular the luminosity reached its maximum in 1975 ( [16]), in correspondence of a giant X–ray outburst. The minimum was observed in 1998 ( [16]), when the optical spectrum showed a dramatic change, with the emission lines slowly changing from emission to absorption. This phenomenon is interpreted in terms of Be disk loss [17].
3 OBSERVATIONS AND RESULTS
3.1 X–ray observations
A0535+26 was observed three times at different orbital phases by the Narrow Field Instruments (NFIs) aboard the Italian-Dutch satellite BeppoSAX [18]: LECS (0.5–10 keV [19]), MECS (1.8–10 keV [20]), and PDS (15–200 keV [21]). During the whole campaign the HPGSPC [22] was switched off. The log of the observations, together with the observed NFIs count rates are reported in Table 1. The first two observations, in which the neutron star approaches the periastron, show the same intensity, while the third observation, after the periastron passage, has an almost double count rate in all the NFI energy bands.
| OP | Start Time | Length | (10-2 C/s) | Orbital | |||
| # | (UT) | (sec) | LECS | MECS | PDS | Phasea | |
| (0.5–2) | (2–10) | (15–200) | |||||
| OBS1 | 09736 09738 | 04/09/00 05:14:05 05/09/00 00:41:56 | 0.606–0.618 | ||||
| OBS2 | 09923 09924 | 05/10/00 00:42:46 06/10/00 04:29:26 | 0.883–0.903 | ||||
| OBS3 | 10835 10836 10837 | 05/03/01 22:52:38 07/03/01 02:39:28 08/03/01 06:25:58 | 0.251–0.276 | ||||
| a Ephemeris from Finger (private communication): | |||||||
3.1.1 Timing analysis

During each BeppoSAX observation the source was quite stable, with time variability on time scales of the order of hundreds of seconds and intensity variability within a factor two (see Fig. 1 with the OBS3 light curve as observed in two MECS energy bands. Gaps in the data are due to passages in the South Atlantic Geomagnetic Anomaly, when the NFIs are switched off). The / keV hardness ratio does not show any variation during the observations.
After correcting photon arrival times to the solar system barycenter, MECS data were searched for periodic signals by performing an epoch folding search and the result is shown in Fig. 2 for OBS3. Data were not corrected for the A0535+26 orbital motion because of the short duration of the observation with respect to the orbital period of 111 days. Our result of s is in agreement with the other quiescent pulse period measurements [9, 23], confirming that the source is accreting material and channeling it onto the neutron star polar caps even when in quiescence.

In Fig. 3 we show the LECS and MECS pulse profiles as a function of energy for all the three observations (we were not able to extract pulse profiles from the PDS instrument, because of the very low statistics). In the first observation the source displays a double peak profile, typical of the high energy band [24, 6]. In OBS2 the pulse is clearly single peaked, of the same kind observed by RXTE at orbital phase 0.64 [23], while in the third it is structured, with the presence of a pronounced first peak and a smaller second one. The pulse fraction within the uncertainties, does not depend on energy, as it is shown in Fig. 4 for OBS3. Our result is in agreement with the pulse fraction of 0.53 measured by [23].


| OBS1 | OBS2 | OBS3 | |
| Power Law | |||
| NH (1022 cm-2) | |||
| (dof) | 0.90(68) | 1.17(98) | 1.33(208) |
| Bremsstrahlung | |||
| NH (1022 cm-2) | |||
| (keV) | |||
| (dof) | 0.90(68) | 1.07(98) | 1.17(208) |
| Black Body | |||
| (keV) | |||
| (Km) | |||
| (dof) | 1.37(69) | 1.23(99) | 1.30(209) |
| Lx (0.5–2 keV)b | 0.6 | 0.5 | 1.2 |
| Lx (2–10 keV)b | 1.5 | 1.5 | 4.4 |
| a Uncertainties at 90% confidence level for a single parameter | |||
| b Un-absorbed luminosities in erg/s assuming a distance kpc [27] | |||
3.1.2 Spectral analysis
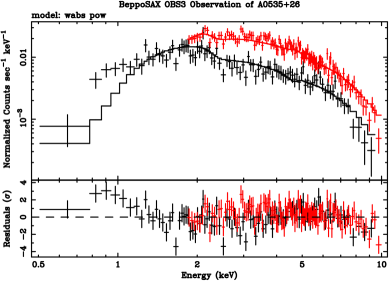
The LECS and MECS energy spectra for all the observations were extracted using standard procedures, as outlined in [25]. The combined LECS/MECS spectra are well fit both by an absorbed power law and a thermal bremsstrahlung. Also a blackbody fit is statistically acceptable, but the resulting emitting region is unphysically small (see [26] on this topic), and no absorption is required. These results are in agreement with [23], and are listed in Table 2. In Fig. 5 we show the power law fit for the third observation, in which a soft excess below 2 keV is quite evident. This excess can be modeled both with the addition of a black body component ( keV; /dof = 213.5/206), or by an over-abundance of Mg in the circumstellar matter ( times the Solar abundance; /dof = 232.5/208). Our data do not show the presence of an iron -shell line in 6.4–6.9 keV: the 3 upper limit on its equivalent width is 150 eV.
For extraction of the PDS net spectra we used the standard procedure [28] for all the observations but the third where one of the offset fields used for the determination of the background was contaminated by the Crab nebula, and therefore could not be used in the pipeline. In all the observations A0535+26 is clearly detected in the PDS (see Table 1) up to 200 keV. To our knowledge, this is the first detection up to these energies of the quiescent state of A0535+26. Because of the low statistics only a power law model could reasonably be applied for fitting the PDS spectra. The best fitting results are listed in Table 3. These results indicate a hardening of the spectrum for E15 keV consistent with observed by HEXE (15–200 keV) on-board MIR during an outburst [6].

| OBS1 | OBS2 | OBS3 | |
| (dof) | 0.55(8) | 0.86(8) | 0.86(8) |
| CRF best fit parameters | |||
| (keV) | |||
| (keV) | |||
| E.W. (keV) | |||
The PDS spectra for OBS2 and OBS3 do not show any deviation from the power law fit, while the OBS1 spectrum presents structured residuals in the range 100–200 keV (see the slightly worse for OBS1 in Table 3). Because of a previous observation by OSSE [29] of a cyclotron resonance feature (CRF) at 110 keV (observed during a giant outburst), we tried to model the feature with a Gaussian in absorption [30], as it has been done with other CRFs observed by BeppoSAX. We prefer this kind of model with respect to the Lorenzian model [31] because the latter has the disadvantage of modifying the continuum (see discussion in [32]). In Fig. 6 we show the power law plus Gaussian in absorption fit for OBS1, where in the residuals panel we put the CRF normalization to zero in order to show its significance. The CRF best fit parameters are listed in Table 3, in agreement with the OSSE results.
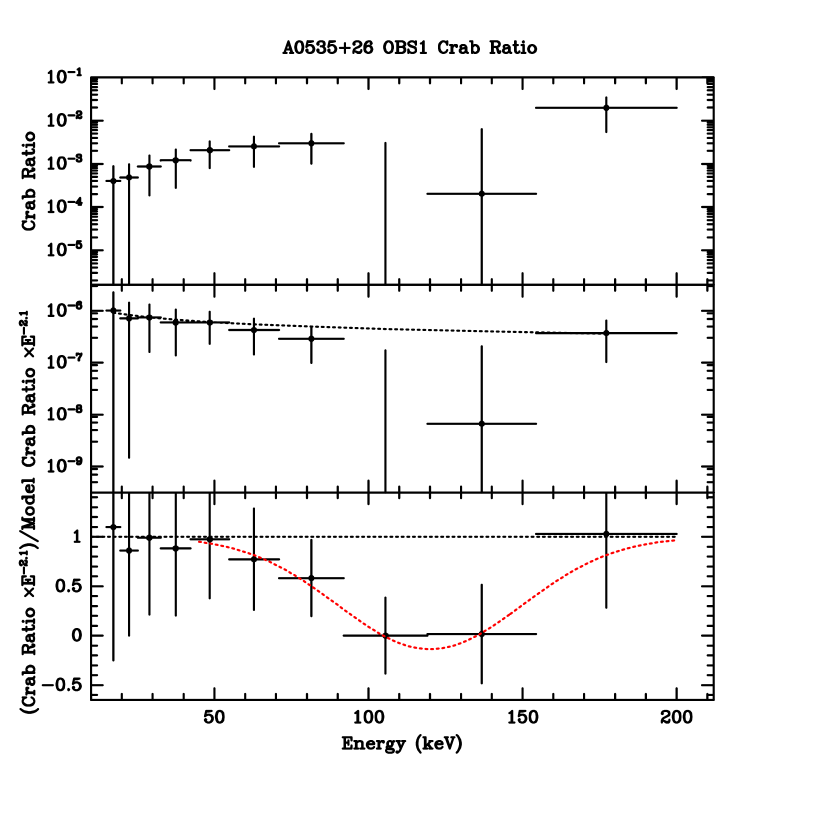
In order to check whether the observed spectral feature was real or due to an instrumental effect, we performed a normalized Crab ratio [33] on the PDS count rate spectrum of the first observation. This technique has been successfully applied for the detection of CRFs in other X–ray pulsars [32] and consists of the ratio between the source count rate spectrum and the count rate spectrum of the Crab Nebula. As this second spectrum is known, with great accuracy, to be free of features and to be modeled at first order with a power law in a very broad energy range, this ratio is quite well suited to enhance the presence of features in the spectrum. Furthermore the ratio is in first approximation independent from the calibration of the instrument. In order to enhance the deviations from the continuum we multiply the ratio by a E-2.1 power law, that is the functional form of the Crab spectrum, and we divide by the functional describing the continuum shape of the source (from this the name normalized Crab ratio). The procedure is described in Fig. 7 where we plot the result of each different step used to obtain the final result in the case of A0535+26.
3.2 Optical observations
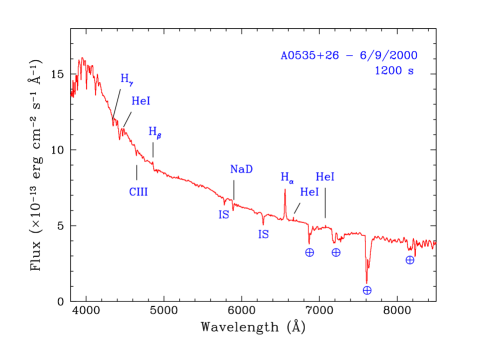
The optical counterpart to A0535+26, the Be star HDE 245770, was monitored at the 1.5m Cassini telescope of the Bologna Astronomical Observatory almost continuously since its discovery in 1975 [34]. During the BeppoSAX campaign several medium-resolution optical spectra, with dispersion ranging from 1.8 to 4 Å/pixel and covering the 4000-8500 Å range, were acquired simultaneously with the X–ray pointings by using the BFOSC instrument. One of these spectra is shown in Fig. 8. In all of them it is clearly seen that Hα and Hβ are in emission, that is the Be star spectrum returned to its normal Be spectrum. This is in agreement with the rebuilding of the Be circumstellar disk around HDE 245770.
At the time of these observations, optical photometry data collected at the nearby Loiano 60 cm telescope shows that the star was at magnitude 9.0 [35].
4 DISCUSSION
Recent RXTE observations [23] of the quiescent emission from A0535+26 at erg/s (2–10 keV; two orders of magnitude lower than that observed in past quiescent states [11]) pose serious problems for the standard accretion theory (see, e.g. [36]). Indeed, at this luminosity level the corotation radius (the distance from the neutron star at which the centrifugal force equals the gravitational pull) is smaller than the magnetospheric radius (the distance at which the magnetic pressure equals the ram pressure), and therefore matter cannot enter the magnetosphere and being accreted because of centrifugal forces (this is the so called propeller state [37]). But the detection of X–ray pulsations clearly contradicts that the source is in a centrifugal inhibited state. Optical observations before and during the RXTE observations also showed that the infrared excess and IR/optical lines emission were missing [17], a clear indication of a Be disk loss episode in HDE 245770.
In order to accommodate this discrepancy Ikhsanov [38] proposed that the mechanism of plasma penetration into the magnetosphere is not through standard interchange instabilities, but through magnetic reconnection of the field lines. In this way, both the presence of pulsation and the small polar cap radius derived from the RXTE spectral fits are explained.
Our X–ray observations confirm the low luminosity state of the source, and therefore its centrifugally inhibited state. The LECS observations were able to clearly detect a soft excess that could be explained both in terms of an additional thermal component, as already observed in other accreting X–ray binary pulsars, like Her X–1 [39], or overabundance of Mg ( times the Solar abundance) in the proximity of the source. The almost absence of spectral variability during the orbit seems to point to the absence of any (temporary) accretion disk, as observed during a giant outburst phase from the detection of spin and QPO frequency variations [12].
The main difference between BeppoSAX and RXTE observations is that the Be disk around HDE 245770 returned in place. We would have expected a higher X–ray luminosity with respect to the disk-less observations, due to the greater amount of circumstellar matter that can be accreted. Therefore the presence of the Be disk seems not to alter the accretion rate onto the neutron star.
The high energy observations indicate a spectral hardening, which is in disagreement with the X–ray spectra observed during the A0535+26 active phase, characterized by a spectral softening above 25 keV [29]. This is further evidence that the kind of accretion in the quiescent and the active phase seems different. In the first BeppoSAX observation there is a marginal (4) evidence of a CRF at 110 keV, but not of a 55 keV feature (reported by [40]). This is a confirmation of the OSSE observation of the CRF detected during the 1994 giant outburst. The same CRF energy observed in two completely different luminosity states constrains the physical conditions in the region in which the CRF originates to not depend on the accretion rate, and this poses serious limits on the actual emission models.
Acknowledgments. We do honor to our late colleague Daniele Dal Fiume, Principal Investigator of the A0535+26 BeppoSAX observations, for his invaluable contribution, among others, in the field of accreting X–ray pulsars. This research was partially funded by Agenzia Spaziale Italiana.
References
- [1] Stella L., White N.E., and Rosner R. 1986. ApJ 308, 669.
- [2] Porter J.M. 1996. MNRAS 280, L31.
- [3] Haigh N.J., Coe M.J., and Fabregat J. 2003. MNRAS (astro-ph/0305194).
- [4] Okazaki A.T. 2002. PASJ 53, 119.
- [5] Basko M.M. and Sunyaev R.A. 1976. MNRAS 175, 395.
- [6] Borkous V., Kaniovsky A.S., Sunyaev R.A. et al. 1998. SvA Lett. (astro-ph/9804181).
- [7] Rosenberg F.D., Eyles C.J., Skinner G.K. et al. 1975. Nat 256, 628.
- [8] Coe M.J., Carpenter G.F., Engel A.R. et al. 1975. Nat 256, 630.
- [9] Giovannelli F. and Sabau-Graziati L. 1992. Space Sci. Rev. 59, 1.
- [10] Bradt H.V., Mayer W., Buff J. et al. 1976. ApJ 204, L67.
- [11] Motch C., Stella L., Janot-Pacheco E. et al. 1991. ApJ 369, 490.
- [12] Finger M.H., Wilson R.B., and Harmon B.A. 1996. ApJ 459, 288.
- [13] Liller W. 1975. IAU Circ., 2780.
- [14] Giangrande A., Giovannelli F., Bartolini C. et al. 1980. A&AS 40, 289.
- [15] Lyuty V.M. and Zaitseva G.V. 2000. Astrophys. Lett. 26, 13.
- [16] Piccioni A., Bartolini C., Bernabei S. et al. 2000. In Smith M.A. and Henrichs H.F., editors, The Be Phenomenon in Early Type Stars, IAU Coll. 175, page 569. ASP Conf. Proc. Vol. 214
- [17] Haigh N.J., Coe M.J., Steele A.I. et al. 1999. MNRAS 310, L21.
- [18] Boella G., Butler R.C., Perola G.C. et al. 1997. A&AS 122, 299.
- [19] Parmar A.N., Martin D.D.E., Bavdaz M. et al. 1997. A&AS 122, 309.
- [20] Boella G., Chiappetti L., Conti G. et al. 1997. A&AS 122, 327.
- [21] Frontera F., Costa E., Dal Fiume D. et al. 1997. A&AS 122, 357.
- [22] Manzo G., Giarrusso S., Santangelo A. et al. 1997. A&AS 122, 341.
- [23] Negueruela I., Reig P., Finger M.H. et al. 2000. A&A 356, 1003.
- [24] Frontera F., Dal Fiume D., Morelli E. et al. 1985. ApJ 298, 585
- [25] Fiore F., Guainazzi M., and Grandi P. Technical Report 1.2, BeppoSAX Scientific Data Center, 1999.
- [26] Rutledge R.E., Bildsten L., Brown E.F. et al. 2000. ApJ 529, 985.
- [27] Steele I.A., Negueruela I., Coe M.J. et al. 1998. MNRAS 297, L5.
- [28] Dal Fiume D., Frontera F., Nicastro L. et al. 1997. In di Gesù V., et al., editors, Proc. 5th Int. Workshop on Data Analysis in Astronomy, page 111. World Scientific Publ. Co.
- [29] Grove J.E., Strickman M.S., Johnson W.N. et al. 1995. ApJ 438, L25.
- [30] Soong Y., Gruber D.E., Peterson L.E. et al. 1990. ApJ 348, 641.
- [31] Mihara T. 1995. PhD thesis, Institute of Physical and Chemical Research, Cosmic Radiation Laboratory
- [32] Orlandini M. and Dal Fiume D. 2001. In White N.E., Malaguti G., and Palumbo G.G.C., editors, X–ray Astronomy ’99, page 283. AIP Conf. Ser. Vol. 599
- [33] Orlandini M., Dal Fiume D., Frontera F. et al. 1998. ApJ 500, L163.
- [34] Piccioni A., Bartolini C., Bernabei S. et al. 1998. In Giovannelli F. and Mannocchi G., editors, Vulcano Workshop 1998, page 195. SIF Conf. Proc. Vol. 65
- [35] Giovannelli F. et al. 2003. In preparation.
- [36] Frank J., King A.R., and Raine D.J. Accretion Processes in Astrophysics. Cambridge University Press, Cambridge, 1985.
- [37] Illarionov A.F. and Sunyaev R.A. 1975. A&A 39, 185.
- [38] Ikhsanov N.R. 2001. A&A 367, 549.
- [39] Dal Fiume D., Orlandini M., Cusumano G. et al. 1998. A&A 329, L41.
- [40] Kendziorra E., Kretschmar P., Pan H.C. et al. 1994. A&A 291, L31.