A search for distant radio galaxies from SUMSS and NVSS: I. Sample definition, radio and band imaging††thanks: Based on observations obtained with the Australia Telescope Compact Array, the Anglo-Australian Telescope, and the European Southern Observatory, La Silla, Chile (Program 70.A-0514).
Abstract
We present the first results from a pilot study to search for distant radio galaxies in the southern hemisphere (). Within a 360 deg2 region of sky, we define a sample of 76 ultra–steep spectrum (USS) radio sources from the 843 MHz Sydney University Molonglo Sky Survey (SUMSS) and 1.4 GHz NRAO VLA Sky Survey (NVSS) radio surveys with and 15 mJy. We observed 71 sources without bright optical or near-infrared counterparts at 1.385 GHz with the ATCA, providing 5″ resolution images and sub-arcsec positional accuracy. To identify their host galaxies, we obtained near-IR band images with IRIS2 at the AAT and SofI at the NTT. We identify 92% of the USS sources down to . The SUMSS–NVSS USS sources have a surface density more than 4 times higher than USS sources selected at lower frequencies. This is due to the higher effective selection frequency, and the well-matched resolutions of both surveys constructed using the same source fitting algorithm. The scattering of sources into the USS sample due to spectral index uncertainties can account for only 35% of the observed USS sources. Since our sample appears to contain a similar fraction of very distant () galaxies, selecting USS sources from SUMSS–NVSS should allow us to identify large numbers of massive galaxies at high redshift.
keywords:
surveys – radio continuum: general – radio continuum: galaxies – galaxies: active1 Introduction
High redshift radio galaxies (HzRGs) provide an ideal opportunity to study the early universe and gain insights into the formation and evolution of massive galaxies. The well known Hubble relation (e.g. Lilly et al., 1984; De Breuck et al., 2002) establishes that at , radio galaxies can be used to trace the most massive star-forming populations. Thanks to the large sky coverage of present-day radio surveys, we can find the rare sources magnitudes more luminous than similar redshift sources found in optical/near-IR surveys. Together with the evolutionary path tracing HzRGs to low-redshift () elliptical galaxies (e.g. Franceschini, Vercellone, & Fabian, 1998; Sadler, 2003; Dunlop, 2003) and the imperative that radio galaxies harbour central supermassive black holes (SMBHs), HzRGs are excellent laboratories for studying the earliest, most massive stellar systems.
HzRGs show diffuse morphologies with strong evidence supporting high star-formation rates (De Breuck et al., 2003; van Breugel et al., 1999b), starkly different to their low-redshift counterparts which are massive elliptical galaxies with little or no star formation. However, with only 26 HzRGs known at , the statistics are still unreliable. Addressing this issue is a major concern in our study. The search for HzRGs will also constrain formation mechanisms for SMBHs which are still very uncertain (e.g. Loeb, 1993; Dunlop et al., 2003). However, a galaxy with a SMBH at already implies that if its SMBH is not primordial, then it must form within Gyr (for km s-1 Mpc-1; Spergel et al., 2003; Tonry et al., 2003). Only one HzRG is known at (van Breugel et al., 1999a), and it is unclear whether HzRGs exist at earlier times. Clearly, the discovery of more HzRGs will dramatically increase our knowledge of galaxy formation and SMBH formation timescales.
Although the large optical and infrared telescopes which probe the distant universe are increasingly concentrated in the southern hemisphere, the search for HzRGs has until recently been limited to the northern hemisphere because of a lack of sensitive radio imaging surveys in the south. This has been rectified with near completion of the Sydney University Molonglo Sky Survey (SUMSS; Bock, Large, & Sadler, 1999) at 843 MHz which will be used, together with its forerunner the 408 MHz Molonglo Reference Catalogue (MRC; Large et al., 1981), to search for the highest–redshift radio galaxies in the south. In this paper we present the results of a pilot study from SUMSS and the 1.4 GHz NRAO VLA Sky Survey (NVSS; Condon et al., 1998).
Our search for HzRGs consists of four steps: (i) definition of the sample, (ii) high-resolution radio imaging to obtain accurate positions and morphological information, (iii) near-IR identifications of the host galaxies, and (iv) optical and/or near-IR spectroscopy to measure their redshifts. Here we present the results from the first three steps of our program.
2 Sample definition
We used the 2001 November 23 pre-release version of the SUMSS catalogue (Mauch et al., 2003), and version 39 of the NVSS catalogue (Condon et al., 1998) to construct a sample of ultra steep spectrum (USS) sources. Note that this is a preliminary version of the SUMSS catalogue which has some differences (see below) from the first publicly–released version, version 1.0 of 2003 February 25. The overlapping area with NVSS comprises 29 SUMSS mosaics of 43 43 each. Since we only consider sources with °(see §3.1), the total sky area of our USS sample is 0.11 steradians, or 360 deg2. This area lies at °, so Galactic extinction should not be a problem in identifying the host galaxies.

To determine which search radius to adopt in our catalogue correlation, we plotted the density of NVSS sources around SUMSS sources as a function of search radius (Fig. 1). We compared this distribution with the expected contribution from random correlations. To create a random position catalogue, we shifted the NVSS positions by 1° in declination. This comparison indicates that at search radii 40″, there are no more correlations than expected from a random distribution. Because we want our USS sample to be reliable, we used a 10 ″ search radius. From Fig. 1, we find that the density of NVSS sources at offsets of 10 ″ is 100 higher than the random distribution, so we expect 1 chance coincidence between a SUMSS and NVSS source in our sample of 76 sources. Using this cutoff, we exclude the 2.8% real sources with offsets 10″.
The difference in resolution between SUMSS (45″ 45″cosec) and NVSS (45″ 45″) may cause a source to be resolved into two or more components in one catalogue, but not in the other111This can explain the small dip in the source density of Fig. 1 between search radii of 40″ and 55″.. Since this would lead to spuriously steep spectral indices, we excluded those objects which had another source within 100″, which corresponds to 24% of the matched sample. This results in 9556 matches. The NVSS positions are expected to be more accurate than the SUMSS positions in this declination zone222At dec. °, the SUMSS beam is 45″ 81″, i.e. significantly larger than the NVSS beam in the N–S direction., so we refer to the sources in common by their NVSS name in the standard IAU format.
We used a spectral index333Spectral index is defined by the power law cutoff , calculated using the integrated SUMSS flux densities from the preliminary catalogue. We also imposed a flux limit of mJy to increase the accuracy of the spectral indices. Of the 78 sources thus selected, we excluded two (NVSS J000920351354 and NVSS J012653322807) which have bright foreground stars in the field, as this complicates optical and near-IR imaging. The final sample of 76 sources is listed in Table 2.
Note that 23 sources in our sample have spectral indices , and nominally fall outside our selection criterion. This is because in Table 2, we have used the integrated flux densities from version 1.0 of the SUMSS catalogue. This version calculates the integrated flux densities from the peak intensity and the widths of the gaussian fit using the same method as described by Condon et al. (1998), while the preliminary version uses the raw output from the 𝒜ℐ𝒫𝒮 task VSAD (T. Mauch, private communication). We have manually checked the integrated flux densities of all 76 sources directly from the SUMSS images, and conclude that the values in the version 1.0 catalogue are reliable (there is no systematic difference, and no sources deviate by more than 25%). The difference between the integrated flux densities appears to be most significant for the largest radio sources (using radio sizes determined from our ATCA imaging, see §3.1), confirming that the preliminary catalogue systematically overestimated the integrated flux density. Such errors show up easily in USS samples, as we select the sources with the largest differences between the SUMSS and NVSS flux densities. In the following, we shall therefore only use the integrated flux densities from the version 1.0 catalogue. This implies that our sample contains only 53 real USS sources with . We have decided to retain the other 23 sources to provide a baseline in spectral index and radio size against which to search for correlations with other properties (e.g. band magnitude, redshift) in our sample.
When using version 1.0 of the SUMSS catalogue, we find a total of 212 sources with . Of these sources, 69 are in new fields since added to the SUMSS coverage. The remaining 143 sources are all within the same fields, and qualify as USS sources due to the revised determination of the SUMSS flux density. Most of these sources have just made it into the USS cutoff: the median spectral index of the 90 ’new’ sources is , while for the 53 USS sources in this paper, . Because this new version of the SUMSS catalogue became available only after our radio and near–IR observations, these ’new’ sources are not considered here.
2.1 Literature
We searched for obvious optical and band identifications at the NVSS positions using the Digitized Sky Survey (DSS) and the 2 Micron All Sky Survey (2MASS; Skrutskie et al., 1997). Of the five sources detected in the DSS, three were also seen in 2MASS. We did not obtain more accurate radio or band identifications for these sources, as they are likely to be located at low () redshifts. As a result, we lack band information for two sources, and for these, we quote the 2MASS 10 sensitivity limit. For the three sources detected in 2MASS, we quote their ’total magnitudes from fit extrapolation’ and list these in column 10 of Table 2. Four sources have measured spectroscopic redshifts from the 2dF Galaxy Redshift Survey (2dFGRS; Colless et al., 2001); these are listed in column 13 of Table 2.
3 Observations and data reduction
3.1 ATCA
We used the Australia Telescope Compact Array (ATCA) over the period UT 2001 December 12–14 to measure accurate radio positions and morphologies of 71 sources in our USS sample. The 6A configuration was used, spanning baselines from 330 m to 6 km. We observed simultaneously at 1.344 GHz and 1.432 GHz, and obtained 4–10 cuts of 3 minutes for each target, spread in hour angle. Primary flux calibration was based on observations of PKS B1934638 and the phase calibrators were PKS B1933400, B2341351 and B0153410. To avoid high azimuth tracking speeds, we excluded sources near the local zenith by limiting our sample to °.
We used the CAONIS on-line data-reduction tool to determine if a source was detected with sufficient signal/noise (S/N). Once a source had been clearly detected, and its morphology determined, we skipped to the next source, with the aim of obtaining a set of radio maps with a uniform S/N level and uv-coverage. Table 1 gives the total on-source integration times for each source.
The resulting synthesized beam widths are , and the positional accuracy is estimated to be . We followed standard data reduction procedures in ℳℐℛℐ𝒜𝒟, and combined the 1.344 GHz and 1.432 GHz uv-data to increase the signal-to-noise and better sample the uv-plane. The final images have a rms noise level of 0.4 mJy.
For approximately 30% of our sample, positive band identifications were confused by several sources located near the radio derived positions. We therefore obtained follow-up radio observations to increase the sensitivity of the previous images. We re-observed 20 USS sources on UT 2003 July 29–30 in the 6A configuration. We observed simultaneously at 1.384 GHz and 2.368 GHz and obtained 7–8 cuts of 4–6 minutes for each target, spread over 12 hours in hour angle. The phase calibrators observed were PKS B1933400, B2254367, B0008421 and B0153410. All other parameters and data reduction techniques are as described above.
3.2 AAT
We obtained band imaging of 70 sources from our sample on the nights of UT 2002 October 17 to 20, using the new IRIS2 instrument (Gillingham & Jones, 2000) at the 3.9m Anglo-Australian Telescope at Siding Spring Observatory. Conditions were mostly photometric, but the seeing was highly variable on some nights. This led to a loss of sensitivity of up to 2 magnitudes when the band seeing was 30, as compared to good conditions with 10 seeing. We used typical integration times of 64 s, consisting of 8 co-adds of 8 s each in a 14-point random jitter pattern within a box. The detector is a 10241024 HAWAII HgCdTe array, with a pixel scale of 0446/pixel, resulting in a field of view.
We used the online data-reduction tool ORAC-DR (Cavanagh et al., 2003) to sky-subtract, register and sum our data. This allowed us to re-observe several of the sources which were not detected after a first 14-point dither pattern. This quick data reduction also allowed us to re-observe 8 sources where we did not detect the object due to loss of sensitivity during periods of bad seeing. In our final data reduction, we retained only data obtained with a band seeing 2.0″, except for 6 sources with .
| Name | ATCA | AAT | NTT | Name | ATCA | AAT | NTT |
| s | s | s | s | s | s | ||
| NVSS J001339322445 | … | … | … | NVSS J230035363410 | 720 | 896 | 2400 |
| NVSS J002001333408 | 3600 | 896 | … | NVSS J230123364656 | 900 | 896 | 2400 |
| NVSS J002112321208 | 900 | 896 | … | NVSS J230203340932 | 2376 | 1792 | … |
| NVSS J002131342225 | 900 | 896 | … | NVSS J230404372450 | 3924 | 896 | … |
| NVSS J002219360728 | … | … | … | NVSS J230527360534 | 2376 | … | 900 |
| NVSS J002352332338 | 2412 | 896 | … | NVSS J230822325027 | 900 | 896 | … |
| NVSS J002359325756 | 900 | 896 | … | NVSS J230846334810 | 1260 | 896 | … |
| NVSS J002402325253 | 720 | 896 | … | NVSS J230954365653 | 3924 | 896 | 1500 |
| NVSS J002415324102 | 900 | 896 | … | NVSS J231016363624 | 900 | 896 | … |
| NVSS J002427325135 | 900 | 896 | … | NVSS J231144362215 | 1260 | 1792 | 2400 |
| NVSS J002627323653 | … | … | … | NVSS J231229371324 | 900 | 896 | … |
| NVSS J002738323501 | 3348 | 896 | 1680 | NVSS J231311361558 | 900 | 896 | … |
| NVSS J011032335445 | 1080 | 896 | … | NVSS J231317352133 | 900 | 1792 | … |
| NVSS J011606331241 | 1080 | 896 | 2400 | NVSS J231335370609 | 900 | 896 | … |
| NVSS J011643323415 | 3564 | 896 | … | NVSS J231338362708 | 1260 | 896 | 2400 |
| NVSS J012904324815 | … | … | … | NVSS J231341372504 | 3564 | 896 | … |
| NVSS J014413330457 | 3240 | 896 | 2400 | NVSS J231357372413 | 1260 | 896 | … |
| NVSS J014529325915 | 720 | 1792 | … | NVSS J231402372925 | 900 | 896 | … |
| NVSS J015223333833 | 3240 | 1792 | … | NVSS J231459362859 | 900 | 896 | … |
| NVSS J015232333952 | 900 | 1792 | … | NVSS J231519342710 | 1620 | 896 | … |
| NVSS J015324334117 | 1080 | 896 | … | NVSS J231726371443 | 1260 | 1792 | 1260 |
| NVSS J015418330150 | 1260 | 896 | … | NVSS J231727352606 | 2556 | 896 | 2400 |
| NVSS J015436333425 | 1080 | 896 | 2400 | NVSS J232001363246 | 1800 | 896 | 1200 |
| NVSS J015544330633 | 900 | 896 | … | NVSS J232014375100 | 1260 | 896 | … |
| NVSS J021308322338 | 1260 | 1792 | … | NVSS J232058365157 | 1620 | 1344 | … |
| NVSS J021359321115 | 1260 | 896 | … | NVSS J232100360223 | 2376 | 896 | 1380 |
| NVSS J021545321047 | 1260 | 896 | … | NVSS J232219355816 | 2376 | 896 | 1800 |
| NVSS J021716325121 | 1260 | 896 | … | NVSS J232322345250 | 1440 | 896 | … |
| NVSS J030639330432 | 1440 | 896 | … | NVSS J232408353547 | … | … | … |
| NVSS J202026372823 | 1080 | 896 | … | NVSS J232602350321 | 1440 | 896 | … |
| NVSS J202140373942 | 1908 | 896 | … | NVSS J232651370909 | 900 | 896 | … |
| NVSS J202518355834 | 1440 | 1792 | … | NVSS J232956374534 | 720 | 896 | … |
| NVSS J202856353709 | 1260 | 896 | … | NVSS J233558362236 | 3600 | 896 | 1980 |
| NVSS J202945344812 | 1080 | 1792 | 2160 | NVSS J233729355529 | 720 | 896 | … |
| NVSS J204147331731 | 720 | 896 | … | NVSS J234137342230 | 2160 | 896 | 1980 |
| NVSS J204420334948 | 1908 | 2688 | 2400 | NVSS J234145350624 | 3000 | 896 | … |
| NVSS J213510333703 | 2160 | 2688 | … | NVSS J234904362451 | 1260 | 896 | … |
| NVSS J225719343954 | 900 | 576 | … | NVSS J235137362632 | 2628 | 896 | 2400 |
3.3 NTT
For the 20 sources not detected in our AAT/IRIS2 images, we obtained deeper band images on the nights of UT 2002 November 25 to 27 using the Son of Isaac (SofI) instrument (Moorwood, Cuby & Lidman, 1998) at the ESO 3.5m New Technology Telescope (NTT). Conditions were photometric with 07 seeing. We used typical integration times of 60 s, consisting of 6 coadds of 10 s each in a 15 to 40-point random jitter pattern within . The detector is a 10241024 HAWAII HgCdTe array, with a pixel scale of 0292/pixel, resulting in a field of view.
We reduced the data using the NOAO IRAF package. After flat-fielding, the data were sky-subtracted, registered, and summed using the DIMSUM near-IR data reduction package. Because most images were observed with good seeing, we block-replicated the pixels by a factor of 2 before summing the individual images.
3.4 Astrometry
The combined images from the ORAC-DR and DIMSUM reductions contain a crude astrometrical solution based on the telescope pointings. We used the SkycatGAIA tool to identify the non-saturated () stars from USNO-A2.0 catalogue (Monet et al., 1998), and fine-tuned our astrometry accordingly. Because of the large field of view, we could identify on average 90 stars in each IRIS2 image, and 40 in the SofI images, allowing an accurate astrometrical solution including the rotation and stretch terms. The main uncertainty in the relative near-IR to radio astrometry stems from the uncertainty in the USNO-A2.0 catalogue, which is (Deutsch, 1999). This is more accurate than our ATCA astrometry, and should therefore be sufficient to identify the band counterparts of our USS sources.
3.5 Photometry
We calibrated the photometry using short observations of standard stars from the UKIRT faint standard list (Hawarden et al., 2001). This procedure yielded typical zeropoints of for IRIS2, and for SofI (for 1 count/second, integrated over the source). Because our resulting images have a large field of view, they generally contain several stars which are also detected in the DEep Near Infrared Survey of the Southern Sky (DENIS Epchtein et al., 1997). We extracted all the DENIS stars in our images with reliable band photometry (confidence coefficient 75) from the catalogue constructed at the Paris Data Analysis Center (Guy Simon, private communication). A comparison with our photometry yields a small systematic offset of mag in both the IRIS2 and SofI photometric zeropoints. We applied this correction to our photometry. We estimate the uncertainty in the zeropoints by comparing field stars observed by both telescopes, and find .
We did not correct for airmass variations, because most of our objects were observed with airmasses 1.7, and the airmass dependence in band is small compared to the fitting errors described below. Similarly, the effect of Galactic extinction is expected to be negligible in our fields (located at °), and no correction has been applied. Note that all our near–IR observations used the -band filter and not the standard band filter. We did not correct our magnitudes to band because we do not have any colour information, and the correction is expected to be much smaller than the photometric uncertainties. In the following, we shall for refer to the magnitudes as band to facilitate comparison with the literature.
We used the IRAF task phot to measure the magnitudes of the band identifications. To facilitate comparison with the literature, we use three different apertures, with diameters of 20, 40, and 80. The uncertainties quoted are our best estimates, which include both the zero-point uncertainty and the fitting uncertainty given by the phot routine.
4 Results
Table 2 lists our sample with the results from our radio and near-IR imaging. The columns are:
- (1)
-
Name of the source in IAU J2000 format.
- (2)
-
The integrated 843 MHz flux density from the SUMSS catalogue.
- (3)
-
The integrated 1.4 GHz flux density from the NVSS catalogue.
- (4)
-
The two-point spectral index between SUMSS and NVSS.
- (5)
-
Largest angular size, as determined from the ATCA maps. For single component sources, this is the de-convolved major axis of the elliptical Gaussian, or, for unresolved sources (preceded by ), an upper limit is given by the resolution. For multiple component sources, this is the largest possible separation between their components.
- (6)
-
De-convolved position angle of the radio structure, as determined from the ATCA maps, measured North through East. For multiple component sources, this is the orientation of the most widely separated components used to calculate the LAS (col. 5).
- (7)
-
The telescope used to obtain the band imaging.
- (8)–(10)
-
band magnitude determined in apertures with diameters of 2″, 4″, and 8″. For the 2MASS photometry, these are the total magnitudes from fit extrapolation.
- (11)–(12)
-
J2000 coordinates of the radio source, either measured from the ATCA images or from the NVSS catalogue, as indicated in column 13. The positions in the ATCA maps have been fitted with a single two-dimensional elliptical Gaussian. For multiple component sources, the geometric midpoint is given, unless mentioned otherwise in the notes on individual sources.
- (13)
-
Origin of the radio position given in columns 11 and 12: A=ATCA image, N=NVSS catalogue.
- (14)–(15)
-
J2000 coordinates of the band identification.
- (16)
-
The spectroscopic redshift from the 2dFGRS.
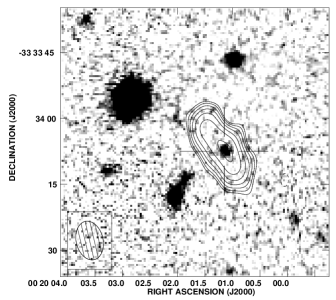
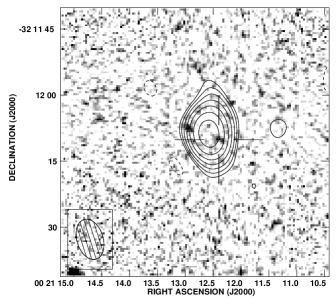
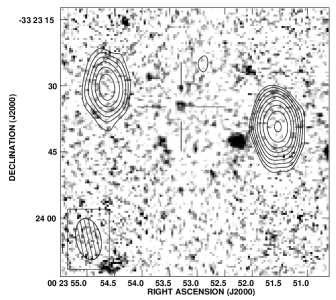
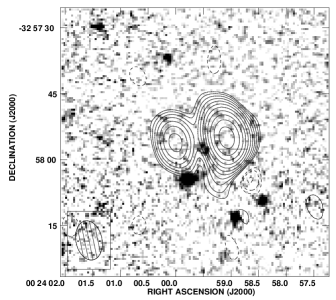
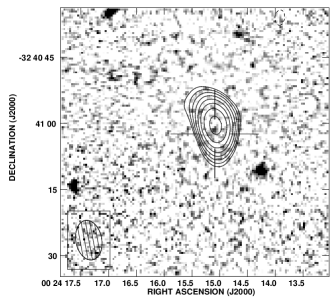
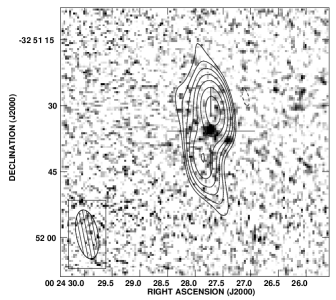
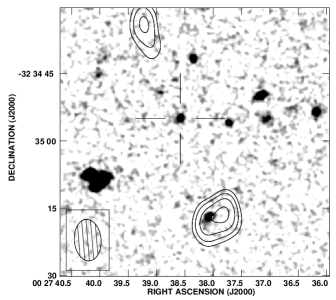
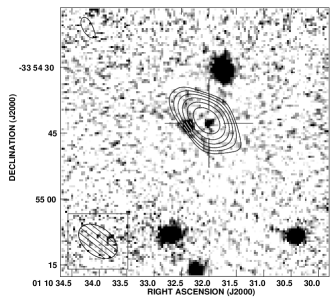
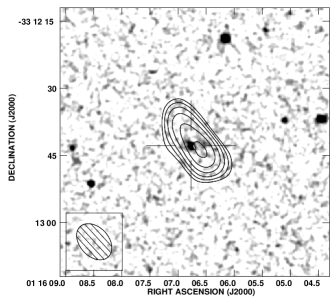
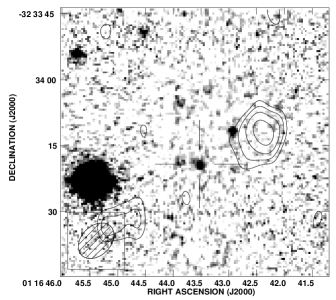
Notes on individual sources are given in the Appendix. Figure 2 shows overlays of the ATCA 1.4 GHz or 2.4 GHz radio contours onto band images.
5 Discussion


5.1 Correlations
We now examine the correlations between the different source parameters in our sample. Because 30% of our sample contains sources with and large radio sizes, we can study the dependence of band magnitude on these parameters. Fig. 3 shows that the band magnitude and radio spectral index are correlated. The generalized Spearman rank and generalized Kendall’s tau coefficients (e.g. Isobe, Feigelson, & Nelson, 1986) suggest this relation is significant at the 99.95% level. This correlation arises because both radio spectral index and band magnitude are correlated with redshift, reinforcing our approach of using band magnitude as an additional criterion for selecting the highest redshift candidates.
Several samples of USS sources (Blundell et al., 1998; Stern et al., 1999) have applied a radio angular-size cutoff to exclude large radio sources, which are thought to be at relatively low redshift. We can check the efficiency of this approach with our sample, as we have radio size information for 95% of our sources, and band information to estimate their redshifts (see §5.3). Note that our sample also has an implicit angular size cutoff due to the exclusion of SUMSS sources with more than one NVSS source within 100″(see §2). Considering only the 53 sources with and radio size information, there indeed appears to be a correlation between radio size and band magnitude (see Fig. 4). The generalized Spearman rank and Kendall’s tau coefficients suggest that this correlation is significant at the 99.7% level. Because our sample contains only 29 radio sources larger than 10″ (only 12 of which have ), we consider this suggestive, but not conclusive evidence that the most distant radio sources in our radio sample have smaller radio sizes. Nevertheless, it is remarkable that only two sources with have a radio size larger than 6″. This suggests that a significant fraction of the compact steep spectrum sources in our sample are either at high redshift or are heavily obscured by dust (Reuland et al., 2003).
5.2 Surface density of USS sources
In this paper, we select USS sources on the basis of the radio spectral index between 843 and 1400 MHz. We now evaluate how well this works in comparison with the techniques used in earlier USS samples. There are two considerations here: the number of sources which this technique yields, and the fraction of USS sources which lie at high redshift.
Table 3 compares the results from our SUMSS–NVSS pilot study with earlier USS samples observed by De Breuck et al. (2002) and Jarvis et al. (2001). The SUMSS–NVSS USS selection yields a USS surface density more than four times higher than the WENSS–NVSS sample of De Breuck et al. (2002) at the same 1.4 GHz flux level. Note that due to the incompleteness of our USS sample (see §2), these numbers are strictly lower limits. There are several explanations for this higher density:
First, the higher observed selection frequency of 843 MHz compared to 325 MHz means that we are also sampling a higher rest-frame spectral index of the radio sources. Because most radio spectra of powerful radio galaxies and compact steep spectrum sources have a tendency to steepen towards higher frequencies (e.g. Gopal-Krishna, 1988; Mangalam & Gopal-Krishna, 1995; Athreya & Kapahi, 1998; Murgia et al., 1999; Blundell, Rawlings, & Willott, 1999; De Breuck et al., 2000; Sohn, Klein, & Mack, 2003), we are effectively probing an intrinsically steeper part of the radio spectrum. Therefore, on average, corresponds to . This slightly more relaxed cutoff leads to a fast increase in the number of USS selected sources (due to the steep tail of the spectral index distribution), but due to the other two effects described here, we cannot use this to estimate the cutoff equivalent to .
Second, the SUMSS and NVSS catalogues have both been constructed with the 𝒜ℐ𝒫𝒮 task VSAD (Condon et al., 1998; Mauch et al., 2003), while the WENSS survey uses an IDL-based fitting routine (Rengelink et al., 1997). Because both USS samples consider only isolated sources in both catalogues, the use of the same fitting routine in both surveys is more appropriate. For example, De Breuck et al. (2000) considered only ‘single component’ WENSS sources, which may well exclude a substantial fraction of real USS sources. Furthermore, the spatial resolution of SUMSS (45″ 45″cosec) is better matched to NVSS (45″ 45″) than that of WENSS (54″ 54″cosec), so fewer sources will be removed by our selection criterion to exclude sources resolved in only one of the two catalogues (see §2). The WENSS–NVSS USS sample is therefore less complete than the SUMSS–NVSS USS sample.
Third, the shorter frequency baseline between SUMSS and NVSS leads to a median uncertainty in the derived USS spectral indices , while for WENSS-NVSS, this is (De Breuck et al., 2000). Because the cutoff is on the very steep tail of the spectral index distribution, we expect more sources with to scatter into into the USS sample than there will be scattering out. To estimate the magnitude of this effect, we have generated a random sample of sources drawn from the SUMSS–NVSS spectral index distribution, and added random spectral index uncertainties to this (Rengelink, 1999). Here, we use the publicly released version of the SUMSS catalogue, containing 212 USS sources with to get reliable estimated of this effect. Adopting a mean spectral index and a standard deviation of , we expect that due to uncertainties in the spectral indices in our sample, 40 real have observed , while 115 real have observed . Hence, this would lead to a surplus of 75 sources (35%) in a USS sample (compared to 3% in the WENSS–NVSS sample; De Breuck et al., 2000). However, we do not expect that this ‘contamination’ of sources will decrease the fraction of radio galaxies in our SUMSS–NVSS USS sample because the scatter in the relation is quite large.
Table 3 also shows that the fraction of USS sources which have band IDs fainter than 19.5 mag, making them candidates for very distant () radio galaxies, appears similar in the SUMSS–NVSS and WENSS–NVSS USS sample with a 15 mJy cutoff. However, the band photometry of the WENSS–NVSS USS sample is not complete as most of the WENSS–NVSS sources observed in band were pre-selected to be undetected in optical imaging (). This preselection will clearly have removed a substantial number of ‘intermediate redshift’ sources with . If the 20 band detected sources not observed at band are all assumed to have , then the fraction decreases to 19.6 %, slightly lower than the value found for the SUMSS-NVSS sample.
Thus it appears that spectral index selection between 843 and 1400 MHz is an efficient way of finding distant galaxies, and the full SUMSS–NVSS USS sample should be capable of finding large numbers of massive galaxies at . Spectroscopy is clearly needed to confirm that the relation holds for these galaxies.
| Sample | Flux limit | Spectral index | Area | Sources | USS density | Fraction of USS | Density (sr-1) | Ref. |
|---|---|---|---|---|---|---|---|---|
| (mJy) | limit | sr | (sr-1) | with K19.5 mag | USSK19.5 | |||
| WENSS–NVSS | 10 | 2.27 | 343 | 151 | 12/44 (27%) | 41 | 1 | |
| TEXAS–NVSS | 10 | 5.58 | 268 | 48 | 8/24 (33%) | 16 | 1 | |
| MRC–PMN | 700 | 2.23 | 58 | 26 | 0/19 | 1.4 | 1 | |
| 6C∗ | 960 | 0.133 | 24 | 180 | 2/24 ( 8%) | 15 | 2 | |
| SUMSS–NVSS | 15 | 0.11 | 53 | 482 | 13/53 (25%) | 118 | 3 | |
| WENSS–NVSS | 15 | 2.27 | 233 | 103 | 11/36 (31%) | 32 | 1 |
5.3 Expected redshift distribution
We have spectroscopic redshifts of only four sources from the 2dFGRS. To estimate the redshift distribution of the other 71 sources, we use the Hubble diagram. We have fitted a linear relation to the 64 kpc radio-galaxy magnitudes in Fig. 7 of De Breuck et al. (2002), yielding . To calculate the 64 kpc metric apertures, we used the average correction for , viz. . Figure 5 shows the predicted redshift distribution of our sample. The median predicted redshift is 1.75, which is slightly lower than for the WENSS–NVSS and Texas–NVSS USS samples (De Breuck et al., 2002). However, when the optical preselection in the former (see previous section) is taken into account, the SUMSS–NVSS sample has at least as high a median expected redshift.

6 Conclusions
We have constructed a sample of 76 southern USS sources from the SUMSS and NVSS, including 53 sources with . Our 5″ resolution radio maps allow the identification of 92% of these sources down to . The surface density of this SUMSS–NVSS USS sample is more than four times higher than earlier USS samples, which can be explained by a spectral index cutoff which is effectively more relaxed due to the higher selection frequency, and by the use of the same source finding algorithm in both catalogues. The higher uncertainties in the spectral indices due to the shorter frequency baseline account for a further 35% of source which get scattered into the USS sample.
The distribution of the band magnitudes suggests that our sample will be at least as efficient in finding radio galaxies as earlier USS samples. We intend to obtain full spectroscopic redshift information for this sample to increase the number of potential HzRG targets for follow-up studies with 8m-class telescopes in the southern hemisphere, and to study the radio power dependence in the Hubble diagram out to .
By the end of 2003, SUMSS is expected to cover most of the ° region. When combined with the re-analysis of the 408 MHz MRC (Crawford, in preparation), this will allow the construction of a sensitive USS sample at °, a region which is virtually unexplored in extragalactic radio astronomy.
7 Acknowledgements
We thank the referee Philip Best for his valuable comments, Tom Mauch for useful discussions and Guy Simon for providing the band data from the DENIS survey. This publication makes use of data products from the Two Micron All Sky Survey, which is a joint project of the University of Massachusetts and the Infrared Processing and Analysis Center/California Institute of Technology, funded by the National Aeronautics and Space Administration and the National Science Foundation. This work was supported by PICS/CNRS (France) and IREX/ARC (Australia), and by a Marie Curie Fellowship of the European Community programme ‘Improving Human Research Potential and the Socio-Economic Knowledge Base’ under contract number HPMF-CT-2000-00721.
References
- Athreya & Kapahi (1998) Athreya, R., & Kapahi, V. 1998, J. Astrophys. Astr., 19, 63
- Blundell, Rawlings, & Willott (1999) Blundell, K., Rawlings, S., & Willott, C. 1999, AJ, 117, 677
- Blundell et al. (1998) Blundell, K., Rawlings, S., Eales, S., Taylor, G., & Bradley, A. 1998, MNRAS, 295, 265
- Bock, Large, & Sadler (1999) Bock, D., Large, M., & Sadler, E.M. 1999, AJ, 117, 1578
- Cavanagh et al. (2003) Cavanagh, B., et al. 2003, Astronomical Data Analysis Software and Systems XII ASP Conf. Series, 295, p.237
- Condon et al. (1998) Condon, J., et al. 1998, AJ, 115, 1693
- Colless et al. (2001) Colless, M., et al. 2001, MNRAS, 328, 1039
- De Breuck et al. (2000) De Breuck, C., van Breugel, W., Röttgering, H., & Miley, G. 2000, A&AS, 143, 303
- De Breuck et al. (2002) De Breuck, C., van Breugel, W., Stanford, S. A., Röttgering, H., Miley, G., & Stern, D. 2002, AJ, 123, 637
- De Breuck et al. (2003) De Breuck, C., et al. 2003, A&A, 401, 911
- Deutsch (1999) Deutsch, E. W. 1999, AJ, 118, 1882
- Douglas et al. (1996) Douglas, J. N., Bash, F. N., Bozyan, F. A., Torrence, G. W., & Wolfe, C. 1996, AJ, 111, 1945
- Dunlop et al. (2003) Dunlop, J., McLure, R., Kukula, M., Baum, S., O’Dea, C., & Hughes, D. 2003, MNRAS, 340, 1095
- Dunlop (2003) Dunlop, J. 2003, Carnegie Observatories Astrophysics Series, Vol. 1: Coevolution of Black Holes and Galaxies, ed L. C. Ho (Cambridge: Cambridge Univ. Press)
- Epchtein et al. (1997) Epchtein, N., et al. 1997, The Messenger, 87, 27
- Franceschini, Vercellone, & Fabian (1998) Franceschini, A., Vercellone, S., & Fabian, A. 1998, MNRAS, 297, 817
- Gillingham & Jones (2000) Gillingham, P. & Jones, D. 2000, Proc. SPIE, 4008, 1084
- Gopal-Krishna (1988) Gopal-Krishna 1988, A&A, 192, 37
- Hawarden et al. (2001) Hawarden, T., Leggett, S., Letawsky, M., Ballantyne, D., & Casali, M. 2001, MNRAS, 325, 563
- Isobe, Feigelson, & Nelson (1986) Isobe, T., Feigelson, E., & Nelson, P. 1986, ApJ, 306, 490
- Jarvis et al. (2001) Jarvis, M., et al. 2001, MNRAS, 326, 1585
- Large et al. (1981) Large, M. I., Mills, B. Y., Little, A. G., Crawford, D. F., & Sutton, J. M. 1981, MNRAS, 194, 693
- Lilly et al. (1984) Lilly, S & Longair, M. 1984, MNRAS, 211, 833
- Loeb (1993) Loeb, A. 1993, ApJ, 403, 542
- Mangalam & Gopal-Krishna (1995) Mangalam, A. & Gopal-Krishna 1995, MNRAS, 275, 976
- Mauch et al. (2003) Mauch, T., et al. 2003, MNRAS, in press, astro-ph/0303188
- Monet et al. (1998) Monet, D. et al.1998, USNO-A2.0, (U.S. Naval Observatory, Washington DC), VizieR Online Data Catalog, 1252
- Moorwood, Cuby & Lidman (1998) Moorwood, A., Cuby, J. & Lidman, C., 1998, The Messenger, 91, 9
- Murgia et al. (1999) Murgia, M., Fanti, C., Fanti, R., Gregorini, L., Klein, U., Mack, K.-H., & Vigotti, M. 1999, A&A, 345, 769
- Rengelink et al. (1997) Rengelink, R. et al. 1997, A&A, 124, 259
- Rengelink (1999) Rengelink, R. 1999, Ph.D. thesis, Rijksuniversiteit Leiden.
- Reuland et al. (2003) Reuland, M., van Breugel, W., Röttgering, H., de Vries, W., De Breuck, C., & Stern, D. 2003, ApJ, 582, 71
-
Sadler (2003)
Sadler, E.M. 2003, Carnegie Observatories Astrophysics Series, Vol. 1: Coevolution of Black Holes and Galaxies, ed L. C. Ho (Pasadena: Carnegie Observatories, http://www.ociw.edu/ociw/symposia/series/symposium1/
proceedings.html), astro-ph/0304514 - Skrutskie et al. (1997) Skrutskie, M., et al. 1997, ASSL Vol. 210: The Impact of Large Scale Near-IR Sky Surveys, p. 25
- Sohn, Klein, & Mack (2003) Sohn, B., Klein, U. & Mack, K.-H. 2003, A&A, in press, astro-ph/0304155
- Spergel et al. (2003) Spergel, D., et al. 2003, ApJ, submitted, astro-ph/0302209
- Stern et al. (1999) Stern, D. et al. 1999, AJ, 117, 1122
- Tonry et al. (2003) Tonry, J. et al. 2003, ApJ, in press, astro-ph/0305008
- van Breugel et al. (1999a) van Breugel, W., De Breuck, C., Stanford, S. A., Stern, D., Röttgering, H., & Miley, G. 1999a, ApJ, 518, L61
- van Breugel et al. (1999b) van Breugel, W., et al. 1999b, Proc. The Most Distant Radio Galaxies, Royal Netherlands Acedemy of Arts and Sciences, eds. H. Röttgering, P. Best, and M. Lehnert. 1999, p.49
![[Uncaptioned image]](/html/astro-ph/0309814/assets/x5.png)
![[Uncaptioned image]](/html/astro-ph/0309814/assets/x6.png)
| NVSS J002001333408 0.1 mJy | NVSS J002112321208 0.3 mJy | NVSS J002131342225 0.3 mJy |
 |
 |
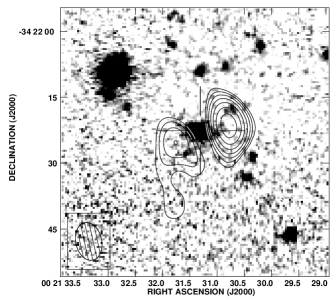 |
| NVSS J002352332338 0.14 mJy | NVSS J002359325756 0.4 mJy | NVSS J002402325253 0.9 mJy |
 |
 |
 |
| NVSS J002415324102 0.7 mJy | NVSS J002427325135 0.7 mJy | NVSS J002738323501 0.18 mJy |
 |
 |
 |
| NVSS J011032335445 0.5 mJy | NVSS J011606331241 0.7 mJy | NVSS J011643323415 0.19 mJy |
 |
 |
 |
Appendix A Notes on individual sources
NVSS J001339322445: This is the northern member of a pair of radio sources separated by 2.2 arcmin on the sky and previously catalogued as PKS 0011-327. While this could be a wide double, we consider it more likely that the two sources are unrelated as there is no plausible optical or near-IR counterpart located between the two sources. The northern (steep–spectrum) source NVSS J001339322445 is associated with a bright galaxy seen on both the DSS and 2MASS images, and so was not observed with the ATCA or AAT. The southern source, NVSS J001338322657, has no obvious optical counterpart. Its flux density is 106 mJy in NVSS and 141 mJy in SUMSS, giving a spectral index of .
NVSS J002001333408: The band identification is located at the centre of the extended radio source.
NVSS J002112321208: The diffuse band identification is offset by (=(20W, 15S) from the ATCA position.
NVSS J002131342225: The source is identified with the (uncatalogued) bright galaxy located between the radio lobes.
NVSS J002219360728: An optical galaxy is clearly visible on the digitized sky survey images at the NVSS position, so this source was not observed with the ATCA or AAT.
NVSS J002352332338: We identify the host galaxy with the faint band object located along the radio axis, offset by (=(76E, 34N) from the NVSS position.
NVSS J002359325756: The band identification is located in between the radio lobes. This source is also known as PMN J00243258.
NVSS J002402325253: The diffuse band identification is offset by (=(06W, 11N) from the ATCA position.
NVSS J002415324102: The diffuse band identification is located at the ATCA position.
NVSS J002427325135: The band identification is located in between the radio lobes.
NVSS J002627323653: An optical galaxy is clearly visible on the digitized sky survey images at the NVSS position, so this source was not observed with the ATCA or AAT.
NVSS J002738323501: The diffuse band identification is located at the midpoint of the radio lobes.
NVSS J011032335445: The band identification is located at the ATCA position.
NVSS J011606331241: The band identification is located at the ATCA position.
NVSS J011643323415: We identify the compact band source offset by (=(05W, 36S) from the NVSS position.
NVSS J012904324815: This bright source is clearly detected in 2MASS using the NVSS astrometry. We therefore did not observe it with the ATCA or AAT.
NVSS J014413330457: This radio source has a complex morphology. We identify a diffuse band source at the position of the brightest radio component, which is most likely the core. In table 2, we list the position of this radio core.
NVSS J014529325915: The diffuse radio source appears to lie within a small a cluster of galaxies. We identify the bright band source offset by (=(26E, 20S) from the ATCA position.
NVSS J015223333833: The band identification is located along the radio axis, offset by (=(16E, 27S) from the midpoint between the radio lobes in the ATCA image.
NVSS J015232333952: The bright band identification is located between the main two radio lobes. The radio source, also known as PMN J01523340, has a complex morphology with a fainter lobe to the east of the main two radio lobes.
NVSS J015324334117: The diffuse radio source appears to lie within a small a cluster of galaxies. We identify the bright band source offset by (=(64E, 67S) from the ATCA position.
NVSS J015418330150: The faint band identification is located at the ATCA position.
NVSS J015436333425: The diffuse band identification is located at the ATCA position.
NVSS J015544330633: The bright band identification is located between the radio lobes.
NVSS J021308322338: The band identification is located at the ATCA position.
NVSS J021359321115: The band identification is located at the ATCA position.
NVSS J021545321047: The band identification is located along the radio axis, offset by (=(14W, 02S) from the midpoint between the radio lobes in the ATCA image.
NVSS J021716325121: The band identification is located between the radio lobes.
NVSS J030639330432: The band identification is located at the ATCA position. This source is also known as TXS 0304332.
NVSS J202026372823: The band identification is located at the ATCA position.
NVSS J202140373942: The band identification is located at the central of the 3 radio components.
NVSS J202518355834: The band identification is located at the ATCA position.
NVSS J202856353709: The bright band identification is located between the radio lobes.
NVSS J202945344812: The band identification is located along the radio axis, offset by (=(17E, 50S) from the midpoint between the radio lobes in the ATCA image.
NVSS J204147331731: The bright band identification is located between the radio lobes.
NVSS J204420334948: No band source is seen near the radio position in our medium deep SofI image.
NVSS J213510333703: The faint band identification is located at the ATCA position.
NVSS J225719343954: The bright band identification is located at the ATCA position. The bright galaxy south of the ATCA position has from the 2dFGRS.
NVSS J230035363410: The very faint band identification is offset by (=(14E, 16S) from the ATCA position.
NVSS J230123364656: The faint band identification is located at the ATCA position.
NVSS J230203340932: The band identification is located near the central radio component, which is most likely the core. In table 2, we list the position of this radio core.
NVSS J230404372450: The band identification is located between the radio lobes.
NVSS J230527360534: No band source is seen near the radio position in our SofI image.
NVSS J230822325027: The band identification is located at the ATCA position.
NVSS J230846334810: The radio source has a complex morphology, consisting of at least 4 components. The band identification is surrounded by a number of fainter clumps. This source resembles WN J1015+3038 and TN J10491258 (De Breuck et al., 2002).
NVSS J230954365653: There are several faint band sources located in between the radio lobes. A deeper radio map would be needed to determine with certainty which one is the host galaxy. We tentatively identify the galaxy closest to the line connecting the radio lobes.
NVSS J231016363624: The bright band identification is located between the radio lobes. This source is also detected in the DENIS survey with in a 45 aperture.
NVSS J231144362215: The very faint band identification is located between the radio lobes.
NVSS J231229371324: The band identification is located at the ATCA position.
NVSS J231311361558: The band identification is located at the midpoint of the radio lobes. This is the largest radio source in our sample.
NVSS J231317352133: The position quoted in Table A search for distant radio galaxies from SUMSS and NVSS: I. Sample definition, radio and band imaging††thanks: Based on observations obtained with the Australia Telescope Compact Array, the Anglo-Australian Telescope, and the European Southern Observatory, La Silla, Chile (Program 70.A-0514). is for the bright eastern component only, because the band identification coincides with this lobe.
NVSS J231335370609: The band identification is offset by (=(03E, 19N) from the ATCA position.
NVSS J231338362708: The faint band identification is located between the radio lobes.
NVSS J231341372504: The band identification is located at the midpoint of the radio lobes.
NVSS J231357372413: The band identification is located at the ATCA position.
NVSS J231402372925: The band identification is located at the ATCA position.
NVSS J231459362859: The band identification is located at the ATCA position.
NVSS J231519342710: The band identification is located along the radio axis, offset by (=(59E, 21S) from the midpoint between the radio lobes in the ATCA image.
NVSS J231726371443: There are two band objects located along the radio axis, which may both be components of the host galaxy. We conservatively assume that only the northernmost component, offset by (=(02E, 22S) from the northern radio lobe in the ATCA image, is the host galaxy. The position quoted in Table 2 is for the bright northern component only, because it is near the NVSS position.
NVSS J231727352606: No band source is seen near the radio position in our medium deep SofI image.
NVSS J232001363246: The faint band identification is located at the ATCA position.
NVSS J232014375100: The band identification is located between the radio lobes of this large radio source, offset by (=(41W, 01S) from the NVSS position.
NVSS J232058365157: The band identification is located at the ATCA position.
NVSS J232100360223: The very faint band identification is offset by (=(12W, 11N) from the ATCA position.
NVSS J232219355816: No band source is seen near the radio position in our SofI image.
NVSS J232322345250: The band identification is located at the ATCA position.
NVSS J232408353547: An optical galaxy is seen in both the DSS and 2MASS at the NVSS position, so we did not observe this source with the ATCA or AAT.
NVSS J232602350321: The bright band identification is coincident with an extended radio source.
NVSS J232651370909: The faint band identification is located at the ATCA position.
NVSS J232956374534: The faint band identification is offset by (=(07E, 15N) from the ATCA position.
NVSS J233558362236: We identify the host galaxy as the bright band source, located along the radio axis, nearer to the brightest radio lobe.
NVSS J233729355529: The radio source has a complex morphology, consisting of three non-aligned components. We identify the host galaxy with a diffuse band source, coincident with the brightest radio component.
NVSS J234137342230: No band source is seen near the radio position in our SofI image.
NVSS J234145350624: The bright band identification is located at the ATCA position. This source is also known as PKS J23413506.
NVSS J234904362451: The band identification is located between the radio lobes.
NVSS J235137362632: No band source is seen near the radio position in our medium deep SofI image.