The Rotation Of The Deep Solar Layers
Abstract
From the analysis of low-order GOLF+MDI sectoral modes () and LOWL data (), we derive the radial rotation profile assuming no latitudinal dependance in the solar core. These low-order acoustic modes contain the most statistically significant information about rotation of the deepest solar layers and should be least influenced by internal variability associated with the solar dynamo. After correction of the sectoral splittings for their contamination by the rotation of the higher latitudes, we obtain a flat rotation profile down to 0.2 R⊙.
1 Introduction
Helioseismologists use the oscillations of acoustic waves that propagate inside the Sun to infer its rotation profile. Due to the solar rotation (and magnetic fields), the frequencies of two modes of the same degree and radial order , but with different azimuthal orders , are separated by a small amount referred to as splitting ().
The understanding of the angular momentum redistribution in the deep interior requires a precise derivation of the rotation profile below the convection zone, but this profile is still a matter of debate. In the past an increase of the rotation rate near the core has long been favored (e.g. Lazrek et al. 1996), but recent results by Chaplin et al. (1999) and Eff-Darwich, Korzennik, & Jiménez-Reyes (2002) favor a slight decrease. Corbard et al. (1997), using LOWL data, and Ehgamberdiev et al. (2001), using IRIS data, also derived such a decrease.
Here we focus on the rotation in the solar core derived from the GOLF (Global Oscillations at Low Frequency) and MDI (Michelson Doppler Imager) instruments, supplemented for modes with by LOWL data. These data sets and the interest of the low-order modes are presented in sections 2 and 3 respectively. In section 4, the method utilized to extract the rotational splittings is discussed. In section 5 we discuss the rotation profile. We conclude in section 6.
2 The Data
We use data from GOLF/SoHO and MDI/SoHO for the modes . GOLF detects the global solar oscillations by the Doppler shift they produce at the surface on the sodium lines. It is specifically designed to be more sensitive to the low-degree modes, and only detects those with equal to an even number. We utilize the 2034-day long GOLF series (starting in April 1996) for the GOLF-alone splittings. MDI detects solar surface velocity from a nickel spectral line and resolves the solar surface. To produce integrated-disk temporal series sensitive to the low- modes, we apply two masks (gaussian, and gaussian zero mean) to the 2243-day long MDI series (Henney et al. 1999). These two series have been properly combined with GOLF 2243-day long series to increase the signal-to-noise ratio of the low- modes, and to reduce the leakage of higher- modes present on the MDI spectrum (García et al. 2003). The use of the MDI+GOLF time series allows for the precise measurement of lower- modes. This point of interest is discussed further in section 3. We supplemented these GOLF-alone and MDI+GOLF data with LOWL rotational splittings for . We used six LOWL series of 1 year, from February 1994 to February 2000. The splittings have been extracted for each year but the final result uses the 6 years statistics (Jiménez-Reyes 2001).
3 Information Value of Low-Order Modes
The derivation of the rotation profile in the radiative zone requires high-precision splittings. For instance, only of the splitting ( nHz) of the mode (at Hz) is due to the rotation below (Couvidat 2002). Thus, we need to derive with a precision better than nHz to obtain information on the core. The error associated with this splitting is nHz (see Table 1). It contains more information than the mode (at Hz), for which of its splitting ( nHz) is due to the core, i.e. nHz, but the uncertainty is nHz. This point is illustrated by the left panel of Fig 1. Even though the inner turning point is closer to the core as increases, the outer turning point is also closer to the surface, where stochastic excitation and solar cycle effects become more important. Therefore, the most favorable trade-off between sensitivity to the core rotation and uncertainty in the rotational splitting determination occurs for low- low- p modes. Consequently we use only these modes in the present analysis.

4 The Rotational Splittings
The splittings are obtained by fitting the components of each mode to asymmetric Lorentzian profiles (Nigam & Kosovichev 1998) using a maximum likelihood code based on Appourchaux, Gizon, & Rabello-Soares (1998). The modes & are fitted together, likewise the modes & . For the GOLF-alone series, we use the periodogram of the data as the power spectrum, except for the modes & , and & , for which we use a multitaper spectral estimator (e.g. Percival & Walden 1993). For the combined MDI+GOLF series we again use the multitaper. We restricted the search of the splittings to modes with a frequency less than Hz, and use for the inversion only the modes with . This way we limit the impact of the solar cycle and surface effects. This approach is consistent with the results of Chaplin et al. (2001) who demonstrated that the splittings are strongly biased at higher frequencies, and Chaplin et al. (2003), who showed that the solar cycle does not affect the splittings of the low- modes.
The free parameters of the fitted profiles for each mode are: the full width at half maximum (FWHM, the same for all the components of a mode), the amplitude (the relative amplitudes of the different components are fixed empirically), the asymmetry (the same for each component), the central frequency, the noise level (assumed to be constant in the fit window of 40 Hz), and the splittings. The latter parameters are sectoral values (). We restrict the fits to frequencies Hz on the MDI+GOLF data, because of the growing influence of higher- modes in the fit window (for instance, modes perturb the profiles).
In Table 1, we list the synodic sectoral splittings and their uncertainties. The rotational splittings common to the MDI+GOLF and GOLF-alone datasets generally agree within the uncertainty. Right panel of Fig 1 presents these splittings as a function of the inner turning point. This plot emphasizes the high quality of the SoHO data after 5 years of observation in comparison with previous data sets.
| (nHz) | err. (nHz) | () | (nHz) | err.(nHz) | () | ||||
|---|---|---|---|---|---|---|---|---|---|
| 1 | 6 | ——/398.49 | —-/1.53 | 0.102 | 2 | 11 | 401.07/401.33 | 8.20/6.45 | 0.132 |
| 1 | 7 | 393.39/401.05 | 6.46/3.57 | 0.096 | 2 | 12 | 379.60/380.34 | 10.72/4.42 | 0.124 |
| 1 | 8 | 400.67/398.70 | 6.06/1.49 | 0.090 | 2 | 13 | 402.37/396.45 | 10.64/11.75 | 0.118 |
| 1 | 9 | 406.40/403.96 | 5.28/3.43 | 0.085 | 2 | 14 | 395.17/—— | 15.27/—– | 0.112 |
| 1 | 10 | 414.63/412.37 | 9.50/4.22 | 0.080 | 2 | 15 | 402.65/—— | 18.94/—– | 0.107 |
| 1 | 11 | 400.16/401.96 | 10.47/4.60 | 0.076 | 3 | 6 | ——/403.69 | —–/3.64 | 0.252 |
| 1 | 12 | 406.56/397.39 | 14.19/6.22 | 0.073 | 3 | 7 | ——/403.84 | —–/4.36 | 0.232 |
| 1 | 13 | 436.49/426.98 | 15.63/15.29 | 0.069 | 3 | 8 | ——/405.23 | —–/6.39 | 0.215 |
| 1 | 14 | 411.15/417.97 | 23.50/23.23 | 0.066 | 3 | 9 | ——/403.92 | —–/9.23 | 0.201 |
| 1 | 15 | 408.08/395.40 | 28.94/27.53 | 0.063 | 3 | 10 | ——/404.79 | —–/14.28 | 0.190 |
| 2 | 6 | ——/399.84 | —–/2.23 | 0.184 | 3 | 11 | ——/400.58 | —–/15.30 | 0.179 |
| 2 | 7 | ——/401.37 | —–/4.07 | 0.170 | 3 | 12 | 401.52/402.58 | 10.10/18.34 | 0.172 |
| 2 | 8 | 397.00/399.10 | 5.70/2.83 | 0.158 | 3 | 13 | 388.53/416.07 | 11.47/9.09 | 0.162 |
| 2 | 9 | 412.01/406.42 | 6.49/2.43 | 0.147 | 3 | 14 | 413.62/384.35 | 11.65/10.90 | 0.155 |
| 2 | 10 | 406.55/400.97 | 6.95/5.06 | 0.139 | 3 | 15 | 409.72/410.05 | 16.37/20.18 | 0.148 |
5 The Solar Rotation Profile
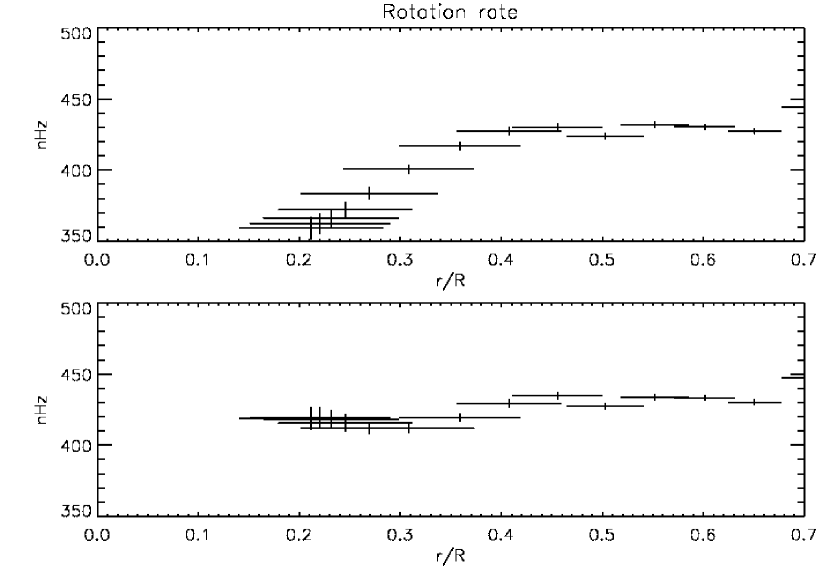
The 1D inversion of sectoral splittings provides information about the rotation mainly along the solar equator, but with contamination by the higher latitudes. We applied a 1D MOLA inversion technique (Multiplicative Optimally Localized Averages, see e.g. Corbard et al. 1998). The MDI+GOLF and GOLF-alone splittings (when the former are unavailable) were completed for with splittings from LOWL. The direct inversion of the data leads to a rigid rotation from the base of the convective zone at down to (see upper panel of Fig 2). Below there is a decrease in the rotation rate of the solar equator, as mentioned previously by several authors. Depending on the regularization parameter, this decrease is more or less pronounced (here we show the profile with the most pronounced decrease). However, the 1D inversion with the sectoral splittings relies on the assumption that the rotation rate at any latitude is equal to the rate at the equator.
As the differential rotation of the convective zone implies the higher latitudes rotate more slowly than the equator, we need to correct the splittings for this contribution. Therefore, we add nHz to the splittings, nHz to the , and nHz to the , following Corbard et al. (1998). The values of these corrections were derived from a 2D Regularized Least-Squares inversion of MDI data in the convective zone, by comparing the splittings computed with the exact linear relation (that involves the 2D rotational kernels and rotation profile) with the splittings computed with the 1D sectoral approximation. We present on the lower panel of Fig 2 the profile derived with the corrected splittings. We obtain a flat profile in the radiative interior. The dip around might be due to the absence of correction of the LOWL splittings but we cannot rule out a physical phenomenon at the limit of the nuclear core.
This careful inversion of our most precise seismic data therefore favors a flat rotation curve at nHz in the solar radiative interior. This lends support for a magnetic field strong enough to suppress any differential rotation that might arise from an angular momentum redistribution through the gravity waves (Talon, Kumar, & Zahn 2002). We think that the absence of a decrease or increase in the rotation rate, compared with previous works, is mainly due to the quality of the present data and the limitation in the degradation of these data by the external layers. We note that an increase of the rotation rate seems now very unlikely down to , but cannot be ruled out below by the present gravity-mode analysis (Turck-Chièze et al. 2002).
We have also reduced the MDI+GOLF splittings to coefficients (Schou et al. 1994) by removing (for ) and (for ) estimated from our knowledge of the rotation in the convection zone. This allows us to combine them directly with LOWL coefficients and carry a 1D inversion for a latitudinally averaged rotation rate. This gives results nearly identical to the one shown on the bottom panel of Fig 2. Finally, we also suppressed the solar cycle effects for intermediate- and high- by using only the first year of LOWL data. Of course this increases the vertical error bars but does not change the rotation profile.
6 Summary
By using the high-quality seismic data from the spatial instruments GOLF & MDI, and by using only the low- modes, we limit the effects of the variable magnetic field that takes place in the outer layers and obtain a very coherent dataset for rotation below the solar convection zone. While a proper treatment of the latitudinal dependence of the rotation speed is still needed to extract the rotation in the core from 1D inversions, the method we apply here removes the effect of latitudinal variation of the rotation in the convection zone, and we obtain a flat rotation profile down to 0.2 . This puts a strong constraint on the redistribution of the angular momentum. The uncertainties in the rotation rate are still quite large below : progress on this point can be achieved by the detection of mixed low- pressure modes, and gravity modes.
Acknowledgments
GOLF & MDI instruments are cooperative efforts (of French and Spanish institutes for GOLF) to whom we are deeply indebted. SoHO is a project of international cooperation between ESA and NASA. S.C. acknowledges the support of a CEA/Saclay doctoral Grant and the NASA Grant NAG5-10483. We wish to thank ECHO team for providing us the LOWL mode parameters.
References
- (1) Appourchaux, T., Gizon, L., & Rabello-Soares, M.-C. 1998, A&AS, 132, 107
- (2) Chaplin, W. J., et al. 1999, MNRAS, 308, 405
- (3) Chaplin, W. J., et al. 2001, MNRAS, 327, 4, 1127
- (4) Chaplin, W. J., et al. 2003, MNRAS, in press
- (5) Corbard, T., et al. 1997, A&A, 324, 298
- (6) Corbard, T., et al. 1998, in SoHO 6/GONG98 workshop proceedings, ESA SP-418, 741
- (7) Couvidat, S. 2002, PhD dissertation, Univ. Paris VII, Paris
- (8) Eff-Darwich, A., Korzennik, S. G., & Jiménez-Reyes, S. J. 2002, ApJ, 573, 857
- (9) Ehgamberdiev, Sh. A., et al. 2001, in Proceedings of the IAU symposium, 203, 97
- (10) García, R. A., et al. 2003, in SoHO 12/ GONG+ 2002 meeting proceedings, ESA SP-517
- (11) Henney, C. J., et al. 1999, A&A, 348, 627
- (12) Jiménez-Reyes, S. J. 2001, PhD dissertation, Univ. La Laguna, Tenerife
- (13) Lazrek, M., et al., 1996, Sol. Phys., 166, 1
- (14) Nigam, R., & Kosovichev, A. G. 1998, ApJ, 505, L51
- (15) Percival, D. B., & Walden, A. T. 1993, Spectral Analysis for Physical Applications. Multitaper and Conventional Univariate Techniques, Cambridge University Press
- (16) Schou, J., Christensen-Dalsgaard, J., & Thompson, M. J. 1994, ApJ, 433, 389
- (17) Talon, S., Kumar, P., & Zahn, J.-P. 2002, ApJ, 574, L175
- (18) Turck-Chièze, S., et al. 2002, ApJ, submitted