Optical and Infrared Observations of Anomalous X-ray Pulsars
Abstract
The detection of optical/infrared counterparts to Anomalous X-ray Pulsars (AXPs) has greatly increased our understanding of these systems. Models for the AXP phenomenon were based upon their X-ray emission, and all but the magnetar model made predictions for the optical/infrared that have now been falsified.
With detections in hand, detailed studies of the optical/infrared to X-ray flux ratios, variability, and the spectral energy distributions have become possible. We present new data on two AXPs taken with Keck and Magellan, and compare the results with predictions made in the context of the magnetar model, in which the emission is due to ion currents flowing in the G magnetosphere of young neutron stars.
University of Toronto, 60 St George St, Toronto, M5S 3H8, Canada
Universiteit Utrecht, Postbus 80000, 3508 TA Utrecht, Netherlands
1. Introduction
Anomalous X-ray Pulsars (AXPs) have been classified as a distinct category of neutron stars on the basis of observational properties which they share in common. They were detected as X-ray sources with long (10s) pulse periods. The term anomalous refers to the fact that the power associated with rotational energy loss through spin-down is not sufficient to produce the observed luminosities, nor were they obviously associated with binary companions.
If they are short-lived, as supernova remnant associations suggest, then AXPs along with the Soft Gamma-ray Repeaters (SGRs) and Dim Isolated Neutron Stars (DINSs) hint at a large population of neutron stars which differ considerably to the radio pulsars and X-ray pulsars in binaries.
The earlies models were based purely on the X-ray properties of AXPs, but with the identification and photometry of the first optical and infrared counterparts, it became possible to test these models against the measured flux ratio .
Currently, the forerunner to explain these objects is the magnetar model (Thompson & Duncan, 1996), in which AXPs are neutron stars whith dipole magnetic fields of order Gauss, the decay of which supplies the energy of the observed luminance. Thus they are thought to be very similar objects to the SGRs when in quiescence, although bursting activity has now been seen from AXPs also. This brings into view the prospect of probing the physics of super-QED field physics. One would expect to see variation in the optical or IR, if the emission at those wavelengths is directly related to the processes causing the bursting activity.
Since these first measurements, further optical and infrared observations have been undertaken. It is now starting to be possible to construct spectral energy distributions and to look for broad features. In this way, we can gain more information and another handle on these intriguing objects.
2. AXP 4U 0142
Optical and infrared images were taken of the field of AXP 4U 0142+61 using LRIS and NIRC at Keck respectively.
The object was clearly seen in the V, R, I, K and Ks bands, but after two hours of integration there was only a marginal () detection in the B band, which could be seen either as a tentative detection or a hard upper limit in magnitude. On the plot, Figure 2, the spectral energy distribution (SED) of 4U0142 is shown from the infrared to the X-ray, de-reddened with an , the figure inferred from the X-ray column density of hydrogen.
The points to note are that the optical/IR spectral points do not match extrapolations of the blackbody + power law spectrum which was fit to the X-ray (White et al, 1996); there appears to be a break in the continuum in B; there is a marked difference between the K and Ks bands which, due to their spectral proximity, is most easily attributed to variability (since the respective measurements were taken over two and a half years apart). Conversely, the optical flux appears to have been stable.
The choice of reddening has a marked impact on the shape of the SED, but the above three statements remain valid for the range of that has been suggested, i.e. from a nearby OB association (Hulleman et al, 2001) to from the Hydrogen column inferred from the X-ray spectrum (Patel et al, 2002). Full details of these results are presented in Hulleman (2003).
3. AXP 1E 1048
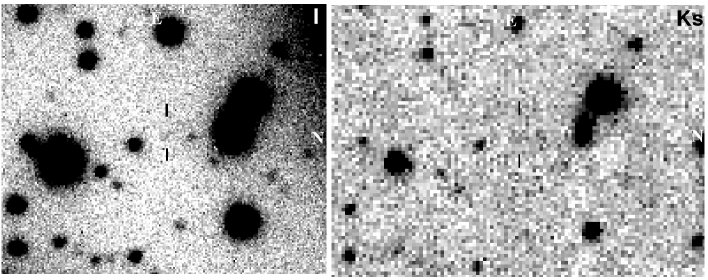
Optical and infrared images were taken of AXP 1E 1048.1-5937 using MagIC and PANIC on the Magellan II (Clay) telescope, Las Campanas and using ISAAC at VLT. See Figure 1 for the I- and Ks-band images. The analysis is still ongoing, and the results presented here are thus preliminary.
The object was detected in the I band at an apparent magnitude of after over two hours’ exposure time at superb seeing conditions of . This may fairly be said to be at the limits of what is possible at the current time. Also, it is worth noting that our Ks band magnitude of is already fainter than that which was measured by Wang & Chakrabarty (2002), but consistent with the upper limits measured by Israel et al (2002). Thus the hope is clearly that here we are seeing the AXP in its quiescent state.
See again Figure 2 where the points for this AXP are also plotted, de-reddened with (Wang & Chakrabarty, 2002). We see that the gradient of the spectrum from Ks to I is now different to what was seen before, different to 4U 0142+61; and that the infrared emission has varied considerably.
4. Implications

The results above seem to suggest that the optical emission seems stable whereas the near infrared emission is highly variable. This in turn suggests that the source for the optical and the infrared emission is different, and perhaps that the latter is related in some way to, or more influenced by bursting activity.
The Magnetar model gives a qualitative explanation for the optical/IR flux, in terms of ion currents flowing through the magnetosphere which maintain the global twist in the magnetic field. If this is so, then one would expect a relationship between the torque working on the star and the optical flux. Thus the comparison of optical emission to the spin down history of the AXPs will yield this relationship, and so it is vital that both optical and X-ray monitoring are continued.
There is also the suggestion that the magnetar model may be able to explain the spectral break (seen in the B band of 4U 0142) coming from a particular radius in the magnetosphere, having a weak breaking frequency dependence on the magnetic field (). This is can be verified with further photometry.
References
Hulleman, F., Tennant, A. F., van Kerkwijk, M. H., Kulkarni, S. R., Kouveliotou C., & Patel, K. 2001, ApJ 563, L49
Hulleman, F., van Kerkwijk, M. H., Kulkarni, S. R., 2003, A&A, submitted.
Israel, G. L., Covino, S., Stella, L., Campana, S., Marconi, G., Mereghetti, S., Mignani, R., Negueruela, I., Oosterbroek, T., Parmar, A. N., Burderi, L., & Angelini, L. 2002, ApJ 580, L143
Patel, S. K., Kouveliotou C., Woods, P. M., Tennant, A. F., Weisskopf, M. C., Finger, M. H., Wilson-Hodge, C., Gurus, E., van der Klis, M., & Belloni, T. 2003, ApJ 587, 367
Thompson, C., Duncan, R. C., 1996, ApJ 373, 322
White, N. E., Angelini, L., Ebisawa, K., Tanaka, Y., Gosh, P. 1996, ApJ 463, L83
Wang, Z., & Chakrabarty, D. 2002, ApJ 579, L33