Hubble Space Telescope Observations of cD Galaxies and their Globular Cluster Systems11affiliation: Based on observations with the NASA/ESA Hubble Space Telescope obtained at the Space Telescope Science Institute, which is operated by the Association of Universities for Research in Astronomy, Inc., under NASA contract NAS 5-26555 22affiliation: Based in part on observations obtained at the European Southern Observatory, for the VLT program 68.D-0130(A).
Abstract
We have used WFPC2 on the Hubble Space Telescope to obtain F450W and F814W images of four cD galaxies (NGC 541 in Abell 194, NGC 2832 in Abell 779, NGC 4839 in Abell 1656 and NGC 7768 in Abell 2666) in the range km s-1. For NGC 541, the HST data are supplemented by ground-based and images obtained with the FORS1 on the VLT. We present surface brightness and color profiles for each of the four galaxies, confirming their classification as cD galaxies. Isophotal analyses reveal the presence of subarcsecond-scale dust disks in the nuclei of NGC 541 and NGC 7768. Despite the extreme nature of these galaxies in terms of spatial extent and luminosity, our analysis of their globular cluster systems reveals no anomalies in terms of specific frequencies, metallicity gradients, average metallicities, or the metallicity offset between the globulars and the host galaxy. We show that the latter offset appears roughly constant at 0.8 dex for early-type galaxies spanning a luminosity range of roughly four orders of magnitude. We combine the globular cluster metallicity distributions with an empirical technique described in a series of earlier papers to investigate the form of the protogalactic mass spectrum in these cD galaxies. We find that the observed GC metallicity distributions are consistent with those expected if cD galaxies form through the cannibalism of numerous galaxies and protogalactic fragments which formed their stars and globular clusters before capture and disruption. However, the properties of their GC systems suggest that dynamical friction is not the primary mechanism by which these galaxies are assembled. We argue that cDs instead form rapidly, via hierarchical merging, prior to cluster virialization.
Subject headings:
galaxies: elliptical and cD — galaxies: individual (NGC 541, NGC 2832, NGC 4839, NGC 7768) — galaxies: star clusters — galaxies: structure1. Introduction
In spatial extent and luminosity, cD galaxies are intermediate between normal galaxies and galaxy clusters. Indeed, the cD classification itself was introduced in the work of Matthews, Morgan & Schmidt (1964) to denote the very large D galaxies that they found in some clusters. (The ‘c’ prefix was borrowed from the notation for supergiant stars in stellar spectroscopy.) Although the extraordinary sizes of cD galaxies was readily apparent to Matthews et al. (1964), the outstanding nature of their distinctive envelopes was fully appreciated only after the deep photographic surface photometry of Oemler (1976) and Schombert (1986; 1988).
In this paper, we adopt the definition of a cD as given in Schombert (1986) and Tonry (1987). That is, cDs are elliptical galaxies with shallow surface brightness profiles
at mag arcsec-2. These galaxies exhibit a characteristic ‘break’ over an law, beginning at kpc, and are much brighter than typical elliptical galaxies, with luminosities 10 (Sandage & Hardy 1973; Schombert 1986). cD galaxies are always found in dense regions, and in virtually all cases, they are located near the spatial and kinematical center of their host cluster, or subcluster. These facts would seem to suggest that the formation of cD galaxies is unique to the cluster environment and is closely linked to its dynamical history.
There are, in fact, reasons to believe that the envelopes themselves are distinct entities from the galaxies themselves. First, cD envelope luminosity is weakly correlated with some properties of the host cluster, most notably with cluster richness and X-ray luminosity (Schombert 1988). Second, the envelopes have surface brightness profiles with power-law slopes that are similar to those measured from the surface density profiles of the surrounding cluster galaxies. Finally, both the position angle and ellipticity of cD galaxy isophotes commonly show discontinuities at , where the envelope begins to dominate the surface brightness profile (Schombert 1988; Porter, Schneider & Hoessel 1991).
Models for the formation of cD galaxies have tended to focus on dynamical effects that, in dense environments, might produce extended low-surface-brightness envelopes. A tidal stripping origin was first proposed by Gallagher & Ostriker (1972), and examined in detail by Richstone (1976). In this scenario, close encounters between galaxies liberate material which surrounds the central galaxy; if the velocity of the encounter is sufficiently low, the interaction may result in a merger. The most massive galaxies would be preferentially depleted as they are most strongly affected by dynamical friction. If many such mergers occur, then the central galaxy may grow primarily through this process of “cannibalism”. The rates for galactic cannibalism in rich clusters were computed first with approximate theories that used average interaction rates without considering the actual galaxy trajectories (Ostriker & Tremaine 1975; White 1976), and later with Monte Carlo techniques (Hausman & Ostriker 1978). These calculations predicted rather high cannibalism rates in rich clusters, leading to a luminosity growth of the first ranked of over the lifetime of the host cluster. The finding that 50% of brightest cluster galaxies (BCGs) contain multiple nuclei (, Hoessel & Schneider 1985) has sometimes been interpreted as supporting evidence for this model.
Richstone & Malumuth (1983) carried out more detailed simulations of the growth of central galaxies by following the trajectories of individual galaxies in a fixed cluster potential. Approximately 30% of their simulations produced very massive galaxies at the cluster center, which they identified as cD galaxies. In their simulations, which treated dynamical friction, mergers and tidal stripping simultaneously, the growth of the cD occurred throughout the lifetime of the cluster. Merritt (1984; 1985) reached a rather different conclusion using a statistical description of the galaxy orbital energy and mass distribution, and a Fokker-Planck treatment of the evolution of these distributions due to tidal stripping and dynamical friction. He found that neither tidal stripping nor mergers occur at a significant rate in rich clusters after virialization, and concluded that the morphology of BCGs in a rich cluster — and of cDs in particular — is fixed during the early stages of cluster evolution, probably during the collapse and virialization of compact groups or poor clusters. In the post-collapse stages of evolution, the central galaxy was found to grow in luminosity by only . Dynamical analysis of galaxies with multiple-nuclei led Merrifield & Kent (1991) and Blakeslee & Tonry (1992) to conclude such galaxies have probably increased their luminosities by no more than 1-2 over a typical cluster lifetime as a result of galactic cannibalism. These findings are consistent with the modest post-virialization growth rates advocated by Merritt (1985).
In principle, the formation of central galaxies in cluster and group environments is best studied with high-resolution, N-body simulations (, Funato, Makino & Ebisuzaki 1993; Bode et al. 1994; Garijo, Athanassoula & García-Gómez 1997). The results of such simulations, however, depend sensitively on the assumed initial conditions, so it is important to start with a physically-motivated paradigm of structure formation. The first attempt to do so was by Dubinski (1998), who followed the formation and evolution of the central BCG within a single rich cluster chosen from a cold-dark-matter simulation. In his simulation, which included both stellar and dark matter components, a massive central central galaxy formed via the merger of several massive “protogalaxies” early in the cluster history. Due to the filamentary structure of the cluster at these times, the mergers themselves were found to be highly anisotropic, with the protogalaxies infalling radially along with filaments. In agreement with previous findings, Dubinski (1998) found that cannibalism by dynamical friction during the post-collapse evolution accounts for only a small fraction of the accreted mass. It is worth noting, however, that the central galaxy in his simulation did not develop the extended envelope that is characteristic of cD galaxies.
Another, quite different, formation model for cD galaxies involves cooling flows (see, , Fabian 1994). Since the radiative cooling times for intracluster gas are short enough that gas can cool and settle to the cluster center, it has been suggested that cD envelopes may arise from the gradual deposition of this cool gas. However, this possibility now seems remote in light of XMM-Newton observations that the X-ray gas does not cool significantly below a threshold temperature of 1-2 keV (Kaastra et al. 2001; Peterson et al. 2001; Tamura et al. 2001).
Clearly, an understanding of the mass distribution of the galaxies and protogalaxies from which cD galaxies were assembled would be helpful in discriminating between the various models. Globular clusters (GCs) are useful in this regard since they are bright (with a mean absolute magnitude of mag; Harris 2001) and are found in large numbers around massive, early-type galaxies. Moreover, observations of nearby dwarfs and giant ellipticals have shown that there is a tight correlation between mean GC metallicity and the total galaxy luminosity (, Brodie & Huchra 1991). Thus, GCs should be powerful diagnostics of the cD formation process since the total luminosities and masses of the cannabilized galaxies (assuming cD galaxies formed in this way) must be imprinted in the metallicities of their present-day GC systems. Yet color (and thus metallicity) information is available in the literaure for the GC systems of only five cD galaxies111Based on the compilation of van den Bergh (2001). Note that we include M87 as a cD galaxy (de Vaucouleurs & Nieto 1978) and have added NGC 6166 (Bridges et al. 1996) to his list..
In this paper, we present and photometry of the GC systems of four distant cD galaxies and place constraints on the distribution of progenitor masses. This sample nearly doubles the number of cD galaxies with GC metallicity distributions. The paper is organized as follows. In §2, we describe the observations and data reduction procedures. §3 presents a summary of the observed properties of the galaxies and their GC systems. In §4, we present an analysis of the observed GC metallicity distribution functions. We summarize our findings and draw conclusions in §5.
2. Observations and Data Reduction
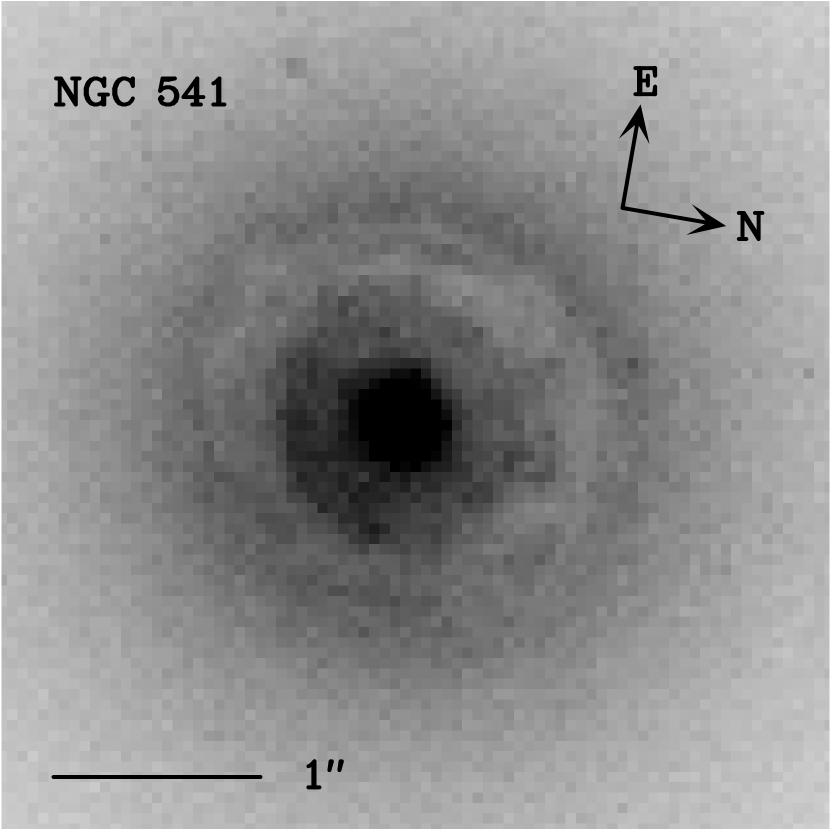
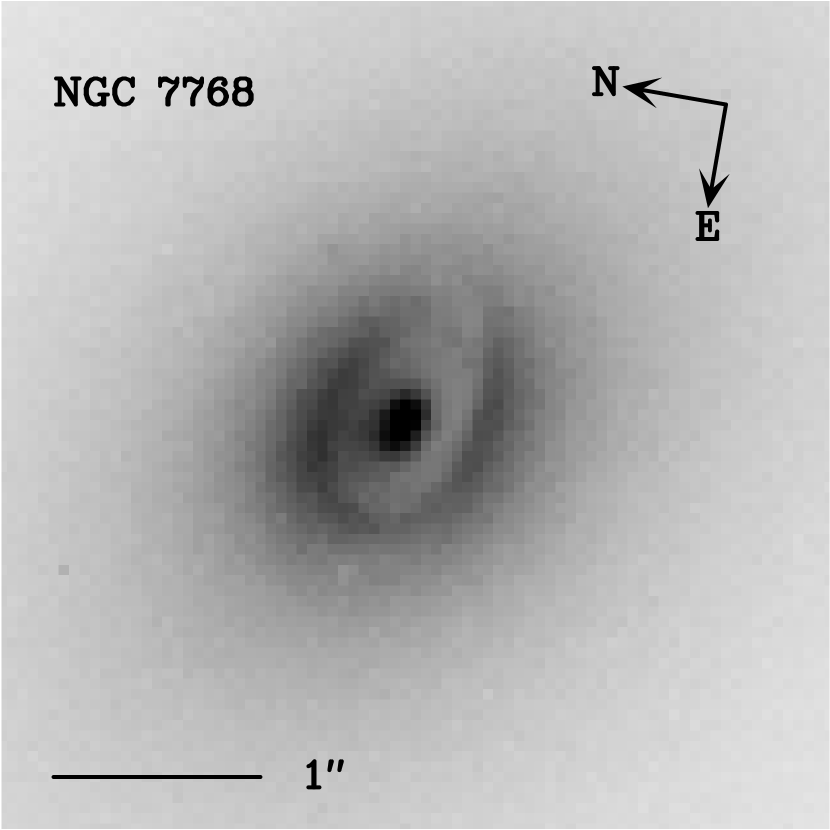
We used WFPC2 on board HST to obtain F450W (broadband ) and F814W (broadband ) images of four cD galaxies: NGC 541, NGC 2832, NGC 4839 and NGC 7768. The observations, corresponding to program GO-8184, are summarized in Table 1. Three of the galaxies (NGC 2832, NGC 4839 and NGC 7768) were selected from the sample of Schombert (1986). The fourth galaxy, NGC 541, was selected from the compilation of Bird (1994), although it has in the past been variously classified as D or cD (, Dressler 1980; Bird 1994). To clarify the issue of its morphological type, we subsequently obtained and images of NGC 541 with the VLT. These data and our analysis of them are presented in §2.1.1. Properties of the host clusters for each of our program galaxies are summarized in Table 2.222Throughout this paper, we identify NGC 4938 with the subcluster projected 1.1 Mpc to the southwest of the Coma cluster center.
The raw WFPC2 data were processed with the standard STScI pipeline using the best available calibration files. We verified that the images were properly aligned with cross-correlation measurements of the shifts using the DITHER package in IRAF333IRAF is distributed by the National Optical Astronomy Observatories, which are operated by the Association of Universities for Research in Astronomy, Inc., under cooperative agreement with the National Science Foundation.. Cosmic rays were rejected by combining images of a given galaxy and filter using the IRAF task GCOMBINE.
2.1. Surface Photometry
The images were “mosaiced” using the task WMOSAIC in the STSDAS package. Bad pixels, regions affected by vignetting, and any remaining cosmic rays were masked. The images were visually inspected and any bright contaminating objects present in the fields were also masked. Surface photometry was performed with the task ELLIPSE, which is based on an algorithm by Jedrzejewski (1987). The algorithm was run on the image and the resulting solution was transferred to the band image, where ELLIPSE was run in “no-fit” mode. The conversion to Johnson and magntiudes was done in the same manner as for the point sources (see §2.2) except that an additional mag correction was applied to correct the zeropoints to infinite aperture (Holtzman et al. 1995).
A common difficulty in performing surface photometry with WFPC2 is the limited field of view, which greatly complicates the estimation of the background sky brightness. Simply stated, the galaxies are still apparent even in the outskirts of our images. One approach to this problem is to fit a parametric curve (such as a de Vaucouleurs law or a power-law model) plus some constant background to a section of the profile, and estimate the sky directly from the fit. In our case, such a procedure is unsatisfactory. For the cD galaxies examined here, it is risky to assume a specific functional form when there is no a priori knowledge of where envelope will appear. Furthermore, sky measurements arrived at in this way will have independent errors in different bandpasses, potentially biasing the inferred color profiles at faint levels. Finally, as emphasized by Schombert (1986), no parametric function can capture the peculiarities of the profiles that may affect the sky estimates.
In an attempt to alleviate these problems, we adopted the following procedure. In the outskirts of our fields, the galaxy contribution to the total intensity, though non-negligible, is nevertheless small. By estimating the ratio of the sky intensities directly from the ratio image of the and images, it is possible to reduce the uncertainty in the estimated sky color. Let us denote the counts due to the sky in the and bandpasses by and , respectively, and the corresponding intensities from the galaxy light by and . Quite generally, the galaxy intensities in the different bandpasses will be certain fractions of the sky intensities: , and . For a typical giant elliptical, (, Fukugita, Shimasaku & Ichikawa 1995; see below also) whereas the color of the “sky” seen by HST is (HST Data Handbook). In general, we then have
and, if we estimate the ratio, , of the sky intensities in the outskirts of the fields,
The value of was calculated for a range in plausible values of and . The distribution of is sharply peaked at , with an interquartile range of and a median of . We therefore take for our estimate of , with estimated directly from the ratio image.
Since the galaxies are fainter with respect to the sky in the bluer bandpass, was determined from the outer regions of the images, along the direction where the profile declines most steeply. The sky brightness in was then obtained from . Note that in the regions where was measured, the galaxy contribution is at least a factor of 20 less than that of the sky. We further restricted the final surface brightness profiles to be no more than 2.5 mag fainter than the estimated sky to guard against an artificial drop in the profile due to background contamination by galaxy light. This procedure was used for all galaxies except NGC 2832, which extends well beyond the WFPC2 field even in the band. In this case, the estimate of would be badly biased so we fixed the -band sky value by matching our photometry to the -band profile of Peletier et al. (1990). The main advantage of this sky estimation method is that it guarantees a priori that the measured sky color will be close to its actual value.
Surface brightness measurements for the four galaxies are presented in Table 3, along with the results of our isophotal analysis. Surface brightness profiles are shown in the leftmost panels of Figures 1–4. Profiles from the literature are shown for comparison. We stress that, in the case of NGC 2832, the agreement at faint levels is forced upon our photometry for the purpose of sky determination. For the remaining galaxies, the profiles are fully independent from those in the literature. In each case, the agreement is good except for the outer parts of NGC 541, where the profile of de Juan, Colina, & Pérez-Fournon (1994) turns downward compared to ours. We speculate that this downturn might be a consequence of their overestimating the background level: since our sky estimates are taken directly from the WFPC2 images, they are unlikely to be underestimated.
Radial profiles of ellipticity, major-axis position angle and the parameter444 indicates “boxy” isophotes if negative and “disky” ones if positive (Jedrzejewski 1987). are shown in the right panels of Figures 1–4. As is common among BCGs, the ellipticities of NGC 541, NGC 4839 and NGC 7768 tend to increase with galactocentric radius (, Porter et al. 1991) while their major-axis position angles tend to align with those of the surrounding clusters (, Plionis 1994; West 1994; Kim et al. 2002). The ellipticity of NGC 2832 also increases with galactocentric radius, but in this case, the galaxy’s major-axis at large radii is oriented almost perpendicularly to the surrounding cluster. Note that the profiles of NGC 541 and NGC 7768 flatten abruptly at small radii (). As Figure 5 clearly shows, the flattening in both case is due to the presence of compact dust disks in their nuclei. Tran et al. (2001) find such compact disks in 18% of the objects in their WFPC2 survey of early-type galaxies. It is curious that two of the four cD galaxies in our sample contain such disks.
2.1.1 NGC 541: Comparison with VLT ground based photometry
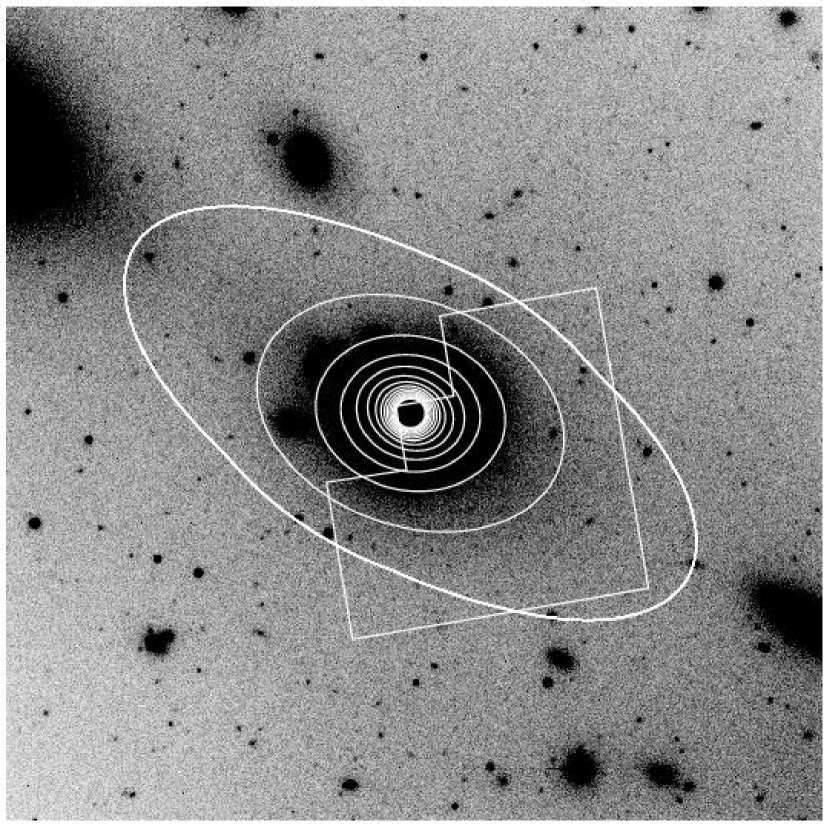
As mentioned in §1, the cD classification requires the presence of an envelope that departs from an -law at low surface brightness. Our HST profile for NGC 541 shows such an envelope starting at , but we note that this galaxy has in the past been classified as both cD (Bird 1994) and D (Dressler 1980). To better characterize the surface brightness profile at large radii, we obtained and images of NGC 541 with FORS1 on the VLT on 12 December, 2001 (see Figure 6). Exposure times were and seconds in , and and seconds in . The short exposures were used to replace those pixels close to the galaxy center that were saturated on the long exposures. The FWHM of isolated stars on the images was measured to be in and in . The ground-based data, which have much greater areal coverage than the HST data and thus offer a more direct means of measuring the local background level, were reduced using standard IRAF routines and surface photometry was performed with the task ELLIPSE. Because the observations were taken in non-photometric conditions, the HST photometry was used to set the photometric zeropoints by matching the profiles in the range .
The HST and VLT profiles are compared in Figure 7. An envelope is clearly seen in the ground-based profile, confirming the classification of NGC 541 as a cD galaxy. There is generally good agreement between the two datasets, except at the faintest levels where the HST profile shows a steeper decline. The increase in ellipticity for that was suggested by the HST data in Figure 1 is readily apparent in the VLT data. It is also apparent that, in the transition region between the PC and WF chips (typically around ), the isophotal parameters derived from the HST data are somewhat less reliable because of the limited and varying areal coverage in this region.
As the ground-based surface brightness profile becomes shallower at large radii, increases dramatically. This behavior can be understood by inspecting Figure 6. Beyond , there is significant contamination by close companions, both to the northeast and southwest. In fact, the various profiles overlap, producing a rather linear structure that runs diagonally through the field. As a result, the isophotes of NGC 541 have elongated ends that are aligned with this feature. This behavior, which is manifested as an increase in the parameter for the outermost isophotes, is unlikely to be is an artifact the sky estimation, since the slope of the surface brightness profile changes rather abruptly, and setting the sky to obvious overestimates does not make the increase in disappear. Given the presence of significant structure in the background light, what we are seeing is probably a consequence of our using a single value to characterize a varying background in the vicinity of NGC 541. The surface brightness profiles shown in Figure 7 should therefore be treated with some caution beyond .
2.2. Point Sources: Detection, Classification and Photometry
GCs at the distances of our program galaxies appear as unresolved point sources, even in the PC frames, so their analysis is readily amenable to PSF-fitting photometry. The images were first corrected for geometric distortion (Holtzman et al. 1995), and detection frames were created by applying a ring median filter (Secker 1995) with a radius of five pixels for the PC and four pixels for the WF frames in order to eliminate the underlying galaxy light and to detect those sources with scale-lengths smaller than the filter radius. Detections were performed independently in both filters using SExtractor (Bertin & Arnouts 1996) after setting the detection threshold to three connected pixels with counts above the local background in the detection image (which was convolved with a gaussian filter). For some of our frames, there was an insufficient number of suitable stars to build an PSF directly, so we created empirical PSFs from archival observations and used these PSFs in the analysis of our program images.555The F814W and F450W PSF were constructed from images of the Sagittarius dwarf galaxy (GO6701), and Andromeda VI (GO8272), respectively. Approximately one hundred stars per filter and chip were used to construct quadratically varying PSFs with radii of ten pixels for the PC and five pixels for the WF chips. Using these PSFs, photometry was performed with DAOPHOT II (Stetson 1987; 1993), and the object lists in both the F814W and F450W filters were matched. Only those sources detected in both filters were retained.
Corrections for charge transfer efficiency were carried out using the prescriptions of Dolphin (2000), and standard HST magnitudes were measured using the zeropoints given in Holtzman et al. (1995). The conversion to Johnson and was done using the following transformations (J. Holtzman, private communication), where ,
A reddening correction was applied using the values of obtained from the DIRBE maps of Schlegel, Finkbeiner & Davis (1998) and the extinction curve of Cardelli, Clayton & Mathis (1989). Additionally, a k-correction was applied to the colors as described in §2.3. Since at this stage the candidate lists still contain significant contamination from compact background galaxies and foreground stars, additional selection criteria were imposed to obtain “cleaned” lists of GCs. Specifically, we discarded objects whose DAOPHOT statistic666The DAOPHOT is a robust estimate of the ratio of the observed to expected scatter about the model profile (Stetson & Harris 1988). exceeded in both and , and whose SHARP parameters777The DAOPHOT SHARP parameter is an image radius index which is greater than zero if the object is more extended than the expected stellar profile and less than zero when the detection appears sharper. The expected value for a point source is zero (Stetson & Harris 1988). fell outside the range SHARP . We also discarded objects with magnitudes more than brighter than the peak of the GC luminosity function (GCLF) in either or I, where mag is the typical dispersion of the GCLF (Harris 2001). In doing so, we adopted and mag for the GCLF “turnover” magnitudes, displaced to a distance obtained from the mean cluster redshift using km s-1 Mpc-1 (Freedman et al. 2001).
Artificial star tests were performed to calculate the completeness function and to assess the extent to which our culling procedures would reject bonafide GCs. A total of 10,000 stars were added to each chip, 50 stars each time so as not to alter significantly the crowding characteristics of our frames. Artificial stars had magnitudes in the range mag and was randomly assigned a value assuming the color distribution is a Gaussian with the observed mean and dispersion for each galaxy. The artificial frames were then subjected to the same reduction procedure as the real data. Based on these tests, we conclude that the above selection criteria reject of the artificial stars. Photometry for GC candidates in our four galaxies that have photometric uncertainties less than mag in both and is presented in Tables 4 – 7.
2.3. k-corrections
Our program galaxies have redshifts in the range . As we now show, redshift effects on the observed magnitudes and colors become significant at these distances. Since these effects depend rather strongly on the object spectrum, we derive below k-corrections for both the GCs and the host galaxies. In doing so, we make the assumption that the GCs are old objects, meaning that they are roughly coeval with GCs in the Milky Way. This assumption is supported by most observations of GCs belonging to luminous early-type galaxies in cluster environments (see Jordán et al. 2002 and references therein). Their broadband colors are then determined mainly by metallicity, and not by age (Worthey 1994).
The k-correction is defined as
where, following the notation of Poggianti (1997), is the luminosity measured at wavelength at the present time in the source rest frame, and is the filter transmission curve. In calculating k-corrections for the GCs, we used four template GC spectra, based on observations of Galactic GCs, having different metallicities and different levels of ultraviolet emission888The results for cluster types with different ultraviolet behavior are very similar so the corrections were averaged. (Bonatto, Bica & Alloin 1995). Specifically, we used their types G2b/r, G3b/r, G4b/r, G5, which have respective mean metallicities of [Fe/H] dex. To calculate the correction needed for solar-metallicity GCs, and for the galaxies themselves, we used the elliptical template of Kinney et al. (1996), which is based on spectroscopy of NGC 1399, NGC 1404, NGC 6868 and NGC 7196. The resulting k-corrections are presented in Table 8.
Figure 8 shows k-corrections, , plotted as a function of rest frame . The upper and lower sequences show the corrections for NGC 541 and NGC 7768, the galaxies with the lowest and highest redshifts in our sample. It is clear that the variation with is significant and must be accounted for. We take the corrected colors to be linearly related to the observed by
where the constants are given in Table 9.
In principle, we might also wish to correct the observed colors for evolutionary effects. However, any correction for the fading stellar populations in the color of these objects will be small compared to the k-correction. For instance, using the populations synthesis models of Maraston (1998), we find that the expected evolution in between and Gyr is mag for all metallicities. As the lookback time to our targets is Gyr, the evolution in color is expected to be mag — significantly smaller than the k-correction on the color. Note that the evolutionary effects on the observed magnitudes are, in general, not negligible compared to the k-corrections for our targets. However, there is a partial cancellation in the corrections, as both and fade with age (albeit at different rates). For the present work, we have applied a k-correction to just the colors, since we use the magnitudes only when calculating the specific frequencies in §3.3, and then only the band where the k-correction and evolutionary correction go in opposite directions. Thus, our results for the GC specific frequencies of these galaxies are quite insensitive to the correction ( the -band magnitudes vary by over the redshift range of our program objects).
3. Analysis
3.1. Color Magnitude Diagrams and Color Distributions
A remarkable finding from the past decade of GC research is that a majority of giant elliptical galaxies have GC systems with bimodal color distribution functions (, Gebhardt & Kissler-Patig 1999; Larsen et al. 2001). Because the colors of old stellar populations are more sensitive to metallicity than age, this bimodality implies the presence of two subpopulations of differing metallicity. In this section, we examine the color distributions of the GC systems associated with our cD galaxies, thus probing the GC chemical enrichment histories of early-type galaxies in their most extreme manifestation of luminosity and size.
Figure 9 presents color magnitude diagrams for the four GC systems. All objects classified as unresolved by our culling procedure are plotted in this figure. Magnitudes and colors have been corrected for reddening and extinction, and k-corrections have been applied to the observed colors. It is apparent that none of the GC systems show obvious sequences arising from the presence of two subpopulations. This impression is confirmed in Figure 10, where we plot color distributions for all objects with mag. The solid line is a kernel density estimate of the color distribution (Silverman 1986) obtained with a normal kernel. The adopted smoothing parameter was chosen using the prescription of Silverman (1986) which is well suited to a wide range in densities and is trivial to evaluate: where . The dashed curves show confidence bands obtained with a smoothed bootstrap procedure (Silverman 1986).
We have computed a variety of statistical indices for each of the color distributions shown in Figure 10, including biweight estimates of location, , and scale, , Finch’s (1977) asymetry index, , (akin to skewness) and Hoaglin, Mosteller & Tukey (1983) tail index, , (akin to kurtosis).999For a description of the asymetry and tail indices and some of their properties, see Bird and Beers (1993). See Beers, Flynn & Gebhardt (1990) for a description of the biweight estimators. The results are summarized in Table 10, where the upper and lower limits on each index represent confidence bands obtained with a bootstrap procedure. To within the uncertainties, the width of the distributions is the same for all galaxies, and it is clear that none of the distributions show statisitically significant skewness or extended tails beyond what would be expected from a parent Gaussian distribution. Similarly, the DIP test (see Gebhardt & Kissler-Patig 1999) accepts the hypothesis of unimodality for each of the distributions shown in Figure 10. We caution, however, that although bimodality is formally rejected in each case, the photometric errors, mag, are sufficiently large that intrinsic bimodality (with an expected separation between the modes of 0.30.4 mag in ; , Forbes et al. 1998) would be difficult to detect given the current samples.
3.2. Color Profiles and Offsets
Mean colors for our program galaxies and their GC systems are given in Table 11, which summarizes various observed and derived photometric data. From left to right, this table gives the galaxy name, adopted reddening, average colors for the galaxy and GCs, the total -band magnitude from RC3, the galaxy redshift, its total -band absolute magnitude, and approximate luminosity in units of . In Figure 11, we plot the colors of the GC candidates as a function of galactocentric distance for each of the four galaxies. The solid line in each panel is the best-fit linear relation for GCs with mag. The dashed-lines are profiles of the galaxy light measured from our HST images. In all four cases, as is typical for GC systems, there is a negative color gradient in the sense that the GC system becomes bluer with increasing galactocentric distance (, Strom et al. 1981). The GC color gradients parallel those of the underlying galaxies, with mean offsets ranging from 0.33 mag for NGC 541 to 0.50 mag for NGC 7768. If we make the somewhat daring assumption that the composite stellar populations of the galaxies follow the same color-metallicity relation as the globulars (Barmby et al. 2000), then these differences correspond to metallicity offsets in the range dex.
Indeed, the color/metallicity offset apparent in Figure 11 is a ubiquitous feature that is observed in galaxies ranging from faint, low-surface dSph/dE galaxies to the brightest and most massive early-type galaxies. The left panel of Figure 12 shows mean GC and stellar metallicity plotted as a function of host galaxy magnitude for a large sample of early-type galaxies. Note that this plot is an updated version of Figure 1 of Côté et al. (2000), to which we have added elliptical galaxies from the sample from Kundu & Whitmore (2001) and our four cD galaxies (shown as the circled points). Improved stellar metallicity determinations for several dwarf galaxies have been taken from Shetrone, Côté & Sargent (2001) and Tolstoy et al. (2003). For those galaxies from the survey of Kundu & Whitmore (2001), GC metallicities were calculated by combining their colors with the -metallicity relation of Barmby et al. (2000). Metallicities for the galaxies themselves come from the integrated-light spectroscopy of Trager et al. (2000) when available; for those galaxies lacking spectroscopic data, we estimated crude metallicities by combining their colors from RC3 (de Vaucouleurs et al. 1995) with the -metallicity relation of Barmby et al. (2000).
It is clear from the left panel of Figure 12 that the GCs and stars obey reasonably tight relations that run roughly parallel to each other. The right panel of this figure shows, for those galaxies that have metallicity determinations for both the stars and the GC systems, the offset between the two components. Remarkably, this offset is nearly constant over the whole range of galaxy magnitude. An -test indicates that the offset appears to be constant over the full range in galaxy magnitude, with a weighted mean value of [Fe/H] dex. We conclude that the metallicity offset between stars and GCs in these luminous cD galaxies is indistinguishable from that observed in normal ellipticals. This metallicity offset presents another apparently “universal” property of GC systems — analogous to the near-Gaussian nature of the GC luminosity function (Harris 2001) and the apparently constant efficiency of GC formation (Blakeslee et al. 1997; McLaughlin 1999a) — that must be explained by any viable model of GC formation.
3.3. Specific Frequencies
The GC specific frequency, , is a convenient measure of GC formation efficiency relative to field stars in the underlying galaxy (Harris & van den Bergh 1981; cf. McLaughlin 1999a). Possible dependencies of on morphological types have played an important role in the debate over how, and when, early-type galaxies form (Schweizer 1987; Ashman & Zepf 1992; van den Bergh 1995). Since the first “high-” giant galaxies to be identified (M87, NGC 1399, NGC 3311) were all cDs, it was believed that the cD environment was somehow conducive to the efficient formation of GCs relative to field stars (Harris 1988). However, with the acquisition of more and better data, it became apparent that not all cD galaxies had high specific frequencies (, Harris, Pritchet & McClure 1995), leading West et al. (1995) to propose a phenomenological model in which the GC specific frequency of BCGs correlates with the mass of the surrounding galaxy cluster. This suggestion was later confirmed observationally as a correlation between specific frequency and cluster velocity dispersion or X-ray temperature (Blakeslee, Tonry & Metzger 1997; Blakeslee 1999). In other words, it appears that the properties of the surrounding galaxy cluster are connected to both the cD envelope and the overall number of GCs, and that the mere presence of an envelope is not enough to guarantee a high GC specific frequency.
To measure GC specific frequencies for our program galaxies, we must first estimate the sizes of their GC systems using the bright end of the GCLF, which we observe directly. For data such as ours, which do not reach the turnover, any attempt to fit simultaneously for the number of GCs, the turnover magnitude, and the dispersion of the GCLF would be confounded by large and highly correlated errors in the derived parameters (Hanes & Whittaker 1987; Secker & Harris 1993). We therefore proceed by fixing the dispersion of the GCLF at mag and adopting mag for the -band absolute magnitude its turnover (Harris 2001).
To obtain the completeness-corrected luminosity function, we divide our GC sample into three radial regions: and . We determine the completeness function, , in each radial bin by fitting the function
to the results of our artificial star tests, where is the magnitude at which (Fleming et al. 1995). These functions were then used to correct the luminosity functions in each bin up to a magnitude obtained by averaging for the three regions. The three LFs were then added to find the completeness corrected LF for the full field.
We fit for in a GCLF of the form
where . Here is absolute magnitude of the GCLF turnover and is the distance modulus obtained from the observed redshift (see Table 2) and km s-1 Mpc-1 (Freedman et al. 2001), which is consistent with the value obtained from WMAP (Spergel et al. 2003). We assume the uncertainty in the turnover magnitude is due to the uncertainty of quoted in Harris (2001) plus the joint uncertainties arising from the distance determination (as a result of deviations from a pure Hubble flow) and the uncertainty in the Hubble constant itself. The combined error in the turnover magnitude due to the latter effects is
where we have adopted a constant value of km s-1 for the cluster peculiar velocity (Bahcall & Oh 1996). Clearly, these uncertainties should be viewed as lower limits since background contamination, photometric errors for the GCs, and model assumptions have not been included.
We take in equation (7) as our best estimate for the total number of GCs within our field. Since this is a metric quantity, it is denoted as hereafter. For each galaxy, is measured by calculating the integrated magnitude of the underlying galaxy within our WFPC2 field with the aid of the - and -band galaxy models presented in § 2.1. To convert these - and -band magnitudes into the bandpass, we assume typical colors for ellipticals as given in Fukugita et al (1995): mag and mag. Table 12 summarizes the GC specific frequency measurements for our cD galaxies. From left to right, this table records the galaxy name, absolute magnitude, total number of globular clusters, and GC specific frequency. Once again, these are all metric quantities.
It is interesting to note that none of these galaxies show high specific frequencies, their values being typical for ellipticals and even somewhat low for NGC 7768. Blakeslee et al. (1997) measured specific frequencies for NGC 2832, NGC 4839 and NGC 7768 as part of their survey of BCGs. Within the errors, our results are consistent with theirs for all three objects. NGC 7768 was also studied by Harris, Pritchet & McClure (1995), who obtained . Their result scales with their assumed value of for M87. In light of more recent measurements the GCLF parameters in M87 by Whitmore et al. (1995), we adopt for this galaxy (using the correction factor presented in equation 17 of McLaughlin, Harris & Hanes 1994). The Harris et al. (1995) measurement for NGC 7768 then falls to . This is in good agreement with our determination of . Finally, Marín-Franch & Aparicio (2002) find for NGC 4839 — slightly higher than, but still consistent with, our measurement of . This is the first determination of for NGC 541 and its value — like those of the two other galaxies for which X-ray luminosities of the host cluster are available (see Table 2) — is consistent with that expected from the cluster’s X-ray temperature and the - correlation presented by Blakeslee et al. (1997).
4. Constraints on the Merger Histories of cD Galaxies
As discussed in §1, the physical properties of cD galaxies, coupled with their unique locations near the dynamical centers of rich galaxy clusters, suggest that some aspects of their formation and/or evolutionary histories differ from those of normal elliptical galaxies. A wide range of evolutionary phenomena has been invoked to explain their properties, including cannibalism, tidal stripping, and star formation in coolings flows. Clearly, a resolution of the debate concerning which, if any, of these processes has played a role in the formation of cD galaxies would benefit from a knowledge of their merger histories.
4.1. Protogalactic Mass/Luminosity Spectra From Globular Cluster Metallicity Distributions
A method of using GC metallicity distributions to determine protogalactic mass spectra has been described by Côté et al. (1998; 2000; 2002). A full description of the method is presented in these papers, so here we simply note its basic assumptions and limitations. In brief, the method assumes that the protogalactic luminosity (and mass) spectrum can be approximated by a Schechter function (Schechter 1976), and that the present-day GC specific frequency of any surviving protogalactic “fragments” is . It is further assumed the galaxy under consideration has been assembled hierarchically, in a primarily dissipationless manner, so that no GCs are formed during mergers and interactions. In other words, star and GC formation during mergers are ignored entirely in this approach. The metallicities of individual GCs are instead taken to reflect differences in the depths of the gravitational potential wells in which they formed. Indeed, the tight empirical relation between mean GC metallicity and total galaxy magnitude, such as that shown in Figure 12, is prima facie evidence for the importance of local environment in the chemical enrichment of GC systems. As a consequence, we adopt a GC metallicity-host galaxy luminosity relation that is based on nearby dwarf galaxies and the metal-rich (bulge) GC populations of M31 and the Milky Way (Côté et al. 2002).
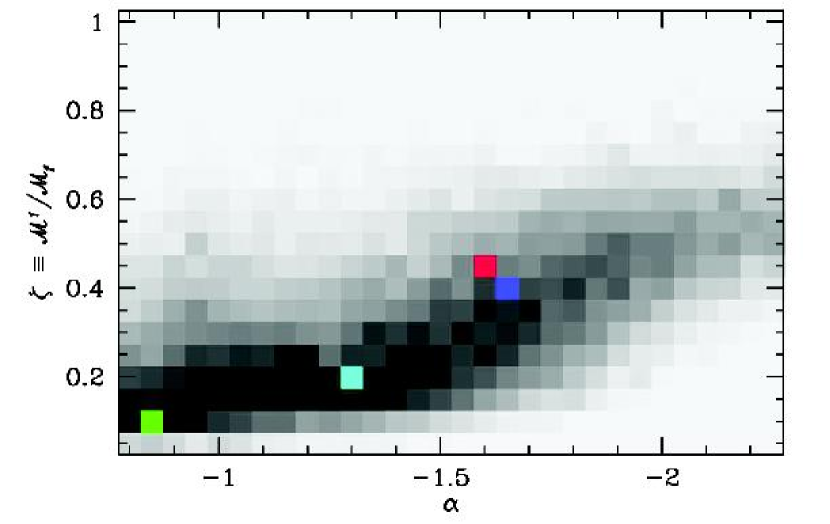
The implementation of the model proceeds as follows. Using the above model inputs, simulated GC metallicity distributions are generated over a grid in two parameters chosen to describe the mass spectrum101010In converting to masses, we assume a constant mass-to-light ratio of for all protogalactic fragments. of protogalactic fragments from which the galaxy was assembled: (1) the slope, , of the Schechter function from which the simulated protogalactic fragments were drawn; and (2) the ratio of the mass of largest protogalactic fragment, , to the final mass, of the assembled galaxy:
For each simulated GC system, we extract at random an identical number of GCs as contained in the actual sample and add the appropriate amount of measurement error to the simulated colors. The transformation between color and metallicity is performed using the transformations of Barmby et al. (2000). We restrict the sample of GCs to lie on the range 1.23 2.49 mag, which is equivalent to [Fe/H] dex. This generous range is expected to include the vast majority of bona fide GCs in these galaxies (see, , Beasley et al. 2000; Cohen, Blakeslee & Côté 2003).
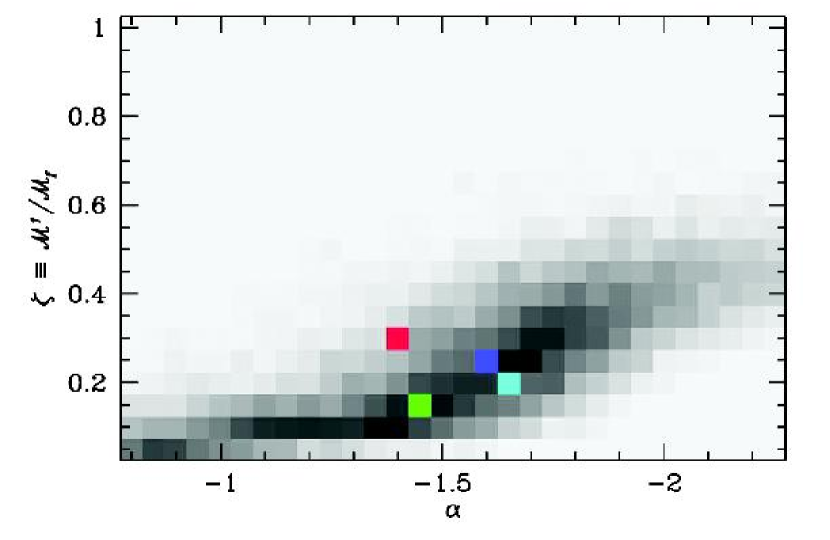
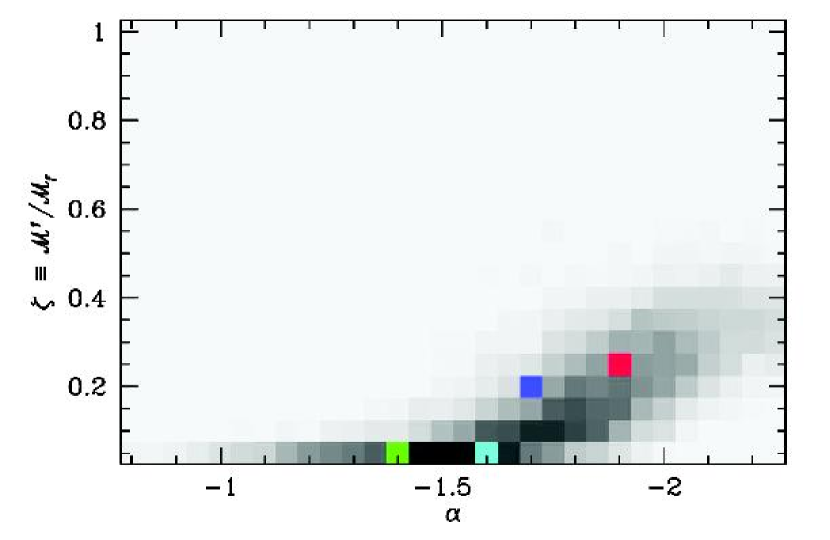
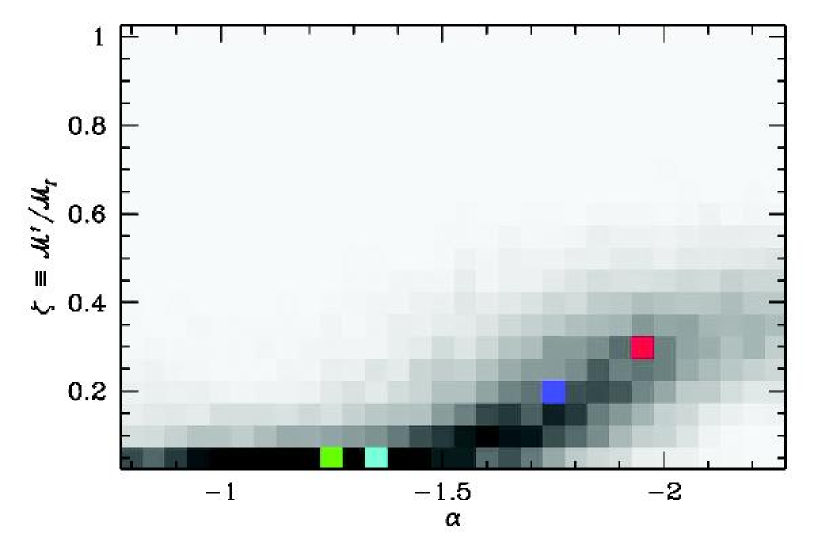
For each simulated GC system, a Kolmogorov-Smirnov (KS) test is performed to test the hypothesis that the simulated and observed metallicity distributions have been drawn from the same parent distribution. Simulations are carried out times at each point in the – plane, giving a grand total of 60,000 simulations over the full grid. At each grid element, the average KS probability is recorded. The resulting probability surface, shown in Figures 13, 15, 17 and 19, gives the likelihood that the observed GC color/metallicity distributions can be reproduced with a protogalactic spectrum characterized by that – pair. The four crosses in each figure mark representative simulations for each galaxy that have a better than probability of being drawn from the same distribution as the observed GC metallicity distribution function. The upper panels of Figures 14, 16, 18 and 20 show comparisons of the observed GC metallicity distribution functions with the results from these four simulations; the lower panels of these figures show the corresponding protogalactic mass spectra.
The key result from these simulations is that the observed GC color/metallicity distributions seem to be perfectly consistent with those expected if cD galaxies form through the accretion of numerous galaxies and protogalactic fragments that managed to form the bulk of the GCs before being integrated into the central galaxy. At the same time, Figures 13–20 reveal that a wide variety of protogalactic mass spectra are able to reproduce the observed metallicity distributions. For comparison, Côté et al. (2002) carried out an analysis of the 28 early-type galaxies of Kundu & Whitmore (2001) using the method described above, finding (mean error) and a rather steep slope of (mean error). While these values are certainly consistent in all four cases with those found here, Figures 13–20 show that, with the possible exception of NGC 4839, shallower slopes are also allowed. Aside from NGC 4839 (which we discuss in detail below), the locus of most probable – pairs for each galaxy tend to form an elongated ridge that stretches from the lower-left corner of the plot ( low and shallow slopes) to the middle-right region ( intermediate and steep slopes). The weaker constraints on and compared to those found by Côté et al. (2002), are a direct consequence of the fact that the GC metallicity distributions for these cD galaxies are dominated by photometric errors. With the current data, we are able to conclude that the GC metallicity distributions are consistent with the cDs being assembled via mergers, accretion and tidal stripping, but we are unable to place firm constraints on the detailed shape of the mass spectra of the cannibalized objects (with the possible exception of NGC 4839; see below). We now turn out attention to the mechanism(s) responsible for these putative mergers.
4.2. Dynamical Friction and the Luminosity Function of Cannibalized Galaxies
Note that above discussion refers implicitly to the initial luminosity function of galaxies, protogalaxies and protogalactic “fragments”. Since our simulations treat mergers in a purely statistical manner, equal merger probabilities are assumed for all galaxies and protogalactic fragments. This assumption is clearly an oversimplification: if mergers proceed through dynamical friction, the merger probability will be a function of mass ( Binney & Tremaine 1987). In this section, we examine how dynamical friction is expected to modify the initial luminosity function. Our aim is compare the luminosity function of cannibalized galaxies predicted by dynamical friction arguments with that obtained in our analysis of the GC metallicity distributions.
At the centers of clusters where cD galaxies reside, the galaxy luminosity function will evolve with time because the rate of dynamical friction is mass (and, hence, luminosity) dependent. If cannibalism as a result of dynamical friction is the primary mechanism by which cD galaxies evolve, then we would expect the luminosity function of cannibalized galaxies to be skewed toward luminous galaxies. Note that, for our purposes, we are not concerned with the rate at which galaxies sink to the cluster center, but merely with the final luminosity distribution of all galaxies cannibalized over the cluster lifetime.
We assume that the initial luminosity function is given by a Schecter function,
and that the joint luminosity and spatial density distribution of galaxies within the cluster, is given by the product of with a spatial distribution , such that . A galaxy orbiting on a circular orbit in an isothermal potential reaches the cluster center after a time (Binney & Tremaine 1987)
Here is the initial distance of the galaxy, is the cluster velocity dispersion, and is the standard Coulomb logarithm. Setting to the age of the cluster, , we can solve for the distance, , within which galaxies of mass will have spiraled to the center. Assuming a constant mass-to-light ratio, , we can also express this distance as a function of ,
For the host clusters of our cD galaxies, varies between 13 and 1300 kpc for galaxy masses in the range 108 to 1012 . The luminosity function of cannibalized galaxies will be given by
The surface density profile of galaxies in the inner regions of clusters goes as (, Beers & Tonry 1986; Merritt & Tremblay 1994; McLaughlin 1999b). For a spherical cluster, this corresponds to a three-dimensional density distribution of , which in turn implies
In other words, the slope of the luminosity function of cannibalized galaxies, , is related that of the initial luminosity function, , through the relation
This expression provides a a crude connection between the expected luminosity function of cannibalized galaxies to that of the surrounding cluster at the time of its formation under the simplifying assumptions made. Note that except in the case of a very steep initial density distribution, regardless of the exact value of .
4.3. Comparing the Luminosity Functions
Is it plausible that these cD galaxies were assembled mainly through dynamical friction? We may examine this possibility by assuming, for the time being, that the protogalactic luminosity functions found in §4.1 are the outcome of cannibalism through dynamical friction, so that and .
For NGC 541, NGC 2832 and NGC 7768, Figures 13-16 and 19-20 show that a rather wide range of protogalactic luminosity functions are capable of reproducing the observed GC metallicity distributions in these galaxies. Depending on the precises values of , slopes in the range are capable of yielding simulated metallicity distributions that are in close agreement with those observed; the constraints on are somewhat tighter in the case of NGC 4839, with . These values of would require the host clusters (, Abell 194, Abell 779 and Abell 2666) to have initial luminosity functions with slopes in the range . For Abell 1656, the corresponding limits are . Are such slopes feasible, or can they be ruled out from observations of the present-day luminosity functions in these clusters?
There is, to the best of our knowledge, no published luminosity function for Abell 779, so we restrict ourselves to Abell 194, Abell 1656 and Abell 2666. Interestingly, there have been recent reports of steep luminosity functions in both Abell 194 and Abell 2666. Trentham (1997) finds in Abell 194, while de Propris et al. (1995) claim for Abell 2666. We caution, however, that in both cases, the measured luminosity functions are uncertain to the point being essentially unconstrained (, Trentham quotes a best-fit value of for Abell 194). Firm conclusions on the viability of dynamical friction as the main mechanism responsible for the formation of these galaxies must await the measurement of improved GC metallicity distributions and, equally important, accurate luminosity functions for their host clusters.
Observational constraints on the luminosity function in Abell 1656 are of much higher quality. Several comprehensive studies of the luminosity function in this cluster which have yielded results that are in good agreement: (Bernstein et al. 1995), (Secker, Harris & Plummer 1997), (Beijersbergen, Schaap & van der Hulst 2002), and (Mobasher et al. 2003). Strictly speaking, these measurements refer to the global luminosity function of the Abell 1656 cluster and not the subcluster that hosts NGC 4839, but Mobasher et al. (2003) find the luminosity function in the NGC 4839 subcluster to be indistinguishable from that of the cluster as a whole. The average of the above values, , falls outside the range of probable values given above (, ). We tentatively conclude that the hypothesis that cD galaxies were assembled mainly through mergers driven by dynamical friction seems inconsistent with the available data for NGC 4839 and Abell 1656, the galaxy/cluster pair in our sample with the highest quality GC metallicity distribution and luminosity function. Recall from §1 that various dynamical evidence suggests that cD galaxies typically grow by only 1-2 as a result of cannibalism through dynamical friction during the post-virialization regime (, Merritt 1985; Lauer 1985; Dubinski 1998). Since NGC 4839 has a luminosity of , this conclusion is in agreement with the expectation from the dynamical evidence that dynamical friction alone can not account for the observed luminosity.
5. Conclusions
We have nearly doubled the number of cD galaxies with available color/metallicity distributions for their GC systems, thus probing the realm of early-type galaxies in their most extreme manifestation of luminosity and size. Despite the undeniably special nature of these galaxies, their GC systems seem remarkably normal in all the properties we have explored: specific frequency, mean metallicity, and the metallicity offset between the GCs and host galaxy stars. An analysis of the protogalactic mass spectra for these galaxies, while more model dependent, similarly reveals no obvious anomalies compared to normal ellipticals.
The GC specific frequencies of these cD galaxies fall within the expected range given the known scaling relations between specific frequency and cluster X-ray temperature and velocity dispersion. Our specific frequencies corroborate previous measurements for three of our galaxies; the measured specific frequency for the remaining object, NGC 541, is consistent with expectations given the mass of Abell 194, the surrounding cluster. Thus, our findings are consistent with a picture in which the efficiency of GC formation scales with the total mass of the cluster itself, implying that the GC formation efficiency per unit total mass (, including dark matter) is universal (Blakeslee et al. 1997; Blakeslee 1999). It would be interesting to measure density profiles for the X-ray emitting gas these clusters, to see if the total numbers of GCs in these galaxies are also consistent with a constant efficiency of GC formation per baryon mass, as suggested by McLaughlin (1999a). In any event, it seems clear that the GC systems belonging to these cD galaxies trace the cluster properties so that, as Blakeslee (1999) notes, it may be more correct to view “high-” galaxies as being underluminous given their total masses, rather than ascribing to them an unusually high GC formation efficiency. Possible explanations for this “missing light” problem include tidal heating of the gas as the galaxy cluster collapses (Blakeslee et al. 1997), and starbust driven galactic winds (Harris, Harris & McLaughlin 1998) which could be responsible for halting star formation in BCGs to an extent that is controlled by the cluster’s mass.
Our results suggest that, whatever mechanism is responsible for the formation of cD galaxies, perhaps making some of them appear underluminous compared to their host clusters in the process, it seems to leave the GCs unscathed. Indeed, the metallicity offset between the CG system and the underlying galaxy is indistinguishable from that observed for other early-type galaxies, and thus presents us with another uniformity which must be tied in a fundamental way to their formation process. A plausible origin for this offset may rely on the timing of GC formation. We find the mean metallicity of the gas out of which GCs formed to be roughly six times lower than that of galaxy itself; if the GCs form before the bulk of the stars, then a metallicity offset seems a natural, if not inevitable, outcome. This admittedly qualitative scenario agrees with the idea that star formation was inhibited for some central galaxies but not their GC systems, as the GCs might have formed prior to the onset of this as-yet-unidentified process.
Different models for the formation of cD galaxies differ mainly on the timescales over which the cD galaxies form. We have examined the possibility that cD galaxies have been assembled through the accretion of numerous galaxies and protogalactic fragments that managed to form their GCs prior to being captured and disrupted by the central galaxy. Our key finding in this regard is that such a process appears to be entirely consistent with the observed GC metallcity distributions for these galaxies. Unfortunately, a wide variety of protogalactic mass spectra are able to reproduce the observed metallicity distributions given the rather rather poorly constrained metallicity distributions.
What mechanism might be responsible for such mergers? In the case of NGC 4839, the cD in the southwest extension of Abell 1656 and the galaxy in our sample having the most reliable GC metallicity distribution, we find the present-day luminosity function of Abell 1656 to be too shallow to be consistent with the assembly of the galaxy from dynamical friction. In other words, while it is possible to choose an ensemble of galaxies, protogalaxies and protogalactic fragments that, once assembled, would produce a GC system with the appropriate metallicity distribution, the required luminosity function of these objects seems overly steep compared to that measured at the present time. This suggests that, in agreement with the previous conclusions based on dynamical arguments (Merritt 1985; Lauer 1985), cannibalism through dynamical friction is not the primary means by which cD galaxies are assembled. The properties of the GC system instead favor a scenario (, Dubinski 1990) in which the cDs form rapidly, and at early-times, via hierarchical merging prior to cluster virialization.
References
- Ashman & Zepf (1992) Ashman, K.M., & Zepf, S.E. 1992, ApJ, 384, 50
- Bahcall & Oh (1996) Bahcall, N.A., & Oh, S.P. 1996, ApJ, 462, L49
- Barmby et al. (2000) Barmby, P., Huchra, J.P., Brodie, J.P., Forbes, D.A., Schroder, L.L., & Grillmair, C.J. 2000, AJ, 119, 727
- Beasley et al. (2000) Beasley, M.A., Sharples, R.M., Bridges, T.J., Hanes, D.A., Zepf, S.E., Ashman, K.M., & Geisler, D. 2000, MNRAS, 318, 1249
- Benstein et al. (1995) Bernstein, G.M., Nichol, R.C., Tyson, J.A., Ulmer, M.P., & Wittman, D. 1996, AJ, 110, 1507
- Bertin & Arnouts (1996) Bertin, E. & Arnouts, S. 1996, A&AS, 117, 393
- Beers, Flynn & Gebhardt (1990) Beers, T.C., Flynn, K., & Gebhardt, K. 1990, AJ, 100, 32
- Beijersbergen, Schaap & van der Hulst (2002) Beijersbergen, M., Schaap, W.E., & van der Hulst, J.M. 2002, A&A, 390, 817
- Bird and Beers (1993) Bird, C.M., & Beers, T.C. 1993, AJ, 105, 1596
- Blakeslee (1999) Blakeslee, J.P. 1999, AJ, 118, 1506
- Blakeslee & Tonry (1992) Blakeslee, J.P., & Tonry, J.L. 1992, AJ, 103, 1457
- Blakeslee, Tonry & Metzger (1997) Blakeslee, J.P., Tonry, J.L., & Metzger, M.R. 1997, AJ, 114, 482
- Bode et al (1994) Bode, P.W., Berrington, R.C., Cohn, H.C., & Lugger, P.M. 1994, ApJ, 433,479
- Bonatto, Bica & Alloin (1995) Bonatto, C., Bica, E., & Alloin, D. 1995. A&AS, 112, 71
- Bridges et al. (1996) Bridges, T. J., Carter, D., Harris, W. E., & Pritchet, C. J. 1996, MNRAS, 281, 1290
- Cardelli, Clayton & Mathis (1989) Cardelli, J.A., Clayton, G.C., & Mathis, J.S. 1989, ApJ, 345, 245
- Cohen, Blakeslee & Côté (2003) Cohen, J.G., Blakeslee, J.P., & Côté, P. 2003, ApJ, in press
- Colless & Dunn (1996) Colless, Matthew, D., & Andrew, M. 1996, ApJ, 458, 435
- Côté, Marzke & West (1998) Côté, P., Marzke, R.O., & West, M.J. 1998, ApJ, 501, 554
- Côté et al. (2000) Côté, P., Marzke, R.O., West, M.J., & Minniti, D. 2000, ApJ, 533, 869
- Côté, West & Marzke (2002) Côté, P., West, M.J., & Marzke, R.O. 2002, ApJ, 567, 853
- de Juan, Colina, & Pérez-Fournon (1994) de Juan, L., Colina, L., & Pérez-Fournon, I. 1994, ApJS, 91, 507
- de Propris et al. (1995) de Propris, R., Pritchet, C.J., Harris, W.E., & McClure, R.D. 1995, ApJ, 450, 534
- de Vaucouleurs & Nieto (1978) de Vaucouleurs, G., & Nieto, J.-L. 1978, ApJ, 220, 449
- de Vaucouleurs et al. (1995) de Vaucouleurs, G., de Vaucouleurs, A., Corwin, H.G., Buta, R.J., Paturel, G., & Fouque, P. 1995, Third Reference Catalogue of Bright Galaxies (RC3), (Austin: University of Texas Press).
- Dolphin (2000) Dolphin, A.E. 2000, PASP, 112, 1397
- Dressler (1980) Dressler, A. 1980, ApJS, 42, 565
- Dubinski (1998) Dubinski, J. 1998, ApJ, 502, 141
- Fabian (1994) Fabian, A.C. 1994, ARA&A, 32, 277
- Finch (1977) Finch, S.J. 1977, J. Amer. Stat. Assoc., 72, 387
- Fleming et al. (1995) Fleming, D.E.B., Harris, W.E., Pritchet, C.J., & Hanes, D.A. 1995, AJ, 109, 1044
- Freedman et al. (2001) Freedman, W.L., et al. 2001, ApJ, 553, 47
- Forbes et al. (1998) Forbes, D.A., Grillmair, C.J., Williger, G.M., & Elson, R.A.W., & Brodie, J.P. 1998, MNRAS, 293, 325
- Fukuguta et al. (1995) Fukugita, M., Shimasaku, K., & Ichikawa, T. 1995, PASP, 107, 945
- Funato, Makino & Ebisuzaki (1993) Funato, Y., Makino, J., & Ebisuzaki, T. 1993, PASJ, 45, 289
- Garijo, Athanassoula & García-Gómez (1997) Garijo, A., Athanassoula, E., & García-Gómez, C. 1997, A&A, 327, 930
- Hanes & Whittaker (1987) Hanes, D.A., & Whittaker, D.G. 1987, AJ, 94, 906
- Harris & van den Bergh (1981) Harris, W.E., & van den Bergh, S. 1981, AJ, 86, 1627
- Harris, Harris, & McLaughlin (1998) Harris, W.E., Harris, G.L.H., & McLaughlin, D.E. 1998, AJ, 115, 1801
- Harris (1988) Harris, W.E. 1988, in The Harlow-Shapley Symposium on Globular Cluster Systems in Galaxies, ed. J. E. Grindlay & A. G. D. Philip (Dordrecht: Reidel), 237
- Harris (2001) Harris, W.E. 2001, in Star Clusters, Saas-Fee Advanced School 28, ed. L. Labhardt & B. Binggeli (Berlin:Springer), 223
- Harris, Pritchet & McClure (1995) Harris, W.E., Pritchet, C.J., & McClure, R.D. 1995, ApJ, 441, 120
- Hartigan & Hartigan (1985) Hartigan, J.A., & Hartigan, P.M. 1985, Ann. Statist., 13, 70
- Hausman & Ostriker (1978) Hausman, M.A., & Ostriker, J.P. 1978, ApJ, 224, 320
- Hoaglin et al. (1983) Hoaglin, D.C., Mosteller, F., & Tukey, J.W. 1983, Understanding Robust and Exploratory Data Analysis (New York: Wiley)
- Hoessel & Schneider (1985) Hoessel, J.G., & Schneider, D.P. 1985, AJ, 90, 1648
- Holtzman et al. (1995) Holtzman, J.A., Burrows, C.J., Casertano, S., Hester. J.J., Trauger, J.T., Watson, A.M., & Worthey, G. 1995, PASP, 107, 1065
- Jedrzejewski (1987) Jedrzejewski, R.I. 1987, MNRAS, 226,747
- Jordán et al. (2002) Jordán, A., Côté, P., West, M.J., & Marzke, R.O. 2002, ApJ, 576, L113
- Jørgensen, Franx & Kjærgaard (1992) Jørgensen, I., Franx, M. & Kjærgaard, P. 1992, A&AS, 95, 489
- Kaastra et al. (2001) Kaastra, J.S., Ferrigno, C., Tamura, T., Paerels, F.B.S., Peterson, J.R., & Mittaz, J.P.D. 2001, A&A, 365, L99
- Kim et al. (2002) Kim et al. 2002, in Tracing Cosmic Evolution with Galaxy Clusters, ed. S. Borgani, M. Mezzetti, & R. Valdarnini (San Francisco: ASP), 395
- Kinney et al. (1996) Kinney, A.L., Calzetti, D., Bohlin, R.C., McQuade, K., Storchi-Bergmann, T., & Scmitt, H.R. 1996, ApJ, 467, 38
- Kundu & Whitmore (2001) Kundu, A., & Whitmore, B.C. 2001, AJ, 122, 1251
- Lambas, Groth & Peebles (1988) Lambas, D.G., Groth, E.J., & Peebles, P.J.E. 1988, AJ, 95, 996
- Larsen et al. (2001) Larsen, S.S., Brodie, J.P., Huchra, J.P., Forbes, D.A., & Grillmair, C.J. 2001, AJ, 121, 2974
- Lauer (1985) Lauer, T.R. 1985, ApJ, 292, 104
- Lauer (1988) Lauer, T.R. 1988, ApJ, 325, 49
- Leir & van den Bergh (1977) Leir, A.A., & van den Bergh, S. 1977, ApJS, 34, 381
- Malumuth & Kirshner (1985) Malumuth, E.M., & Kirshner, R.P. 1985, ApJ, 291, 8
- Maraston (1998) Maraston, C. 1998, MNRAS, 300, 872
- Marín-Franch & Aparicio (2002) Marín-Franch, A. & Aparicio, A. 2002, ApJ, 568, 174
- (63) McLaughlin, D.E. 1999, AJ, 117, 2398
- (64) McLaughlin, D.E. 1999, ApJ, 512, L9
- McLaughlin, Harris & Hanes (1994) McLaughlin, D.E., Harris, W.E., & Hanes, D.A. 1994, ApJ, 422, 486
- Merrifield & Kent (1991) Merrifield, M.R., & Kent, S.M. 1991, AJ, 101, 783
- Merritt (1984) Merritt, D. 1984, ApJ, 276, 26
- Merritt (1985) Merritt, D. 1985, ApJ, 289, 18
- Merritt & Tremblay (1994) Merritt, D., & Tremblay, B. 1994, AJ, 108, 514
- Mobasher et al. (2003) Mobasher, B., Colless, M., Carter, D., Poggianti, B.M., Bridges, T.J., Kranz, K., Komiyama, Y., Kashikawa, N., Yagi, M., & Okamura, S. 2003, ApJ, 587, 605
- Neumann et al. (2003) Neumann, D.M., Arnaud, M., Gastaud, R., Aghanim, N., Lumb, D., Briel, U.G., Vestrand, W.T., Stewart, G.C., Molendi, S., Mittaz, J.P.D. 2003, A&A, 365, 74
- Oemler (1976) Oemler, A. 1976, ApJ, 209, 693
- Ostriker & Tremaine (1975) Ostriker, J.P., & Tremaine, S.D. 1975, ApJ, 202, L113
- Peletier et al. (1990) Peletier, R. F., Davies, R. L., Illingworth, G. D., Davis, L. E., & Cawson, M. 1990, AJ, 100, 1091
- Peterson et al. (2001) Peterson, J.R., Paerels, F.B.S., Kaastra, J.S., Arnaud, M., Reiprich, T.H., Fabian, A.C., Mushotzky, R.F., Jernigan, J.G., & Sakelliou, I. 2001, A&A, 365, L104
- Plionis (1994) Plionis, M. 1994 ApJS, 95, 401
- Poggianti (1987) Poggianti, B.M. 1997, A&AS, 122, 399
- Porter (1989) Porter, A.C. 1989 PASP, 101, 134
- Porter, Schneider & Hoessel (1991) Porter, A.C., Schneider, D.P., & Hoessel J.G. 1991, AJ, 101, 1561
- Rhee, van Haarlem & Katgert (1991) Rhee, G. F. R. N., van Haarlem, M. P., & Katgert, P. 1991, A&AS, 91, 513
- Richstone (1976) Richstone, D.O. 1976, ApJ, 204, 642
- Richstone & Malumuth (1983) Richstone, D.O., & Malumuth, E.M. 1983, ApJ, 268, 30
- Sandage & Hardy (1973) Sandage,A., & Hardy, E. 1973, ApJ, 183, 743
- Schlegel, Finkbeiner & Davis (1998) Schlegel, D.J., Finkbeiner, D.P., & Davis, M. 1998, ApJ, 500, 525
- Schechter (1976) Schechter, P.L. 1976, ApJ, 203, 297
- Schombert (1986) Schombert, J.M. 1986, ApJS, 60, 603
- Schombert (1988) Schombert, J.M. 1988, ApJ, 328, 475
- Schweizer (1987) Schweizer, F. 1987, in Nearly Normal Galaxies, ed. S. Faber (New York: Springer), 18
- Secker (1995) Secker, J. 1995, PASP, 107, 496
- Secker & Harris (1993) Secker, J., & Harris W.E. 1993, AJ, 105, 1358
- Secker, Harris & Plummer (1997) Secker, J., Harris W.E., Plummer, J.D. 1997, PASP, 109, 1377
- Shetrone, Côté & Sargent (2001) Shetrone, M.D., Côté, P., & Sargent, W.L.W. 2001, ApJ, 548, 592
- Silverman (1986) Silverman, B.W. 1986, Density Estimation for Statistics and Data Analysis (New York: Chapman & Hall)
- spergel et al. (2003) Spergel, D. N., Verde, L., Peiris, H. V., Komatsu, E., Nolta, M. R., Bennett, C. L., Halpern, M., Hinshaw, G., Jarosik, N., Kogut, A., Limon, M., Meyer, S. S., Page, L., Tucker, G. S., Weiland, J. L., Wollack, E. & Wright, E. L. 2003, ApJS, 148, 175
- Stetson (1987) Stetson, P.B. 1987, PASP, 99, 191
- Stetson (1993) Stetson, P.B. 1993, in IAU Colloq. 136, Stellar Photometry: Current Techniques and Future Developments, ed. C. J. Butler & I. Elliot (Cambridge: Cambridge Univ. Press), 291
- Stetson & Harris (1988) Stetson, P.B., & Harris, W.E. 1988, AJ, 96, 909
- Tamura et al. (2001) Tamura, T., Kaastra, J.S., Peterson, J.R., Paerels, F.B.S., Mittaz, J.P.D., Trudolyubov, S.P., Stewart, G., Fabian, A.C, Mushotzky, R.F., Lumb, D.H., & Ikebe, Y. 2001, A&A, 365, L87
- Tolstoy et al. (2003) Tolstoy, E., Venn, K.A., Shetrone, M.D., Primas, F., Hill, V., Kaufer, A., & Szeifert, T. 2003, AJ, 125, 707
- Trager et al. (2000) Trager, S.C., Faber, S.M., Worthey, G., & González, J.J. 2000, AJ, 119, 1645
- Tran et al. (2001) Tran, H.D., Tsvetanov, Z., Ford, H.C., Davies, J., Jaffe, W., van den Bosch, F.C., & Rest, A. 2001, AJ, 121, 2928
- Trentham, N. (1997) Trentham, N. 1997, MNRAS, 286, 133
- van den Bergh (1992) van den Bergh, S. 1992, AJ, 110, 2700
- van den Bergh (2001) van den Bergh, S. 2001, PASP, 113, 154
- West (1994) West, M.J. 1994, MNRAS, 268, 755
- White (1976) White, S.D.M. 1976, MNRAS, 174, 19
- Whitmore et al. (1995) Whitmore, B.C., Sparks, W.B., Lucas, R.A., Macchetto, F.D., & Biretta, J.A. 1995, ApJ, 454, L73
- Wu, Xue & Fang (1999) Wu, X.-P., Xue, Y.-J., & Fang, L.-Z. 1999, ApJ, 524, 22
- Zabludoff, Geller & Huchra (1990) Zabludoff, A., Geller, M.J., & Huchra, J.P. 1990, ApJS, 74, 1


| Galaxy | R.A. | Decl. | Filter | Exposure Time |
|---|---|---|---|---|
| (J2000) | (J2000) | (s) | ||
| NGC 541 | 01:25:44.3 | –01:22:46 | F450W | 21200 |
| 11000 | ||||
| F814W | 2 600 | |||
| NGC 2832 | 09:19:46.9 | +33:44:59 | F450W | 41300 |
| F814W | 21300 | |||
| NGC 4839 | 12:57:24.2 | +27:29:54 | F450W | 61300 |
| F814W | 21300 | |||
| NGC 7768 | 23:50:58.6 | +27:08:51 | F450W | 61300 |
| 11200 | ||||
| F814W | 21300 | |||
| 11200 |
| Galaxy | Cluster | aa and from Zabludoff, Geller & Huchra (1990), except for NGC 4839 (Colless & Dunn 1996). | aa and from Zabludoff, Geller & Huchra (1990), except for NGC 4839 (Colless & Dunn 1996). | bb X-ray temperatures and luminosities for NGC 541 from Wu, Xue & Fang (1999). The X-ray temperature of NGC 4839 is taken from Neumann et al. (2003). | bb X-ray temperatures and luminosities for NGC 541 from Wu, Xue & Fang (1999). The X-ray temperature of NGC 4839 is taken from Neumann et al. (2003). | Richness Classcc Richness and Bautz-Morgan classifications from Leir & van den Bergh (1977). | BM Classcc Richness and Bautz-Morgan classifications from Leir & van den Bergh (1977). |
|---|---|---|---|---|---|---|---|
| (km s-1) | (km s-1) | (keV) | (1044 erg s-1) | ||||
| N541 | A194 | 538861 | 480 | 2.63 | 0.220.04 | 0 | II |
| N2832 | A779 | 6887110 | 503 | 0.280.07 | 0 | I-II | |
| N4839 | A1656 | 7339 | 329 | 4.5 | |||
| N7768 | A2666 | 8086105 | 476 | 0.05 | 0 | I |
| aaSemi-major axis distance | PA | ||||
|---|---|---|---|---|---|
| (arcsec) | (mag arcsec-2) | (mag arcsec-2) | (deg) | ||
| NGC 541 | |||||
| 0.16 | 15.507 | 17.998 | 0.07 | 120.6 | -0.007 |
| 0.28 | 15.772 | 18.292 | 0.10 | 128.6 | -0.004 |
| 0.42 | 16.012 | 18.442 | 0.07 | 166.3 | 0.018 |
| 0.58 | 16.175 | 18.546 | 0.01 | 29.1 | -0.008 |
| 0.76 | 16.251 | 18.682 | 0.03 | 72.8 | -0.005 |
Note. — The complete version of this table is in the electronic edition of the Journal. The printed edition contains only a sample.
| ID | |||||
|---|---|---|---|---|---|
| (arcsec) | (arcsec) | (arcsec) | (mag) | (mag) | |
| 1 | 4.047 | -4.012 | -0.540 | 24.200 | 2.005 |
| 2 | 4.523 | 0.087 | 4.522 | 25.102 | 1.711 |
| 3 | 5.292 | -5.029 | -1.650 | 24.545 | 1.675 |
| 4 | 5.489 | -5.332 | -1.308 | 25.594 | 1.956 |
| 5 | 5.510 | -5.369 | 1.243 | 25.321 | 1.861 |
Note. — The complete version of this table is in the electronic edition of the Journal. The printed edition contains only a sample.
| ID | |||||
|---|---|---|---|---|---|
| (arcsec) | (arcsec) | (arcsec) | (mag) | (mag) | |
| 1 | 3.756 | -1.916 | 3.402 | 25.260 | 2.113 |
| 2 | 4.117 | 2.033 | -3.753 | 25.842 | 2.273 |
| 3 | 4.865 | 4.644 | -2.960 | 24.936 | 1.813 |
| 4 | 4.941 | -2.327 | -4.546 | 25.486 | 1.653 |
| 5 | 5.286 | 1.442 | 5.149 | 24.968 | 2.113 |
Note. — The complete version of this table is in the electronic edition of the Journal. The printed edition contains only a sample.
| ID | |||||
|---|---|---|---|---|---|
| (arcsec) | (arcsec) | (arcsec) | (mag) | (mag) | |
| 1 | 3.969 | 3.928 | 1.900 | 25.460 | 2.194 |
| 2 | 5.818 | -0.369 | -5.809 | 25.387 | 1.565 |
| 3 | 6.070 | 6.118 | 2.718 | 26.194 | 1.883 |
| 4 | 6.182 | 5.539 | 3.752 | 25.980 | 2.121 |
| 5 | 6.277 | -6.548 | 2.381 | 25.137 | 1.402 |
Note. — The complete version of this table is in the electronic edition of the Journal. The printed edition contains only a sample.
| ID | |||||
|---|---|---|---|---|---|
| (arcsec) | (arcsec) | (arcsec) | (mag) | (mag) | |
| 1 | 3.593 | -2.871 | 2.526 | 25.824 | 1.670 |
| 2 | 4.855 | 1.898 | -4.552 | 26.172 | 2.120 |
| 3 | 5.717 | 5.231 | 3.319 | 26.242 | 2.038 |
| 4 | 8.337 | 9.357 | -0.428 | 25.635 | 1.853 |
| 5 | 10.016 | 1.635 | 9.910 | 26.362 | 1.361 |
Note. — The complete version of this table is in the electronic edition of the Journal. The printed edition contains only a sample.
| Template | [Fe/H] | ||||
|---|---|---|---|---|---|
| (dex) | (km s-1) | (mag) | (mag) | ||
| Elliptical | 0 | 5422 6 | |||
| 6948 6 | |||||
| 736212 | |||||
| 819216 | |||||
| G2 | 5422 6 | ||||
| 6948 6 | |||||
| 736212 | |||||
| 819216 | |||||
| G3 | 5422 6 | ||||
| 6948 6 | |||||
| 736212 | |||||
| 819216 | |||||
| G4 | 5422 6 | ||||
| 6948 6 | |||||
| 736212 | |||||
| 819216 | |||||
| G5 | 5422 6 | ||||
| 6948 6 | |||||
| 736212 | |||||
| 819216 |
| Galaxy | ||
|---|---|---|
| (mag) | ||
| NGC 541 | ||
| NGC 2832 | ||
| NGC 4839 | ||
| NGC 7768 |
| Galaxy | aa = biweight location estimator (Beers, Flynn & Gebhardt 1990). | bb = biweight scale estimator (Beers, Flynn & Gebhardt 1990). | cc = assymetry index (Finch 1977). | dd = tail index (Hoaglin, Mosteller & Tukey 1983). |
|---|---|---|---|---|
| (mag) | (mag) | |||
| NGC 541 | ||||
| NGC 2832 | ||||
| NGC 4839 | ||||
| NGC 7768 |
| Galaxy | /aaFor (Mobasher et al. 2003), km s-1 Mpc-1 (Freedman et al. (2001), and Fukugita, Shimasaku & Ichikawa (1995). | |||||||
|---|---|---|---|---|---|---|---|---|
| (mag) | (mag) | (mag) | (mag) | (km s-1) | (mag) | |||
| NGC 541 | 0.080 | 2.14 | 1.81 | 12.080.15 | 5422 6 | 22.440.28 | 3.9 | |
| NGC 2832 | 0.039 | 2.15 | 1.79 | 11.870.13 | 6948 6 | 23.100.26 | 7.2 | |
| NGC 4839 | 0.023 | 2.17 | 1.71 | 12.060.10 | 736212 | 23.020.25 | 6.7 | |
| NGC 7768 | 0.087 | 2.22 | 1.72 | 12.300.13 | 819116 | 23.100.26 | 7.2 |
| Galaxy | |||
|---|---|---|---|
| (mag) | |||
| NGC 541 | 1620450 | ||
| NGC 2832 | 3200920 | ||
| NGC 4839 | 3060850 | ||
| NGC 7768 | 1850570 |