Imaging X-ray, Optical, and Infrared Observations of the Transient Anomalous X-ray Pulsar XTE J1810–197
Abstract
We report X-ray imaging, timing, and spectral studies of XTE J1810197, a 5.54 s pulsar discovered by Ibrahim et al. (2003) in recent RXTE observations. In a set of short exposures with the High Resolution Camera on-board the Chandra X-ray Observatory we detect a strongly modulated signal ( pulsed fraction) with the expected period located at (J2000) , , with a uncertainty radius of (90% confidence level). Spectra obtained with the Newton X-Ray Multi-Mirror Mission (XMM-Newton) are well fitted by a two-component model that typically describes anomalous X-ray pulsars (AXPs), an absorbed blackbody plus power law with parameters keV, , , and ergs cm-2 s-1. Alternatively, a two-temperature blackbody fit is just as acceptable. The location of CXOU J180951.0194351 is consistent with a point source seen in archival Einstein, ROSAT, and ASCA images, when its flux was nearly two orders-of-magnitude fainter, and from which no pulsations are found. The spectrum changed dramatically between the “quiescent” and “active” states, the former can be modeled as a softer blackbody. Using XMM-Newton timing data, we place an upper limit of 0.03 lt-s on any orbital motion in the period range 10 min – 8 hr. Optical and infrared images obtained on the SMARTS 1.3 m telescope at CTIO show no object in the Chandra error circle to limits , and . Together, these results argue that CXOU J180951.0194351 is an isolated neutron star, one most similar to the transient AXP AX J1844.80256. Continuing study of XTE J1810197 in various states of luminosity is important for understanding and possibly unifying a growing class of isolated, young neutron stars that are not powered by rotation.
1 Introduction
X-ray observations over the past two decades have discovered young, isolated neutron stars (NSs) with spectral and timing properties markedly different from those of the typical rotation-powered (or accretion-powered) pulsar. These objects, which tend to be labeled by their most distinctive characteristic, include the anomalous X-ray pulsars (AXPs) with slow ( s) rotation periods and X-ray emission far in excess of their rotational energy-loss rate, the Soft Gamma-ray Repeaters (SGRs), sources of random episodes of short ( s) bursts of hard X-rays which are otherwise similar to the AXPs, and several examples of so-called Central Compact Objects (CCOs) within supernova remnants (SNRs) that lack detectable periodicity but have spectra resembling those of the AXPs and SGRs [e.g., the X-ray point source in the center of Cas A; Chakrabarty et al. (2001); Mereghetti et al. (2002)]. Collectively, this population of uniquely X-ray discovered objects likely account for a significant fraction of young neutron stars (Gotthelf & Vasisht 2000).
These Galactic plane residents have in common a notably soft X-ray spectrum, a lack of radio or optical counterpart, and luminosities distinct from most rotation-powered pulsars. These properties, along with a lack of detected orbital motion, no red noise in their light curves, and a large X-ray to infrared flux ratio, also argue against an accretion-driven origin. Instead, these objects are understood in terms of the magnetar model for the SGRs, in which the X-ray emission is derived from magnetic energy loss in an strongly magnetized ( G) isolated neutron star (Duncan & Thompson 1992). Most mysterious then was the discovery of a transient AXP (TAXP), AX J1844.80256 (Gotthelf & Vasisht 1998; Torii et al. 1998). This 7-s pulsar was seen just once in archival ASCA data, and has since faded in flux by at least an order of magnitude. It was not detected in earlier data sets or post facto in an ongoing monitoring campaign. But otherwise, AX J1844.80256 has spectral and timing properties that are most consistent with an AXP.
The newly discovered X-ray pulsar XTE J1810197 (Ibrahim et al. 2003) is likely a second example of a TAXP. Archival RXTE data show that XTE J1810197 became active in 2003 January; as of 2003 August its flux has faded by half (Markwardt et al. 2003a,b). Long-term timing of XTE J1810197 with RXTE suggests an AXP based on the period derivative and lack of detected orbital motion (Ibrahim et al. 2003).
In this paper, we report results of X-ray, optical, and infrared observations of XTE J1810197 that enabled us to locate the pulsar with arcsecond precision, measure its X-ray spectrum, and search for an optical or infrared counterpart. These prompt follow-up observations comprise a unique program to study the evolution of a transient AXP while it is bright and active as a pulsar. Based on these observations, we propose that TAXPs, AXPs, SGRs, and CCOs are inherently a single class of young objects observed in various stages of activity but whose emission physics is distinct from rotation-powered pulsars.
2 Chandra Observations and Results
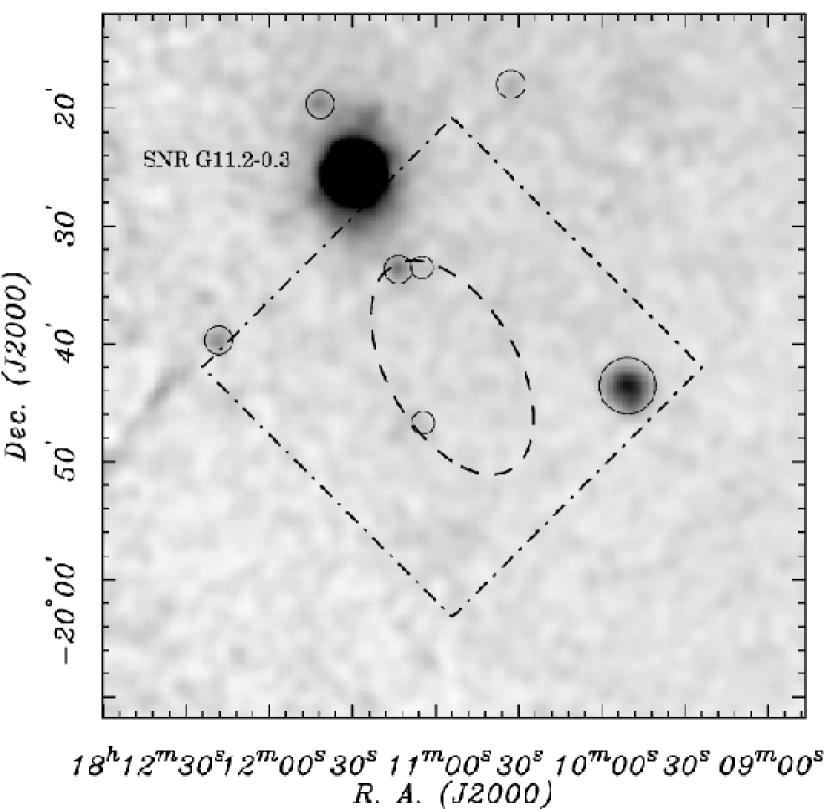
Based on the report of a new pulsar by Markwardt, Ibrahim, & Swank (2003a), we submitted a Target of Opportunity request to the Chandra X-ray Observatory (Weisskopf, O’Dell, & van Speybroeck 1996) to localize XTE J1810197 while the source of the pulsations was still active. The observation was carried out on 2003 August 27 using the Chandra imaging High Resolution Camera (HRC-I; Murray et al. 1997), a multichannel plate detector sensitive to X-rays over the keV range and with a timing precision of ms, depending on detector count rate, more than sufficient to resolve the 5.54 s pulsations. No energy information is recorded for photons detected with the HRC. The observation was centered on the reported diameter RXTE 99.73% confidence error ellipse, with the roll angle adjusted to avoid bright diffuse emission from the nearby supernova remnant G11.2–0.3 and its central pulsar (see Figure 1).
The HRC data collected during the observation shows long periods of high background activity, most likely of solar wind origin, with a mean background rate over the detector of counts s-1. Although telemetry saturation occurred during 65% of the observation, this does not create any additional errors in the detected event times (M. Juda, personal communication). The standard Level 2 HRC processing produced a total good exposure time for the observations of 2.8 ks.
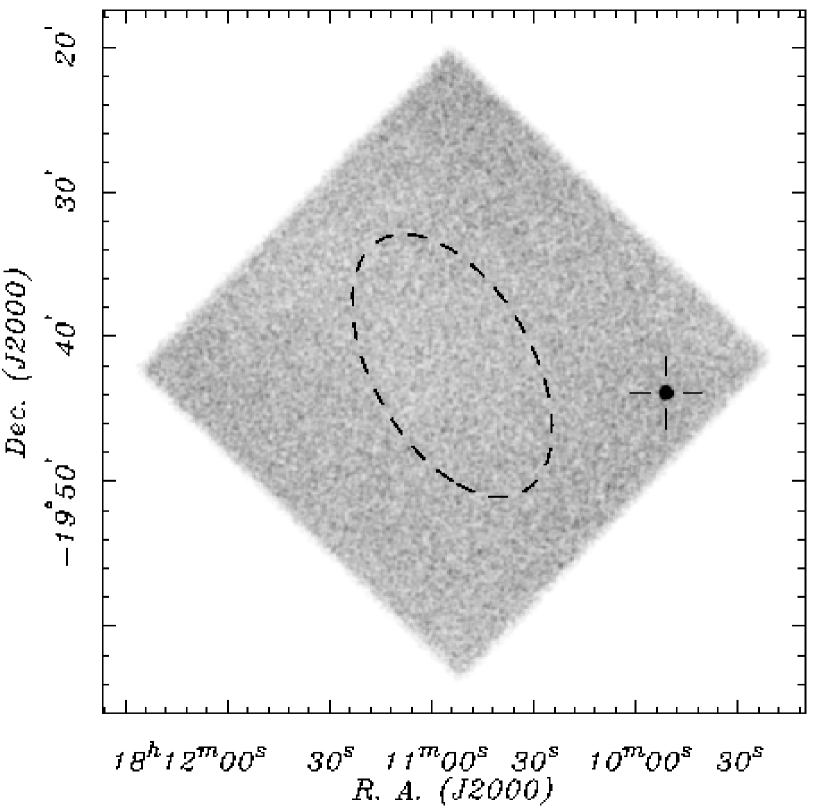
Figure 2 displays the HRC-I image rebinned into pixels and smoothed with a Gaussian of . Only one bright source is apparent, off-axis, with a background-subtracted count rate of s-1 after correcting for telemetry saturation. The radial profile of this source is consistent with an unresolved point source at the off-axis HRC-I position, where the HRC point-spread function (PSF) has a half-power diameter (the radius enclosing of total source counts) of at keV, increasing with energy.
The centroid of this source, based on the standard processing, is (J2000) , with an uncertainty radius of . The positional uncertainty is dominated by the systematic distortion of the PSF at the off-axis position (: e.g., Flaccomio et al. 2003), but it also includes random error associated with the aspect reconstruction (; 90% confidence level) and formal measurement error () based on the number of source photons and the standard deviation of the PSF. No other X-ray source is visible in the image, in particular, at the positions of ROSAT sources 1–3 shown in Figure 1, and thus no sufficiently bright fiducial X-ray source is available in the HRC-I field of view to refine the astrometry. We report the sole HRC source as CXOU J180951.0194351 and a search of the high-energy archives shows that its coordinates are consistent with the ROSAT all-sky survey source 1RXS 180951.5–194345 (Voges et al. 1999) and the ASCA source AX J180951–1943 (Bamba et al. 2003). These coordinates are also consistent with the location of an uncatalogued Einstein IPC source, off-axis in a 1980 March 31 observation of SNR G11.2–0.3 (Harris et al. 1990). A complete X-ray observation log is presented in Table 1.
We examined the light curve of CXOU J180951.0194351 for a pulsed signal that might identify it as XTE J1810197. A total of 2605 photons were extracted from a radius aperture centered on this bright source; the arrival times of the photons were corrected to the solar system barycenter in Barycentric Dynamical Time (TDB) using the JPL DE200 ephemeris (Standish et al. 1992). The extracted photons included 252 background events, estimated from counts in a surrounding annulus. We first performed a Fast Fourier Transform (FFT) on the extracted photons and found a single, highly significant signal at 5.54s. No evidence was found in the FFT of red noise typical of an X-ray binary system. We then generated a periodogram using the statistic (Rayleigh test) on a range of test frequencies centered on the FFT detected signal. We find a highly modulated sinusoidal pulse with a period s (95% confidence) with a background-subtracted pulsed fraction () of (see Figure 3). The Rayleigh statistic for this signal is , a certain detection. Table 2 summaries the timing results presented herein, which confirms the identification of CXOU J180951.0194351 as XTE J1810197 (Gotthelf et al. 2003).
A second, on-axis, Chandra HRC observation centered on the pulsar location presented above was performed on 2003 November 1 (Israel et al. 2004, in preparation). The pulse profile, pulsed fraction, and coordinates derived from this observation are consistent with the previous HRC and XMM measurements. The on-axis location of the short exposure ensures a background free detection of the pulsar with a measured pulsed fraction of . The updated coordinates for the unresolved () point source are (J2000) , , with a reduced position uncertainty radius of (90% confidence level) assuming the standard Chandra on-axis uncertainty and negligible measurement error. These values are consistent with those reported by Israel et al. (2003).
3 XMM-Newton Observation and Results
Having located the X-ray source associated with the pulsations of XTE J1810197, a Target of Opportunity observation was performed with the XMM-Newton X-ray Observatory (Jansen et al. 2001) to determine the spectral properties of the source in the active state. This observation was carried out on 2003 September 8. Here we concentrate on data obtained with the European Photon Imaging Camera (EPIC, Turner et al. 2001). EPIC consists of three CCD cameras, the EPIC-pn and the two EPIC-MOS imagers. One of the EPIC-MOS cameras was operated in FullFrameMode mode, which is read out in 2.7 s integrations over the diameter field-of-view. Data from the second EPIC-MOS camera data was obtained in SmallWindowMode for which the FOV of the central CCD was reduced to but read out with a shortened integration time of 0.3 s. The EPIC-pn was operated in SmallWindowMode mode, which provides 6 ms time resolution over a limited field-of-view of square. The EPIC instruments are sensitive to X-rays in keV nominal range.
The initial observation of XTE J1810197 was lost due to a hardware malfunction and the target was re-observed in two segments with a short interruption in between. We processed the Observation Data Files (ODF) in-house using the standard XMM-Newton Science Analysis System (SAS) processing chains for each instrument (release version 20020605_1701-5.3.3), and the photon event list was further filtered using the standard SAS criteria. We selected only CCD PATTERN data for our EPIC-pn spectral analysis. A total of ks of good exposure time was acquired on the target with only minor background contamination that was not significant enough to warrant filtering out.
We find one bright source in the combined EPIC FOV whose coordinates, based on the standard processing lies from CXOU J180951.0194351 (see Table 1), well within the quoted (90% confidence level) uncertainty radius for XMM. The measured pulse period from the combined EPIC-pn and MOS1 data is s (Table 2). The error is the 95% confidence level determined from the test. Pulse profiles from the EPIC-pn and MOS1 instruments individually are shown in Figure 4. The pulse peak is somewhat narrower than a sinusoid, and the pulsed fractions increase smoothly with energy from 36% at less than 1 keV to above 5 keV. Based on the errors in the period measurements, it is not quite possible to phase connect the Chandra and XMM-Newton observations taken 12 days apart and thereby improve the period accuracy; the extrapolated phase is uncertain by 0.6 cycles.
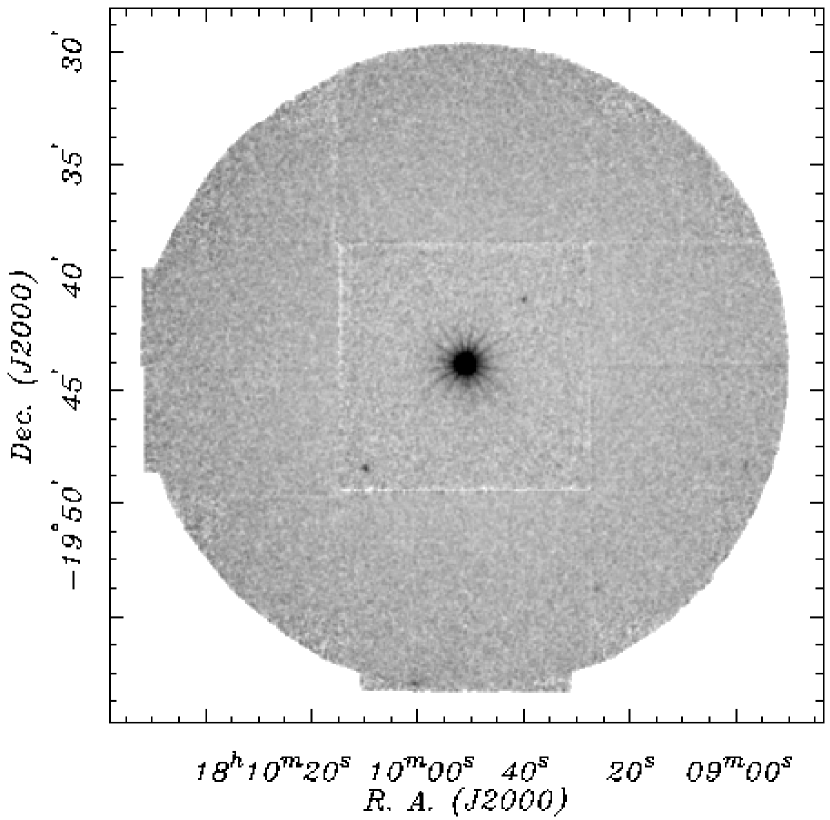
To search for a faint supernova remnant surrounding the pulsar, we made a more restrictive filtering of the data to maximize the sensitivity to diffuse emission. No enhancement of the diffuse flux is found around the EPIC PSF, however we cannot rule out a small nebula obscured by the pulsar emission (see Figure 5).The Chandra HRC observation was too short to image a faint SNR.
We fit the pulsar’s spectrum using data from the EPIC-pn CCD. The fast read out of this instrument ensures that its spectrum is not affected by photon pile-up. A photon source spectrum was accumulated from a 15 diameter aperture which enclosed of the PSF. This spectrum was grouped into bins containing a minimum of 400 counts and fitted using the xspec package. The spectrum cannot be fitted with any single component, but it is well fitted by a two-component spectral model consisting of a blackbody plus a power law, which is typical of AXPs (e.g., Marsden & White 2001). Figure 6 shows the spectrum fitted with temperature keV and photon index of , with a fit statistic of for 193 degrees of freedom (DoF). The column density for this fit is resulting in a keV absorbed flux of ergs cm-2 s-1 , and an intrinsic (unabsorbed) flux of ergs cm-2 s-1 (spectral fits are summarized in Table 3).
We also found that a fit to a two-component blackbody plus blackbody model was equally acceptable but required a lower column density of . In this fit the power-law component of the previous model is replaced with a cooler blackbody with keV while the hotter component remained nearly unchanged with a temperature of keV. The flux for each of these components is given in Table 3.
A preliminary analysis of the Reflecting Grating Spectrometer (RGS) spectrum ( keV) containing 3700 background subtracted counts reveals no narrow spectral features with equivalent width of eV, the presence of which might be associated with a NS atmosphere in a high magnetic field (A. Rasmussen, personal communication).
4 Interpreting Previous X-ray Observations
We can now assume the XMM-Newton spectral results to derive the flux during HRC observations. The background-subtracted count rate for the pulsar in the HRC, corrected for dead-time and mirror vignetting, is 1.32 s-1 and 1.13 s-1 for the first and second observations, respectively. Assuming the shape of the XMM-Newton spectrum given above, the respective keV HRC flux is then ergs cm-2 s-1 and ergs cm-2 s-1, consistent with the XMM-Newton derived flux and records a decline in intensity between the HRC observations separated by just over three months.
We next measured the flux from XTE J1810197 in the “quiescent” state using the archival Einstein, ROSAT, and ASCA detections. The ROSAT all-sky survey source 1RXS 180951.5–194345 was serendipitously detected off-axis in four pointed ROSAT PSPC observations spanning 1991-1993 (see table 3). In particular, the best spectrum was obtained from the 1993 Apr 3 observation of SNR G11.2–0.3 in which XTE J1810197 fell off-axis. A total of 294 counts were collected within a source extraction aperture during the 5340 s of good exposure time. These counts are sufficient to show that the spectrum has changed significantly in the active state, as the XMM-Newton model produced an unacceptable fit to the ROSAT data. Keeping the column density fixed to the XMM-Newton derived value but leaving the black-body and power-law normalization constants free to be fitted independently also resulted in an unacceptable fit. Instead, the best fit is obtained with a simple blackbody of temperature of keV ( for 14 degrees of freedom), which is preferable over a simple power-law model which, although resulting in a similar fit statistic, required an index of . The absorbed flux is then ergs cm-2 s-1, almost two orders-of-magnitudes less than that recorded in the active state. Table 3 summaries our flux measurement using either the above model or a direct fit to the ROSAT archival data.
With the above quiescent state spectral model we can estimate the detectability of the pulsed signal of CXOU J180951.0194351 in the 1993 Apr 3 PSPC data. Based on the pulse profile of CXOU J180951.0194351 and an estimate of the local background in the PSPC aperture, we expect the ROSAT source to have a pulsed fraction of 39.7% if most of the pulsed emission is within the ROSAT energy band. This should produce a statistic of 32 for a sine wave, corresponding to a false detection probability of per trial. However, no significant signal was detected within a range encompassing any likely spin-down rate ( s) around the expected period to an upper limit of , corresponding to pulsed fraction . We therefore conclude that 1RXS 180951.5–194345 was less pulsed in the ROSAT observation than it is in the current high state, otherwise we would have easily detected the 5.54 s signal.
AX J180951–1943 was observed in three ASCA observations, acquired on 1996 April 2 and 8, and 1999 Sep 28. Having data from the same instrument should provide a measure of the variability, in principle. However, these detections are at the , , and significance level, respectively, as the location of the source in each case fell partially off the edge of the GIS detector. Notwithstanding, we find that the ROSAT model gives a reasonable fit to ASCA data and no significant variation in flux is found between these measurements taken 3.5 years apart (see Table 3). However, we advance these ASCA results with caution as the flux measurements are likely affected by large unknown systematic uncertainties. Although no periodic signal is detected in the ASCA data, the search is hardly constraining because of the low signal-to-noise ratio.
5 Search for an Optical/IR Counterpart
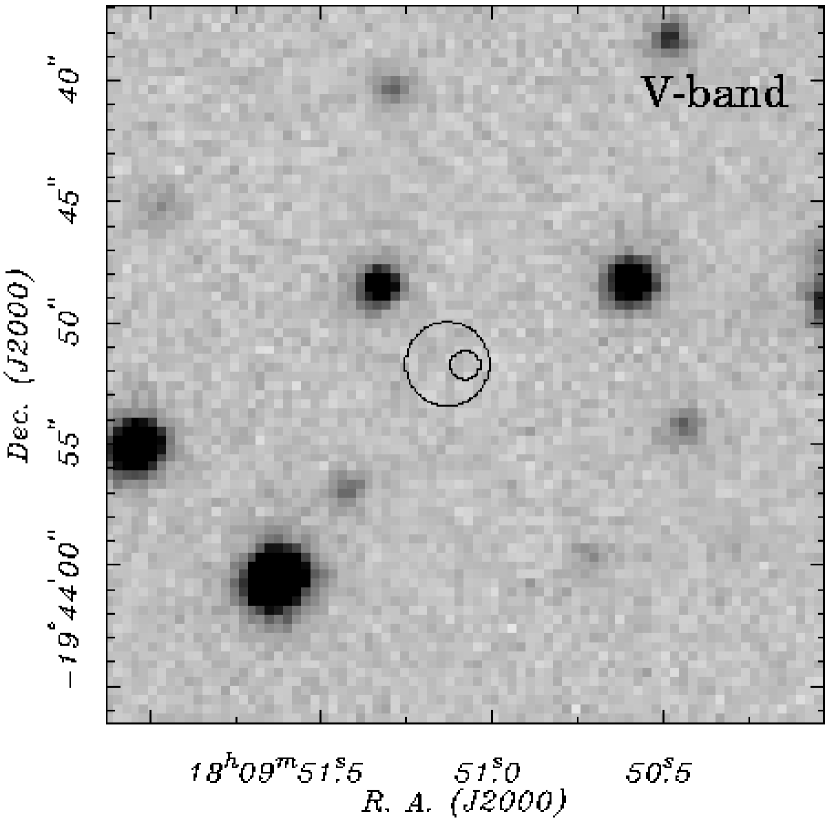
The identification of an optical/IR counterpart, or the apparent lack of one, is key to interpreting the nature of XTE J1810197. A search of stellar catalogs reveals no candidate within the HRC error circles of CXOU J180951.0194351, nor does an inspection of the Digitized Sky Survey (DSS) -, - and -band images from either the first or second generation plates. The closest star is from the X-ray position. Listed as USNO-B1.0 ID#0702-0541769 at , (J2000), its magnitudes are and . This object is also a 2MASS source with measured infrared magnitudes of , , and .
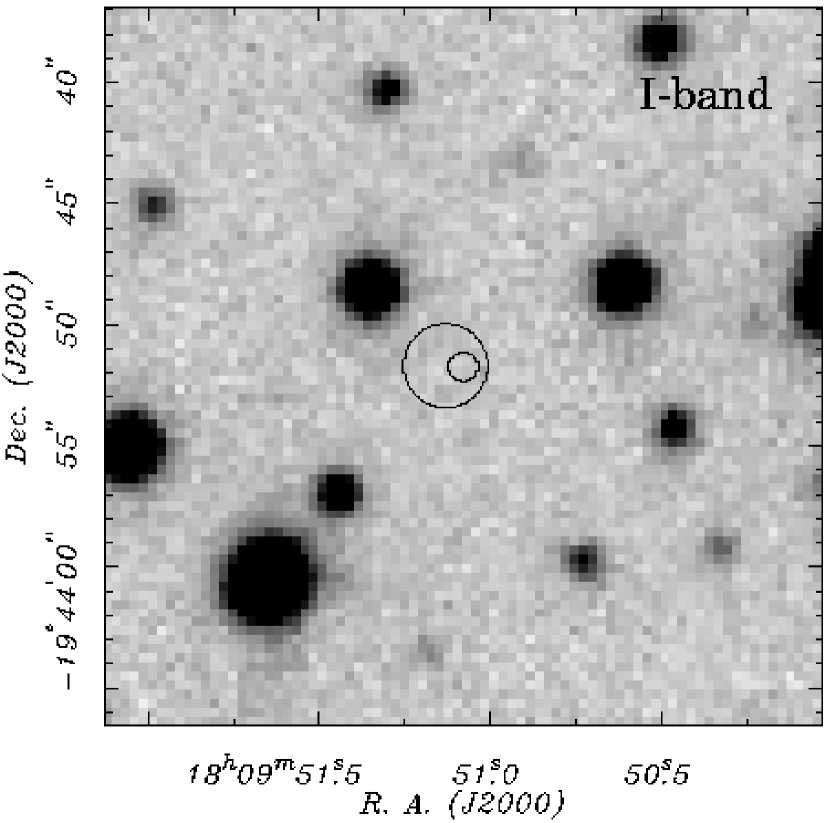
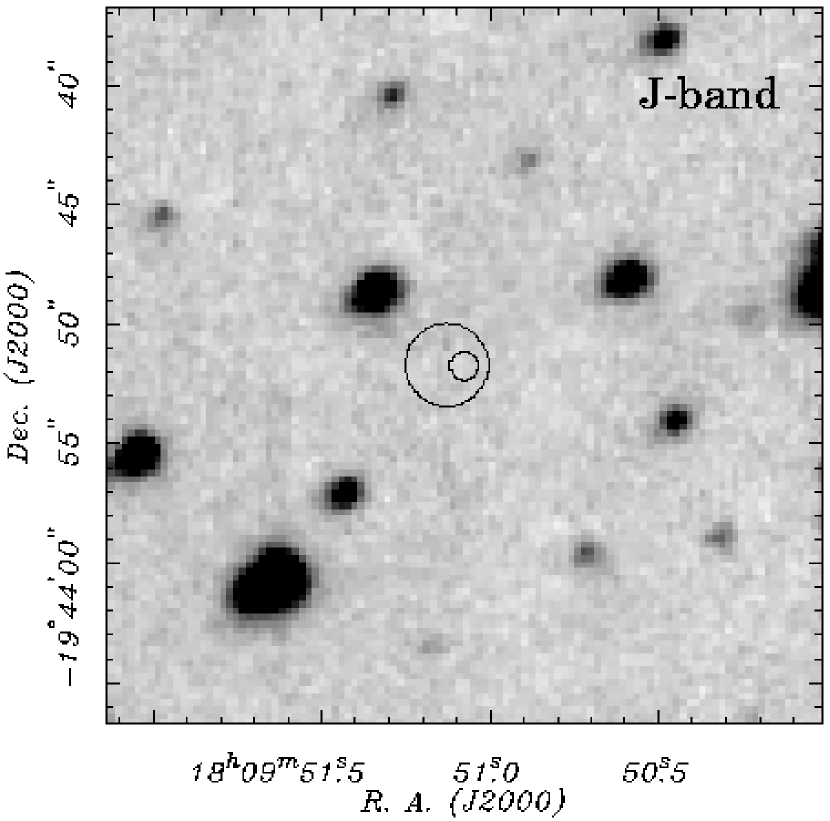
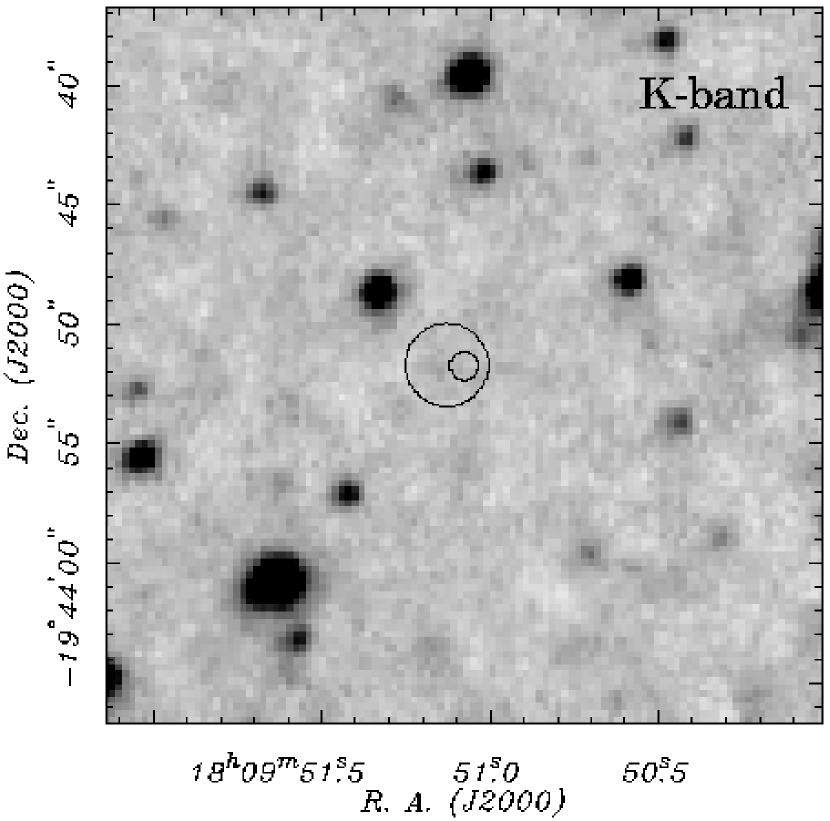
We performed a deeper search for a stellar counterpart shortly following the Chandra localization of CXOU J180951.0194351 using the SMARTS111http://phoenix.astro.yale.edu/smarts/ 1.3m telescope at CTIO on UT 2003 August 31.08 and September 01.14. Images in -, -, -, and -band filters were obtained with the ANDICAM222http://www.astronomy.ohio-state.edu/ANDICAM/, a dual-channel imager capable of obtaining optical and infrared data simultaneously. Data was recorded by a Fairchild-447 CCD on the optical channel and a Rockwell HgCdTe “Hawaii” array on the infrared channel.
Observations on both nights were taken through cirrus clouds. The exposure times for the optical frames were 300 s, and a total of 210 s for the infrared exposures. The final infrared images consisted of seven 30 s sub-exposures, each shifted in right ascension or declination by an internal mirror. The infrared images were rebinned by a factor of two to pixel-1 to better match to the seeing, which was . Optical images were bias subtracted and flat fielded using CCDPROC in the IRAF analysis package. Infrared images were reduced using an in-house IRAF script which flat fields, subtracts scaled sky images, shifts the images to a reference image, then combines all images by averaging them. The infrared sky flat was created by averaging three bright sky images and three faint sky images then taking the difference. The sky flats of a particular filter are taken every third night, where possible. The flats from one epoch to another do not differ by more than 1%.
The final reduced images (Figure 7) were aligned to the USNO astrometric reference frame. Within the Chandra error circle, no new source is seen in these optical or infrared images down to the following limiting magnitudes: . These limits are referenced to the nearby star USNO B1.0 ID#0702-0541769 whose magnitudes were given above. The () and () colors of this object correspond to an M4 star. Since there is no -band calibration for this field, the magnitude of the reference star was therefore estimated from the () color of an M4 star.
6 Distance, Luminosity, and Timing Constraints on Interpretations
The X-ray measured cm-2 is somewhat more than half the total Galactic 21 cm measured cm-2 in this direction (), which suggests only that the distance to CXOU J180951.0194351 is of order 10 kpc. However, it could be as close as kpc if we adopt the typical run of visual extinction in the solar neighborhood, mag kpc-1, together with cm-2 mag-1 (we note that these estimates neglect possible additional systematic uncertainty in due to our choice of a particular X-ray spectral model for fitting.) More specifically, it is also useful to compare with the properties of the supernova remnant G11.2–0.3, which is only from XTE J1810197. An H I absorption kinematic distance of 5 kpc is estimated for G11.2–0.3 (Green et al. 1988). Since the X-ray measured column density to G11.2–0.3 is cm-2 (Vasisht et al. 1996), and since the total 21 cm H I column densities do not differ significantly between the two X-ray source positions (Stark et al. 1992), we may consider that 5 kpc is actually an upper limit on the distance to XTE J1810197. With the distance somewhat uncertain, we parameterize the calculations that follow in terms of , the distance in units of 5 kpc.
The absence of an optical/IR counterpart for CXOU J180951.0194351 practically rules out a high-mass binary companion, such as an OB supergiant or Be transient. For example, assume absolute magnitudes and as appropriate for stars in the spectral range B0 V–B2 III. Even in the presence of 6 magnitudes of -band extinction (the equivalent of cm-2), the -band extinction is only 0.8 mag. At a distance of 5 kpc, a high-mass binary should therefore have and , while the X-ray error circle is blank to and in the ANDICAM images. Even if the column density were underestimated by a factor of 5, the -band extinction would be only mag, not enough to obscure an OB companion in that band.
A low-mass binary, similar to the 7.67 s pulsar 4U 1626–67, is much more difficult to exclude at this low Galactic latitude since a late-type main-sequence or degenerate companion may fall below the limits of our optical and IR images if its distance is toward the high end of our estimates. Consider a typical K5 V LMXB secondary of and . At 5 kpc, its apparent magnitudes including the effects of extinction could be and . Also, we may not necessarily expect to see optical emission greatly enhanced by X-ray heating of a companion or outer accretion disk, since the intrinsic X-ray luminosity in the 0.5–10 keV band is only ergs s-1.
The expected Doppler delay in a small LMXB orbit may also not be detectable in the 5.54 s X-ray pulsations, a limitation that has long thwarted timing tests for binary companions in AXPs in general (Mereghetti, Israel, & Stella 1998; Wilson et al. 1999). We searched for phase jitter in the XMM pulse profiles of CXOU J180951.0194351 by cross-correlating folded light curves in 5 minute segments with a master profile constructed from the entire observation. No systematic deviations from a constant phase were found to a limit of 0.005 cycles, which implies that of the neutron star’s hypothetical orbit must be less than 0.03 lt-s for orbital periods in the restricted range 10 min – 8 hr. This is comparable to the limits achieved in the most sensitive case for 1E 2259+586 by Mereghetti et al. (1998). As those authors discussed, such a limit rules out most but not all main-sequence companions, but a helium-burning companion or a white dwarf is still allowed. Similarly, the known binary companion of 4U 1626–67 is still not detectable via this method. A more restrictive search for a low-mass binary companion (or fossil accretion disk) requires deeper optical/IR imaging. Most recently, the initial report by Israel et al. (2003) of a object within the HRC error circle severely constrains the existence of such counterparts.
The timing and spectral parameters of XTE J1810197 are typical of an AXP and nearly identical to those of AXP 1E104859 (Paul et al. 2000), which notably also lacks a detected SNR. The rapid spin-down rate ( s/s; Ibrahim et al. 2003) and slow period imply a large magnetic field ( G) and spin-down energy loss rate of erg s-1, far below the observed X-ray luminosity, which is ergs s-1 in the 0.5–10 keV band. In the power-law plus blackbody model (Table 3) the blackbody has a temperature of K and a bolometric luminosity of ergs s-1. Its area is cm2 (neglecting unknown geometric and beaming factors), which is of the area of a neutron star. Thus, the large pulsed fraction of this dominant component is consistent with rotational modulation of a necessarily small emitting region on the surface. This implies a flux ratio of the two components of . These X-ray spectral properties are consistent with the dependences on spin-down rate for AXPs and SGRs found by Marsden & White (2001), and also with the increase of pulsed fraction with increasing ratio of shown by Israel, Mereghetti, & Stella (2002).
In the alternative double blackbody spectral model (Table 3), the fitted is reduced to cm-2, suggesting a smaller distance kpc. The large surface area implied for the cooler () blackbody component in this model, cm2 is half the area of the NS. This makes it difficult to explain why the soft X-rays, which come from the cooler blackbody, have a pulsed fraction as high as 36% unless is significantly less than 5 kpc, thus reducing the emitting area. In its favor, a purely thermal model can explain why the pulsed fraction increases with energy, and why the pulses are in phase at all energies, assuming the geometry to be that of a small hot spot surrounded by a cooler annulus. Otherwise, the observed pulsed fractions and phase relationship have no obvious explanation in the power-law plus blackbody model. So it is possible that the X-ray manifestation of the “outburst” of a transient AXP is largely evidence of a thermal heating event on the NS surface. Moreover, we note that the temperature measured by ROSAT using a single blackbody model is even lower that found for the cooler component of the two-temperature model. When is held fixed at cm-2, the effective area of the ROSAT blackbody fit is cm2, compatible with the surface area of a NS. This perhaps accounts for the failure to detect rotational modulation in the quiescent state.
7 Conclusions and Suggestions for Further Work
Although CXOU J180951.0194351 fell far from the location reported for XTE J1810197 by Markwardt et al. (2003a), the detected pulsations clearly identify them as the same source. Given the positional coincidence of the Chandra and XMM-Newton sources with the fainter Einstein, ROSAT, and ASCA detections, we can only assume that they are one and the same and summarize that the flux from XTE J1810197 has increased by nearly two orders-of-magnitude between the year 2003 observations and those fortuitously preserved in the archives. These archival observations show suggest flux stability over the 9 years prior to the current active state. Since its first pulsed detection in 2003 January, XTE J1810197 has faded by half, before which it was either too faint for RXTE to detect, or perhaps unpulsed. The complete range of behavior of XTE J1810197 has yet to be determined.
Our search for an optical/IR counterpart of CXOU J180951.0194351 is predicated on the reliability of the Chandra error circle. Without a fiducial X-ray source to register the HRC X-ray field against the optical reference frame, we cannot eliminate the systematic portion of the aspect error and have assumed the nominal uncertainty. Still, we can rule out any bright optical source as a counterpart considering that the distance to the closest star is , well in excess of the expected systematic and random error.
Time variability of the flux from an isolated neutron star is intriguing. The flux change seen from XTE J1810197 is consistent with that found for AX J1844.80256, the original example of a transient AXP, which was caught only once in a bright, active state. The CCO in SNR RCW 103, a non-pulsating AXP-like object (Gotthelf, Petre, & Hwang 1997; Gotthelf, Petre, & Vasisht 1999), has been monitored for over a decade and it is found to display marked variability on months to years time scales. Furthermore, like the CCO’s, AX J1844.80256 is also centered on a shell-type radio and X-ray SNR, G26.6+0.1 (Gaensler et al. 1999, Vasisht et al. 2000). If XTE J1810197 is an object related to AX J1844.80256 and the CCO in RCW 103 as suggested by its spectrum and variability, then we might expect to find an associated supernova remnant, however, so far none is found either in X-ray images or in the archival VLA NVSS map. This is most surprising as XTE J1810197 is one of the younger AXPs, with a spin-down age ( yr, based on the reported period derivative (Ibrahim et al. 2003).
The leading theory for the nature of SGRs and AXPs is the magnetar model as first proposed by Duncan & Thompson (1992). In this model, in the absence of soft-gamma-repeater-like outbursts, one expects generally smooth spin-down, as found for XTE J1810197 (Ibrahim et al. 2003). This model is also well suited to the properties of AX J1844.80256, and is consistent with the inferred magnetic field for XTE J1810197 (Ibrahim et al. 2003). However, while the magnetar theory as currently envisioned explains the episodic hard X-ray activity associated with SGRs, it does not predict the softer X-ray variability and pulsar turn on/off seen in the TAXPs. This behavior is more typically of accreting binary systems or, perhaps hypothetically, accretion from a fall-back disk of material that formed shortly after the supernova explosion that gave birth to an isolated neutron star. Severe constraints have been placed on the plausibility of the latter scenario by optical/IR observations of AXPs (Hulleman et al. 2000, Hulleman, van Kerkwijk, & Kulkarni 2000, Kern & Martin 2002). In particular, direct detection of high-amplitude optical or IR pulsations at the X-ray period, e.g., as Kern & Martin (2002) achieved in the case of 4U0142+61, would be strong evidence that CXOU J180951.0194351 is an isolated neutron star.
The discovery of a second example of a transient AXP, one which lacks pulsation in its quiescent state, offers the possibility of interpreting CCOs as quiescent AXPs. No periodic signals have been detected so far from the CCOs in the Cas A and RCW 103 SNRs, for example, despite deep timing observations of both. Cas A is known to be a very young ( yrs) object with a spectrum consistent with an AXP (Chakrabarty 2001; Mereghetti, Tiango, & Israel 2002) while SGRs are thought to be older ( yrs) manifestations of the AXPs (Gotthelf 1999; Gaensler 2001). AXPs and SGRs have long been considered related phenomena, reinforced by the recent detection of SGR-like bursts from two AXPs (Gavriil et al. 2002; Kaspi et al. 2003). We hypothesize that the various “classes” of young neutron stars that differ significantly from rotation-powered pulsars are phenomenologically related, possibly through an evolutionary progression.
Further monitoring of XTE J1810197 while it is in an active, pulsating state is essential to determine the emission mechanism(s) and the time spent at various levels of luminosity. Monitoring can help determine the probability of a neutron star being in a “hidden” inactive state of high duty cycle. This has important consequences for population studies of young neutron stars and further argument for a vast underestimation of the AXP/NS formation rate (Gotthelf & Vasisht 2000). Measurement of the quiescent spectrum is especially important to help identify this faint population of likely missed NSs.
References
- Bamba et al. (2003) Bamba, A., Ueno, M., Koyama, K., Yamauchi, S. 2003, ApJ, 589, 253
- Chakrabarty et al. (2001) Chakrabarty, D., Pivovaroff, M. J., Hernquist, L. E., Heyl, Jeremy S., Narayan, R. 2001, ApJ, 548, 800
- Duncan & Thompson (1992) Duncan, R. C., & Thompson, C. 1992, ApJ, 392, L9
- Flaccomio et al. (2003) Flaccomio, E., Damiani, F., Micela, G., Sciortino, S., Harnden, F. R., Murray, S. S., Wolk, S. J. 2003, ApJ, 582, 382
- Gaensler et al. (1999) Gaensler, B. M., Gotthelf, E. V., Vasisht, G. 1999, ApJ, 526, L37
- Gavriil & Kaspi (2002) Gavriil, F. P., & Kaspi, V. M. 2002, Nature, 419, 142
- Gotthelf, Petre, & Hwang (1997) Gotthelf, E. V., Petre, R. & Hwang, U. 1997, ApJ, 487, L175
- Gotthelf & Vasisht (1998) Gotthelf, E. V., & Vasisht, G. 1998, NA, 3, 293
- Gotthelf, Petre, & Vasisht (1999) Gotthelf, E. V., Petre, R. & Vasisht, G. 1999, ApJ, 514, L107
- Gotthelf & Vasisht (2000) Gotthelf, E. V. & Vasisht, G. 2000, in ASP Conference Proceedings Vol. 202, “Pulsar Astronomy - 2000 and Beyond”, IAU Colloquium 177, eds. Kramer, Wex, & Wielebinski (Provo, Utah), p. 699; astro-ph/9911344
- Gotthelf et al. (2003) Gotthelf, E. V., et al. 2003, IAU Circ. 8190.
- Green et al. (1988) Green, A. J., Gull, S. F., Tan, S. M., & Simon, A. J. B. 1988, MNRAS, 231, 735
- Harris et al. (1990) Harris et al. 1990, SAO/NASA Report, Vol. 6
- Hulleman, van Kerkwijk, & Kulkarni (2000) Hulleman, F., van Kerkwijk, M. H., & Kulkarni, S. R. 2000, Nature, 408, 689
- Hulleman et al. (2000) Hulleman, F., van Kerkwijk, M. H. Verbunt, F. W. M., & Kulkarni, S. R. 2000, A&A, 358, 605
- Ibrahim et al. (2003) Ibrahim. I. A., et al. 2003, ApJ, submitted
- Israel et al. (2002) Israel, G., Mereghetti, S., & Stella, L. 2002, MmSAI, 73, 465
- Israel et al. (2003) Israel, G., et al. 2003, Astronomer’s Telegram, 203.
- Jansen et al. (2001) Jansen, F., et al. 2001, A&A, 365, L1
- Kaspi et al, (2003) Kaspi, V. M., Gavriil, F. P., Woods, P. M., Jensen, J. B., Roberts, M. S. E., Chakrabarty, D. 2003, ApJ, 588, L93
- Kern & Martin (2002) Kern, B., & Martin, C. 2002, Nature, 417, 527
- (22) Markwardt, C. B., Ibrahim, A. I., & Swank, J. H. 2003, IAU Circ. 8168
- (23) Markwardt, C. B., Ransom, S., Woods, P., Ibrahim, A., Kaspi, V., Roberts, M., & Swank, J. 2003, ATel 188
- Marsden & White (2001) Marsden, D. & White, N. E. 2001, ApJ, 551, L155
- Mereghetti (2002) Mereghetti, S., Chiarlone, L., Israel, G. L., & Stella, L. 2002, in Proceedings of the 270 WE-Heraeus Seminar on Neutron Stars, Pulsars, and Supernova Remnants, MPE Report 278, eds. W. Becker, H. Lesch, & J. Trümper. Garching bei München: Max-Plank-Institut für extraterrestrische Physik, p. 29
- Mereghetti et al. (1998) Mereghetti, S., Israel, G. L., & Stella, L. 1998, MNRAS, 296, 689
- Murray et al. (1997) Murray, S. S., et al. 1997, Proc. SPIE, 3114, 11
- Paul et al. (1997) Paul, B., Kawasaki, M., Dotani, T., & Nagase, F. 2000, ApJ, 537, 319
- Standish et al. (1992) Standish, E. M., Newhall, X., Williams, J. G., & Yeomans, D. K. 1992, in Explanatory Supplement to the Astronomical Almanac, ed. P. K. Seidelmann (Mill Valley: University Science), 279
- Stark et al. (1992) Stark, A. A., Gammie, C. F., Wilson, R. W., Bally, J., Linke, R. A., Heiles, C., & Hurwitz, M. 1992, ApJS, 79, 77
- Torii et al. (1998) Torii, K., Kinugasa, K. Katayama, K., Tsunemi, H., & Yamauchi, S. 1998, ApJ, 503, 843.
- Turner et al. (2001) Turner, M. J. L., Briel, U. G., Ferrando, P., Griffiths, R. G., & Villa, G. E. 2003, SPIE, 4851, 169
- Vasisht et al. (1996) Vasisht, G., Aoki, T., Dotani, T., Kulkarni, S. R., & Nagase, F. 1996, ApJ 456, L59
- Vasisht et al. (2000) Vasisht, G., Gotthelf, E. V., Torii, K., & Gaensler, B. M. 2000, ApJ, 542, L49
- Weisskopf et al. (1996) Weisskopf, M. C., O’Dell, S. L., & van Speybroeck, L. P. 1996 Proc. SPIE Vol. 2805, 2
- Wilson et al. (1999) Wilson, C. A., Dieters, S., Finger, M. H., Scott, D. M., & van Paradijs, J. 1999, ApJ, 513, 464
| Mission/ | Obs | Exposure | R.A. | Decl. | Count |
|---|---|---|---|---|---|
| Instrument | Date | Time | RateaaBackground subtracted count rate corrected for detector dead-time. Rates quoted for ASCA are for the combined GIS2+GIS3 detectors. | ||
| (UT) | (ks) | (J2000) | (J2000) | (s | |
| Einstein/IPC | 1980 Mar 31 | 0.7 | 18:09:53 | –19:44:40 | |
| ROSAT/RASS | 1990 Sep 03 | 0.3 | 18:09:51.5 | –19:43:45.5 | |
| ROSAT/PSPC | 1991 Mar 18 | 3.0 | 18:09:49 | –19:44 | |
| ROSAT/PSPC | 1992 Mar 07 | 8.3 | 18:09:51.8 | –19:43:35 | |
| ROSAT/PSPC | 1993 Apr 02 | 10.0 | 18:09:49 | –19:44 | |
| ROSAT/PSPC | 1993 Apr 03 | 5.3 | 18:09:51.5 | –19:43:45 | |
| ASCA/GIS | 1996 Apr 02 | 11.0 | 18:09:51.3 | –19:43:06 | |
| ASCA/GIS | 1996 Apr 08 | 10.3 | 18:09:51.3 | –19:43:06 | |
| ASCA/GIS | 1999 Sep 28 | 38.8 | 18:09:51.3 | –19:43:06 | |
| Chandra/HRC | 2003 Aug 27 | 2.8 | 18:09:51.13 | –19:43:51.7 | |
| XMM-Newton/EPIC-pn | 2003 Sep 08 | 11.5 | 18:09:51.03 | –19:43:51.1 | |
| Chandra/HRC | 2003 Nov 01 | 3.0 | 18:09:51.08 | –19:43:51.7 |
| Mission/ | Obs Date | EpochaaEpoch of phase zero in Figures 3 and 4. Error are quoted at the 95% confidence level | Period |
|---|---|---|---|
| Instrument | (UT) | (MJD/TDB) | (s) |
| Chandra/HRC | 2003 Aug 27 | 52878.96851749 | |
| XMM-Newton/EPIC-pn | 2003 Sep 08 | 52890.56420438 | |
| Chandra/HRC | 2003 Nov 01 | 52944.62890753 |
| Mission/ | Obs Date | or | FluxaaAbsorbed flux in the keV band. All errors are 90% confidence level for a single interesting parameters. | (DoF) | ||
|---|---|---|---|---|---|---|
| Instrument | (UT) | ( cm-2) | (keV) | (keV) | (ergs cm-2 s-1) | |
| Einstein/IPC | 1980 Mar 31 | (fixed) | … | (fixed) | … | |
| ROSAT/RASS | 1990 Sep 03 | (fixed) | … | (fixed) | … | |
| ROSAT/PSPC | 1991 Mar 18 | (fixed) | … | (fixed) | … | |
| 1992 Mar 07 | (fixed) | … | 1.1(13) | |||
| 1993 Apr 02 | (fixed) | … | 1.7(14) | |||
| 1993 Apr 03 | (fixed) | … | 0.8(14) | |||
| ASCA/GIS | 1996 Apr 02 | (fixed) | … | 0.5(10) | ||
| 1996 Apr 08 | (fixed) | … | (fixed) | … | ||
| 1999 Sep 28 | (fixed) | … | 0.4(20) | |||
| Chandra/HRC | 2003 Aug 27 | (fixed) | (fixed) | (fixed) | … | |
| (fixed) | (fixed) | (fixed) | … | |||
| XMM-Newton/ | 2003 Sep 08 | 1.0(193) | ||||
| EPIC-pn | BB flux: | |||||
| PL+BB model | PL flux: | |||||
| XMM-Newton/ | 2003 Sep 08 | 1.0(190) | ||||
| EPIC-pn | BB1 flux: | |||||
| BB1+BB2 model | BB2 flux: | |||||
| Chandra/HRC | 2003 Nov 01 | (fixed) | (fixed) | (fixed) | … | |
| (fixed) | (fixed) | (fixed) | … |