An Attempt to Probe the Radio Jet Collimation Regions in NGC 4278, NGC 4374 (M84), and NGC 6166
Abstract
NRAO Very Long Baseline Array (VLBA) observations of NGC 4278, NGC 4374 (M84), NGC 6166, and M87 (NGC 4486) have been made at 43 GHz in an effort to image the jet collimation region. This is the first attempt to image the first three sources at 43 GHz using Very Long Baseline Interferometry (VLBI) techniques. These three sources were chosen because their estimated black hole mass and distance implied a Schwarzschild radius with large angular size, giving hope that the jet collimation regions could be studied. Phase referencing was utilized for the three sources because of their expected low flux densities. M87 was chosen as the calibrator for NGC 4374 because it satisfied the phase referencing requirements: nearby to the source and sufficiently strong. Having observed M87 for a long integration time, we have detected its sub-parsec jet, allowing us to confirm previous high resolution observations made by Junor, Biretta & Livio, who have indicated that a wide opening angle was seen near the base of the jet. Phase referencing successfully improved our image sensitivity, yielding detections and providing accurate positions for NGC 4278, NGC 4374 and NGC 6166. These sources are point dominated, but show suggestions of extended structure in the direction of the large-scale jets. However, higher sensitivity will be required to study their sub-parsec jet structure.
1 INTRODUCTION
The high resolution capabilities of Very Long Baseline Interferometry (VLBI) have given astronomers the ability to study jets in the inner parsec of active galactic nuclei (AGN), leading to the possibility of testing jet collimation theories and magnetohydrodynamic (MHD) simulations. MHD simulations have been able to explain the formation of AGN jets by magnetic fields threading through an accretion disk around a super-massive black hole. The fields thread out from the disk in a rotating helical coil, accelerating and guiding the plasma away from the disk. The resulting jet structure is expected to show a large opening angle near the base and tight collimation on larger scales (Meier, Koide, & Uchida, 2001). An example where the large opening angle at the base of the jet may have been observed is the elliptical galaxy, M87 (Junor, Biretta, & Livio, 1999). They reported that the jet must form within 30 Schwarzschild radii () of the black hole and the collimation region extends to beyond 100 (Biretta, Junor, & Livio, 2002). M87’s close proximity, large black hole mass, and bright jet make it arguably the best candidate to study the jet collimation region.
Motivated by M87, we began an effort to observe other sources in which the jet collimation region might be probed. We selected sources based on the expected angular size of the Schwarzschild radius [], since that is likely to set the scale of the collimation region. Hence, nearby galaxies with large black hole mass were favored. We further selected sources based on the presence of detectable radio emission. Using black hole masses available in mid 2000, the most promising sources were NGC 4278, NGC 4374 and NGC 6166. The estimated black hole masses available then were 15, 18 and 290, respectively (Gebhardt et al., 2000; Magorrian et al., 1998). NGC 6166 is relatively distant, but what turned out to be an excessively large black hole mass estimate qualified it as part of our sample.
A recent study finds that the correlation between the mass of the central black hole in a galaxy and the velocity dispersion ( relation) is
| (1) |
where = 8.13 0.06, = 4.02 0.32, is the black hole mass, is the central velocity dispersion in units of km s-1 and is a reference velocity taken to be 200 km s-1 (Tremaine et al., 2002). For our three target sources, the black hole masses computed from Equation 1 are substantially lower than those used for the selection process.
Current distance and black hole mass estimates are provided in Table An Attempt to Probe the Radio Jet Collimation Regions in NGC 4278, NGC 4374 (M84), and NGC 6166 for our target sources and M87. The first and second columns list the NGC and 3C catalog numbers of the sources; Messier catalog names are in parentheses. Column 3 provides the computed distances in units of Mpc to these sources using surface brightness fluctuation (SBF) distance moduli, and Column 4 gives the references for these values. Black hole masses are tabulated (Column 5) in units of 108 . These numbers were computed using Equation 1 and the velocity dispersions from the references (Column 6). For M87, the black hole mass is as reported by Tremaine et al. (2002). Using the values in Columns 3 and 5, the inferred angular sizes in micro-arcseconds (as) of the Schwarzschild radius is provided in Column 7.
Section 2 will describe our observing techniques, the calibration process and our imaging approach. Section 3 will briefly introduce characteristics of each source, including previous related observations, and discuss the implications inferred from our new VLBA images. Finally, Section 4 will summarize our results, and remark on the future prospects for probing the jet collimation regions.
2 OBSERVATIONS, CALIBRATION, AND IMAGING
Observations with the 10 VLBA (Napier et al., 1994) antennas of NGC 4374 (also M87), NGC 6166 and NGC 4278 were made on 2001 October 12, 2002 February 14, and 2002 September 19, respectively. These observations were made at 43.127 GHz using 32 MHz bandwidth in each polarization and 2 bit sampling. The resolution was typically 0.2 by 0.4 milli-arcseconds (mas). Since the target sources were faint, phase-referencing techniques were used to improve image sensitivity. Suitable phase calibrators (peak flux density greater than 100 mJy beam-1 and within 2 from target sources) were J1221+2813 (W Comae) for NGC 4278, M87 for NGC 4374, and J1635+3808 for NGC 6166. For the first observation, NGC 4374 and M87 were each observed with short, scheduled scans of 15 seconds, using the “nodding” technique. Analysis of that observation showed that only a few seconds of on-source time were obtained for each scan, and the coherence time was adequate to allow a longer switching time. Therefore, the other two observations were made with scans of 30 seconds on target and 20 seconds on calibrator, for a total switching time of 50 seconds. The approximate total integration times were 200 minutes NGC 4278, 91 minutes for NGC 4374, 85 minutes for M87, and 141 minutes for NGC 6166.
In addition to our target and calibration sources, we also observed fringe finders and check sources. The fringe finders, 3C 345 and 3C 279, were used to make delay corrections. Check sources were included to examine the quality of the phase referencing. The check sources were J1218+1105, J1217+3007 and 3C 345 while observing NGC 4278, NGC 4374 and NGC 6166, respectively.
We followed the standard VLBA data reduction procedure using the NRAO Astronomical Image Processing System (AIPS) as described in Appendix C of the AIPS Cookbook. Delays were corrected using fringe fitting with the fringe finders. They were sufficiently constant that no further fringe fitting was done. Phase calibrators were iteratively imaged and self-calibrated. The images were then used as models to determine the amplitude and phase gains for the antennas. These gains were applied to the target and check sources (phase referencing) and images were made. The target sources proved to be strong enough to allow slowly varying gain errors to be corrected and improved images to be made using self-calibration with long (10, 30 or 60 minutes) solution intervals. Saint Croix was excluded for the phase referenced sources because of rapid phase fluctuations, but was used for the self-calibrated images of the sources observed on 2001 October 12.
Observational results on all sources, excluding fringe finders, are provided in Table 2. We have included both phase-referenced and self-calibrated flux densities to indicate the quality of the phase referencing. Columns 1 and 2 provide the name of the source and what it was used for during the observation. ‘Calib’, ‘Target’ or ‘Check’ indicates that the source was used either as a calibrator, a target or a check source. Columns 3 and 4 list the right ascension and its one-sigma error with the declination and its one-sigma error below it. The coordinates and errors for the calibrators were obtained from the International Celestial Reference Frame Extension 1 (ICRF-Ext.1; IERS, 1999; Ma et al., 1998); the positions for the other sources were measured from our images. Errors account for the error of the calibrator position (the dominate source of error), an assumed 0.1 mas potential error due to differential geometry and atmospheric model errors between calibrator and target or check source, and errors in the measurement of position from the images. Column 5 reports the angular offset () in degrees from the calibrator. Columns 8 through 13 are the peak flux density per beam () of the source in mJy beam-1, the integrated flux density () in mJy, and the off-source image noise (RMS) in mJy beam-1 for both the phase-referenced and the self-calibrated images. To obtain the integrated flux for our target sources and M87, we used a region that is 2.5 mas 1 mas for NGC 4278, 2.8 mas 1 mas for NGC 4374, 2.5 mas 5 mas for M87, and 1.5 mas 1.5 mas for NGC 6166. Phase-referenced and self-calibrated images have been convolved to the same beam size and position angle listed in Column 5 and 6. For 3C 345, observed on 2002 February 14, only the portions of the data scheduled as a check source were included in the phase referencing. The self-calibrated values include all data. The uncertainty of the self-calibrated flux densities is difficult to determine, but we estimate it to be about 10%. It depends on the quality of the VLBA a priori gain calibration, the ability of the phase referencing to remove short term fluctuations for weak sources, the quality of the self-calibration, and the image noise. In all cases, the flux scale (gain normalization) was set by observations above 30° elevation at a subset of antennas that were well-behaved and had good weather on the day of the observation.
The 100-as potential error in the positions due to differential model errors is approximate and was derived in two ways. First, the raw phases showed approximately 10 turns of phase across the day, which is equivalent to across the sky on the longest baselines. Scaling this to an angular error, and decreasing it by the ratio of the calibrator/source separation to a radian, gives an estimate of about 0.1 mas. Second, Pradel, Charlot, & Lestrade (2003) have done a study of the errors in differential VLBI astrometry, suggesting errors of approximately 0.1 mas for our observations (Lestrade, private communication). Two of our check sources (J1218+1105, 3C 345) and two of our target sources (NGC 4278, NGC 4374) are included in the ICRF-Ext.1. In all cases, the calibrator-target or calibrator-check source differential position measured from our images agrees with the differential positions from the ICRF-Ext.1 to better than one-third to one-half of the reported ICRF-Ext.1 errors. This confirms that our measured positions are reasonable and implies that both our differential positions, and the relative positions of close pairs of sources in the ICRF-Ext.1, are significantly more accurate than the absolute position errors in the ICRF-Ext.1.
3 DISCUSSION
3.1 NGC 4278, NGC 4374 and NGC 6166
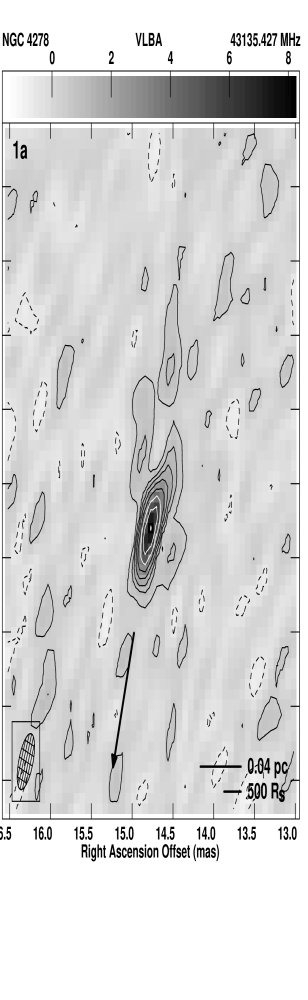
Our VLBA images of NGC 4278 (Figure 1a), NGC 4374 (Figure 1b), and NGC 6166 (Figure 1d) are currently the highest resolution images available for these galaxies. Continuum emission has been detected from the cores at 43 GHz with FWHM resolutions of about 400 as 200 as. While these VLBA images do not clearly reveal any jet structures, they do provide indications of low-level emission that may be associated with jets traced at lower frequencies and lower resolutions. Before discussing each galaxy below, we note that the photometry of the cores at sub-mas resolution (Table 2) may help constrain spectral energy distributions of any advection-dominated accretion flows in these galaxies (Di Matteo, Carilli, & Fabian, 2001; Di Matteo, Johnstone, Allen, & Fabian, 2001; Verdoes Kleijn, Baum, de Zeeuw, & O’Dea, 2002).
3.1.1 NGC 4278
Continuum studies of this elliptical galaxy at arcsecond resolution show dominance by a flat-spectrum, time-variable component at frequencies of 1-15 GHz (Wrobel & Heeschen, 1984, 1991; Nagar, Wilson, & Falcke, 2001; Nagar, Falcke, Wilson, & Ulvestad, 2002). At a FWHM resolution of 3 (230 pc), this component is linearly polarized at 8.4 GHz by 0.34 0.06 percent with an electric vector PA of 16 7 (Bower, Falcke, & Mellon, 2002). Assuming Faraday rotation effects are minimal at this frequency, this polarized emission probably arises in the diffuse structure, mainly to the south and southeast, traced in images at 8.4 GHz at a FWHM resolution of 200 mas (16 pc; Wilkinson et al., 1998) and at 5 GHz at FWHM resolutions of 400 mas (31 pc; Wrobel & Heeschen, 1984) and 2.5 mas (0.2 pc; Falcke, Nagar, Wilson, & Ulvestad, 2000; Giovannini et al., 2001). In Figure 1a, the arrow indicates the direction to the jet component offset from the 5 GHz core by 10 mas (0.8 pc), as measured with the VLBA by Falcke, Nagar, Wilson, & Ulvestad (2000). While our VLBA image of NGC 4278 at 43 GHz shows hints of low-level emission mainly to the north, that emission is too close to the noise to be considered reliable. Finally, we note that our VLBA image at 43 GHz recovers less than one half of the 43-GHz flux density of the unresolved VLA core, in 2000 February, at a FWHM resolution of about 500 mas (39 pc; Di Matteo, Carilli, & Fabian, 2001). Such behavior is expected because the VLBA is insensitive to mas-scale emission at 43 GHz, known to be present at lower frequencies. Still, some of this difference could originate through variability of the sub-mas core between 2000 February and 2002 September.
3.1.2 NGC 4374 (M84)
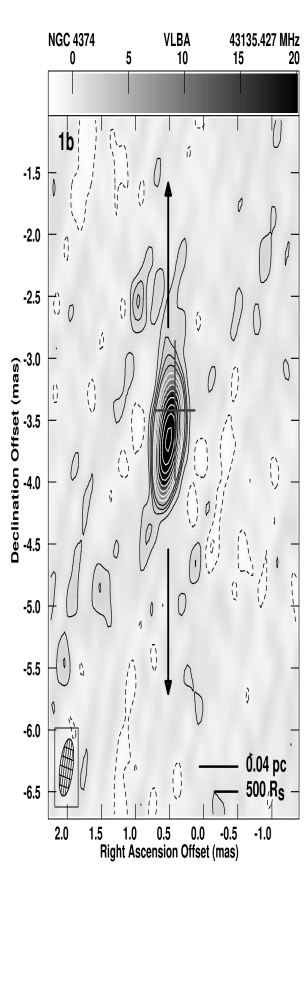
This elliptical galaxy hosts a well-studied Fanaroff-Riley class I (FR-I) radio continuum source (Laing & Bridle, 1987). Images at 5 GHz at a FWHM resolution of 500 mas (44 pc) show two large-scale jets that are initially asymmetric, with the northern main jet being brighter than the southern counterjet. Images at 1.7 GHz at FWHM resolutions of 11 mas (1 pc; Xu et al., 2000) and of 6 mas (0.5 pc; Giovannini et al., 2001) show extensions to the north. A VLBA image at 5 GHz at a FWHM resolution of 2.7 mas (0.2 pc) shows a core plus two components to the north and one to the south, offset in the directions indicated by the arrows in Figure 1b (Nagar, Falcke, Wilson, & Ulvestad, 2002). The available ICRF-Ext.1 position and 1- error for NGC 4374 are marked by a cross in Figure 1b (IERS, 1999). Our VLBA image of NGC 4374 at 43 GHz shows that the core appears to be slightly extended to the north. Unfortunately, the image sensitivity for this galaxy was reduced compared to the other two target sources, due to our less efficient observing strategy. For this reason, and because it is strong enough not to require phase referencing, NGC 4374 is a prime choice for future observations with significantly improved sensitivity.
3.1.3 NGC 6166 (3C 338)
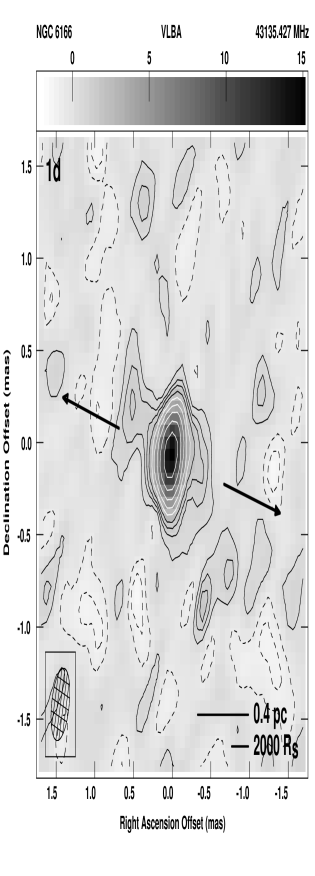
This cD galaxy with multiple nuclei hosts an FR-I source (Giovannini et al., 1998, plus references therein). VLBI images between 1.7 and 8.4 GHz with FWHM resolutions as high as 1.2 mas (0.7 pc) reveal two-sided parsec structure in the direction of the arrows in Figure 1d. Our VLBA image of NGC 6166 at 43 GHz shows slight elongations along those directions. It is unfortunate that the black-hole mass estimate has been revised downward by a factor of 40, offering no real prospect for probing the jet collimation region with this VLBA observation.
3.2 M87
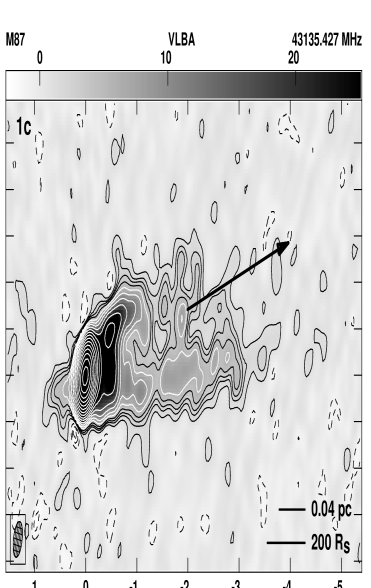
This elliptical galaxy hosts an FR-I source whose main jet is especially well-studied on arcsecond and milli-arcsecond scales (Biretta, Junor, & Livio, 2002, plus references therein). Global VLBI observations at 43 GHz offer sub-mas resolution and indicate that the initial jet collimation region extends to at least 0.5 mas (Junor, Biretta, & Livio, 1999), corresponding to 0.04 pc or 140 for the black hole mass and galaxy distance in Table An Attempt to Probe the Radio Jet Collimation Regions in NGC 4278, NGC 4374 (M84), and NGC 6166. Figure 1c shows our VLBA image of M87 at 43 GHz, with a FWHM resolution of 390 as 170 as, which independently confirms the Junor et al. result of collimation over the inner 1 mas. Moreover, jet emission is detected out to about 3 mas (0.2 pc or 820 ) along the direction of the large-scale jet indicated by the arrow in Figure 1c. One difference between our image and that of Junor et al. is the presence of a weak counterjet in our image. Detection of a counterjet would be very interesting, if real. But such structures are also a natural consequence of amplitude calibration errors. We attempted, through manipulation of the region in which the CLEAN algorithm was allowed to place components during the self-calibration/imaging iterations, to make images without the counterjet. While successful, the counterjet tended to reappear when the CLEAN boxes were opened up to allow it. In the end, despite considerable testing, the counterjet detection can only be considered suggestive, not reliable.
3.3 Other sources
One of our calibrators, J1221+2813 (W Comae), showed extended structure with a component 3 mas southeast from the bright core. The structure is consistent with that seen at 22 GHz by Wiik, Valtaoja, & Leppänen (2001). Our observation of 3C 345 shows a knot 1 mas west from the radio core with additional extended emission. This is consistent with 22 GHz observations made by Ros, Zensus, & Lobanov (2000). J1218+1105 appears to be a compact source at 43 GHz. The check source for our third observation (J1217+3007) is seen mostly as a compact source with low-level emission to the west. Our brightest calibrator, J1635+3808 has a minor jet to the west, appearing “thumb-like”.
4 CONCLUSION
VLBI observations at 43 GHz have shown that M87 jet has a wide opening angle in the inner , providing important clues to jet collimation mechanisms (Biretta, Junor, & Livio, 2002). The VLBA observations reported here were the first from an effort to identify other sources in which the structure of the base of the jet might be observed. The target sources were chosen to have radio continuum emission and large, angular-size black holes. Each of the three target sources, NGC 4278, NGC 4374, and NGC 6166 (3C 338), had point-dominated structure with only hints of the beginning of the jet. The sensitivity of the observations proved to be inadequate to determine the structure of the jet bases. M87 was also observed as the calibrator for NGC 4374; the resulting image agrees with the results of Junor, Biretta, & Livio (1999). Future observations will concentrate on improving sensitivity and finding new sources.
The observations reported here involved phase referencing at 43 GHz with the VLBA. The technique worked well with switching angles between calibrator and target of 1-2 and switching time intervals of 50 seconds (20 seconds on calibrator, 30 seconds on target). A 30 second switching time (i.e. 15 seconds per scan) was tried, but gave unreasonably short on-source integration and was not required by the coherence time. The methods used here allow detection of sources as weak as 2 mJy at 43 GHz with -hour observations.
References
- Biretta, Junor, & Livio (2002) Biretta, J. A., Junor, W., & Livio, M. 2002, New Astronomy Review, 46, 239
- Bower, Falcke, & Mellon (2002) Bower, G. C., Falcke, H., & Mellon, R. R. 2002, ApJ, 578, L103
- Di Matteo, Carilli, & Fabian (2001) Di Matteo, T., Carilli, C. L., & Fabian, A. C. 2001, ApJ, 547, 731
- Di Matteo, Johnstone, Allen, & Fabian (2001) Di Matteo, T., Johnstone, R. M., Allen, S. W., & Fabian, A. C. 2001, ApJ, 550, L19
- Falcke, Nagar, Wilson, & Ulvestad (2000) Falcke, H., Nagar, N. M., Wilson, A. S., & Ulvestad, J. S. 2000, ApJ, 542, 197
- Gebhardt et al. (2000) Gebhardt, K. et al. 2000, ApJ, 539, L13
- Giovannini et al. (1998) Giovannini, G., Cotton, W. D., Feretti, L., Lara, L., & Venturi, T. 1998, ApJ, 493, 632
- Giovannini et al. (2001) Giovannini, G., Cotton, W. D., Feretti, L., Lara, L., & Venturi, T. 2001, ApJ, 552, 508
- IERS (1999) IERS, 1999: 1998 IERS Annual Report, D. Gambis (ed.), Observatoire de Paris, p. 87-114
- Jensen et al. (2001) Jensen, J. B., Tonry, J. L., Thompson, R. I., Ajhar, E. A., Lauer, T. R., Rieke, M. J., Postman, M., & Liu, M. C. 2001, ApJ, 550, 503
- Junor, Biretta, & Livio (1999) Junor, W., Biretta, J. A., & Livio, M. 1999, Nature, 401, 891
- Laing & Bridle (1987) Laing, R. A. & Bridle, A. H. 1987, MNRAS, 228, 557
- Ma et al. (1998) Ma, C. et al. 1998, AJ, 116, 516
- Magorrian et al. (1998) Magorrian, J. et al. 1998, AJ, 115, 2285
- Meier, Koide, & Uchida (2001) Meier, D. L., Koide, S., & Uchida, Y. 2001, Science, 291, 84
- Nagar, Wilson, & Falcke (2001) Nagar, N. M., Wilson, A. S., & Falcke, H. 2001, ApJ, 559, L87
- Nagar, Falcke, Wilson, & Ulvestad (2002) Nagar, N. M., Falcke, H., Wilson, A. S., & Ulvestad, J. S. 2002, A&A, 392, 53
- Napier et al. (1994) Napier, P. J., Bagri, D. S., Clark, B. G., Rogers, A. E. E., Romney, J. D., Thompson, A. R., & Walker, R. C. 1994, Proc. IEEE, 82, 658
- Pradel, Charlot, & Lestrade (2003) Pradel, N., Charlot, P., & Lestrade, J.-F. 2003, SF2A-2003: Semaine de l’Astrophysique Francaise, Bordeaux, June 16-20, 2003, F. Combes, D. Barret, F., T. Contini, eds; EDP Sciences Conference Series in Astronomy, in preparation
- Ravindranath, Ho, & Filippenko (2002) Ravindranath, S., Ho, L. C., & Filippenko, A. V. 2002, ApJ, 566, 801
- Ros, Zensus, & Lobanov (2000) Ros, E., Zensus, J. A., & Lobanov, A. P. 2000, A&A, 354, 55
- Tonry et al. (2001) Tonry, J. L., Dressler, A., Blakeslee, J. P., Ajhar, E. A., Fletcher, A. B., Luppino, G. A., Metzger, M. R., & Moore, C. B. 2001, ApJ, 546, 681
- Tremaine et al. (2002) Tremaine, S. et al. 2002, ApJ, 574, 740
- Verdoes Kleijn, Baum, de Zeeuw, & O’Dea (2002) Verdoes Kleijn, G. A., Baum, S. A., de Zeeuw, P. T., & O’Dea, C. P. 2002, AJ, 123, 1334
- Wiik, Valtaoja, & Leppänen (2001) Wiik, K., Valtaoja, E., & Leppänen, K. 2001, A&A, 380, 72
- Wilkinson et al. (1998) Wilkinson, P. N., Browne, I. W. A., Patnaik, A. R., Wrobel, J. M., & Sorathia, B. 1998, MNRAS, 300, 790
- Wrobel & Heeschen (1984) Wrobel, J. M. & Heeschen, D. S. 1984, ApJ, 287, 41
- Wrobel & Heeschen (1991) Wrobel, J. M. & Heeschen, D. S. 1991, AJ, 101, 148
- Xu et al. (2000) Xu, C., Baum, S. A., O’Dea, C. P., Wrobel, J. M., & Condon, J. J. 2000, AJ, 120, 2950
| (1) | (2) | (3) | (4) | (5) | (6) | (7) |
|---|---|---|---|---|---|---|
| NGC | 3C | (Mpc) | Ref. | (10) | Ref. | (as) |
| 4278 | 16.1 | 1 | 3.4 | 2 | 0.42 | |
| 4374(M84) | 272.1 | 18.4 | 1 | 6.3 | 2 | 0.68 |
| 4486(M87) | 274 | 16.1 | 1 | 30 | 3 | 3.67 |
| 6166 | 338 | 125 | 4 | 7.1 | 2 | 0.11 |
References. — (1) Tonry et al. 2001; (2) Ravindranath, Ho, & Filippenko 2002; (3) Tremaine et al. 2002; (4): Jensen et al. 2001
| (1) | (2) | (3) | (4) | (5) | (6) | (7) | (8) | (9) | (10) | (11) | (12) | (13) | |||||||
|---|---|---|---|---|---|---|---|---|---|---|---|---|---|---|---|---|---|---|---|
| RA () | Phase-referenced | Self-calibrated | |||||||||||||||||
| Source | Source | DEC () | (ms) | FWHM | PA | RMS | RMS | ||||||||||||
| name | usage | (J2000) | (mas) | () | (mas mas) | () | (mJy) | (mJy) | (mJy) | (mJy) | (mJy) | (mJy) | |||||||
| Observed on 2001 October 12 | |||||||||||||||||||
| NGC 4486 | Calib | 12 30 49.423381 | 0.017 | .39.17 | 168 | 610 | 1300 | 0 | .49 | ||||||||||
| +12 23 28.04393 | 0.25 | ||||||||||||||||||
| NGC 4374 | Target | 12 25 03.743336 | 0.018 | 1.5 | .47.19 | 167 | 45 | 80 | 0 | .86 | 71 | 100 | 0 | .56 | |||||
| +12 53 13.13934 | 0.27 | ||||||||||||||||||
| J1218+1105 | Check | 12 18 26.092289 | 0.018 | 3.3 | .66.23 | 167 | 41 | 69 | 3 | .2 | 69 | 95 | 1 | .8 | |||||
| +11 05 05.26293 | 0.27 | ||||||||||||||||||
| Observed on 2002 February 14 | |||||||||||||||||||
| J1635+3808 | Calib | 16 35 15.492973 | 0.055 | .38.21 | 159 | 5100 | 5600 | 1 | .6 | ||||||||||
| +38 08 04.50060 | 0.66 | ||||||||||||||||||
| NGC 6166 | Target | 16 28 38.244693 | 0.056 | 1.9 | .40.22 | 163 | 14 | 22 | 0 | .43 | 15 | 23 | 0 | .44 | |||||
| +39 33 04.23414 | 0.67 | ||||||||||||||||||
| 3C 345 | Check | 16 42 58.809985 | 0.056 | 2.2 | .41.21 | 156 | 1400 | 3900 | 39 | 1500 | 4600 | 2 | .8 | ||||||
| +39 48 36.99432 | 0.67 | ||||||||||||||||||
| Observed on 2002 September 19 | |||||||||||||||||||
| J1221+2813 | Calib | 12 21 31.690515 | 0.019 | .42.17 | 158 | 88 | 280 | 0 | .5 | ||||||||||
| +28 13 58.50026 | 0.29 | ||||||||||||||||||
| NGC 4278 | Target | 12 20 06.825429 | 0.021 | 1.1 | .40.17 | 159 | 6 | .2 | 19 | 0 | .32 | 8 | .2 | 18 | 0 | .32 | |||
| +29 16 50.71418 | 0.31 | ||||||||||||||||||
| J1217+3007 | Check | 12 17 52.081977 | 0.021 | 2.0 | .42.17 | 159 | 67 | 130 | 3 | .5 | 89 | 150 | 2 | .8 | |||||
| +30 07 00.63590 | 0.31 | ||||||||||||||||||