Physical interpretation of the UV/X-ray variability behavior of NGC 7469
We present a re-analysis of the simultaneous 30 day
IUE/XTE observation of NGC 7469 done in 1996. Our main progress in this
paper, in comparison to previous spectral analysis (Nandra et al.
nan98 (1998, 2000)), is to adopt and fit directly to the data a
detailed model of the Comptonized spectrum. This firstly allows to fit
simultaneously the data from the UV to the hard X-ray band in a
self-consistent way and secondly it gives direct constraints on the
physical parameters of the disc-corona system, like
the temperature and optical depth of the corona.
Our results are completely consistent with a slab geometry where
all the observed UV emission is supposed to cross the corona but more
photon-starved geometries also give acceptable fits. Whatever the
geometry is, the UV seed photon emission appears to be dominated by
the reprocessing of the X-rays.
We also found very interesting correlations between the different model
parameters, the most important one being the anticorrelation between
the corona temperature and the UV flux . Such an
anticorrelation is clearly inconsistent with a fixed disc-corona
configuration and suggests a variation of the geometry of the
system.
We also find a correlation between the corona optical depth and the
X-ray flux which may reflect processes linked to the corona formation.
During the observations, NGC 7469 appears to accrete near its Eddington
limit. This source could then be an example of magnetically dominated
disc-corona system as recently proposed by Merloni (mer03 (2003)).
Finally, these data strongly support the presence of a pair free
corona.
Key Words.:
11.19.1; 11.09.1: NGC 7469; 13.25.21 Introduction
The broad band opt-UV-X--ray spectra of Seyfert galaxies is mainly dominated by two components: an optical/UV bump, which was interpreted early on early as the signature of cold material accreting onto a putative super massive black hole (Shields shi78 (1978); Malkan & Sargent mal82 (1982)), and a broader component, covering the soft-X to the hard-X/soft-ray energy band, with a rough power law shape generally cut-off above 100 keV.
These spectra are commonly interpreted in the framework of the reprocessing/upscattering models (e.g. Haardt & Maraschi, haa91 (1991), haa93b (1993)). These models assume the presence of two phases, a cold (generally an accretion disc) and a hot (called the corona) one, radiatively linked one with each other: part of the cold emission, giving birth to the UV bump, is produced by the reprocessing of part of the hot emission. Inversely the hot emission, at the origin of the broad X-ray component, is believed to be produced by Compton upscattering of the soft photons, emitted by the cold phase, on the coronal energetic electrons.
The presence of a high energy cut-off near 100 keV, first detected by
SIGMA and OSSE in NGC 4151 (Jourdain et al. jou92 (1992); Maisack et al.
mai93 (1993)), appears to be common in Seyfert galaxies (Zdziarski et al.
zdz93 (1993); Gondek et al. gon96 (1996); Matt mat01 (2001); Perola et
al. per02 (2002)). The presence of this component, and the lack of any
annihilation lines (while poorly constrained) are generally believed to
be the signature of the thermal nature of the coronal plasma (see however
Malzac & Jourdain mal00 (2000)), the cut-off energy being then of the
order of the coronal temperature. No cut-off but strong annihilation
lines were indeed expected by the different non-thermal models develop in
the 80-90s. However when taking better into account the feedback of the
accelerated particles on the acceleration process (Done et al.
don90 (1990); Henri & Pelletier hen91 (1991); Petrucci, Henri &
Pelletier al. pet01 (2001)) non-thermal models also predict spectral
shape in
agreement with the observations.
Stronger and less ambiguous constraints on the nature of the coronal plasma are expected from variability studies. For example, in the case of a thermal hot corona in radiative equilibrium with the cold phase, the X-ray spectral shape is expected to harden (the photon index decreases) when the corona temperature (and thus the high energy cut-off) increases (Haardt et al. haa97 (1997)). Inversely, in the case of a non-thermal plasma, a softening of the spectrum is expected when the cut-off energy increases to ensure the balance between the accelerated particles and the shocked gas pressures (Petrucci et al. pet01 (2001)).
Such variations of the X-ray spectral shape may be produced by intrinsic
changes of the corona properties (for example changes of the heating
process efficiency) and/or by variation of the external environment like
changes of the soft photons flux (and consequently of the corona cooling)
produced by the cold phase. Simultaneous information in the UV and X-ray
band are then needed to constrain the nature of the different processes
acting in both phases.
Several observations have already suggested a link between the UV and/or
the extreme UV and the X-ray emission in Seyfert galaxies (Clavel et al.
cla92 (1992); Edelson et al. ede96 (1996); Marshall et al. mar97 (1997);
Chiang et al. chi00 (2000); Uttley et al. utt00 (2000); Shemmer et al.
she01 (2001)), showing strong correlations (with small or zero time lag)
between the different fluxes, in good agreement with the
reprocessing/upscattering interpretation. In some cases however, the
X-rays and the optical/UV bands appear to be completely disconnected. For
instance, the 1 month simultaneous IUE/RXTE monitoring campaign on
NGC 7469 performed in 1996, showed only poor correlations between the
2-10 keV and UV fluxes (Nandra et al. nan98 (1998), hereafter N98).
Strong X-ray variations on small time scale were also detected but none
in UV. Similar behavior has been observed in NGC 3516 (Edelson et al.
ede00 (2000); Maoz et al. mao00 (2000, 2002)). These last results ruled
out apparently, and at least for these sources, the basic interpretation
presented above.
The spectral analysis of the 1996 RXTE data of NGC 7469 by Nandra et al.
(nan00 (2000) hereafter N00) however permit to resolve these
contradictions for this source. These authors indeed found that the
X-ray spectral index in NGC 7469 was strongly correlated with the UV flux
at zero time lag during the campaign. They interpret this result as a
strong support for the X-rays being produced by Compton upscattering of
the UV photons. In this framework, the observed variability of the UV
flux is expected to directly modify the cooling rate of the hot corona,
thus producing the observed X-ray spectral changes. The delays found
between the RXTE hard X-rays with respect to the soft ones by Papadakis,
Nandra, & Kazanas (pap01 (2001)) also offers additional support to the
hypothesis that the X-ray are most likely due to Comptonization of soft
photons by hot, thermal electrons. The apparent disconnect between the
X-ray and UV fluxes previously reported by N98, was then explained by the
narrow band used in the X-ray (2-10 keV), which, in the presence of
spectral variability, may result in incoherent
behavior with respect to the UV one.
The spectral treatment done by N00 assumed a simple power law shape for
the X-ray continuum. It is known however that the real Comptonization
spectral shape may be significantly different from a power law (Haardt
haa93 (1993); Svensson sve96 (1996); Petrucci et al. pet00 (2000)).
Moreover, the interpretation of the spectral variability in term of
physical quantities, like the temperature and optical depth of the
corona, is not straightforward with a phenomenological power law
approximation and requires the use of approximate formulae. The aim of
this paper is then to perform a re-analysis of the simultaneous IUE/XTE
data by explicitly fitting the UV and X-ray continuum using a realistic
Comptonization model. As just said, the first interest of this
re-analysis is that we will have direct information on physical
quantities characterizing the hot and cold phases. The broad band (from
UV to hard X-rays) energy range of the Comptonization spectra also permit
to fit simultaneously the IUE and RXTE data and to predict the spectral
behavior at high energy (i.e. above 20 keV, the upper limit of our RXTE
data) in a completely
consistent way.
The paper is organized as follows. We first present the data and the model used in Sect. 2. We then show, in Sect. 3, the results we obtain fitting simultaneously the IUE and XTE data and we also present the most interesting correlations we found between the different model parameters. We discuss these different results in Sect. 4 and then conclude on this work in the last section.
2 Observation and data analysis
2.1 The data
Many of the details of the RXTE observations are reported in N98 and N00 and the reader can refer to these papers for more details. The “L7+activation” model was employed for the background. The standard selection criteria in the “rex” RXTE processing script has also been applied.
The background subtraction was however unreliable at high energies for sources as weak as NGC 7469 and the spectral analysis was therefore restricted to the 2-20 keV energy band. Different response matrices were calculated for different times of the observation using PCARSP v2.37 but no significant differences were found between the derived spectra. We therefore used a single matrix for the entire observation.
The IUE data used here are described in Wanders et al. (wan97 (1997)). NGC 7469 has also been observed by the HST FOS instrument in the midst of the IUE monitoring (Kriss et al. kri00 (2000)). The better quality of the HST data has allowed to disentangle the UV continuum more accurately from the broad wings of the emission lines and thus to identify four clean continuum windows free of any emission and/or absorption features, and centered on 1315, 1485, 1740 and 1825 Å. We fit the data using XSPECv11.1. Since the XSPEC fitting tools need spectral bin larger than 1 eV, we have rescaled the UV fluxes in order to have 4 windows of 1eV band width. In the following, and to be comparable with the results of Wanders et al. (wan97 (1997)) and Kriss et al. (kri00 (2000)), the UV fluxes are given in erg.s-1.cm-2.Å-1 and are measured in a bandwidth of 21 Å.
Like in N00, the observation have been divided into 30 segments of approximately 1 day duration with sufficient photon statistics to permit precise spectral analysis.
2.2 The model
We fit the data using, for the continuum, the thermal Comptonization model in slab geometry developed by F. Haardt (Haardt haa93 (1993); Haardt haa94 (1994); Haardt et al. haa97 (1997)). Hereafter we will refer to this Anisotropic Comptonization Code as AC2. The code treats Comptonization in steady-state, i.e., energy balance is implicitly assumed, so that an unspecified heating term balances radiative losses. Given the temperature and optical depth of the corona, the angle–dependent spectra of a disc–corona system in plane parallel geometry is derived using an iterative scattering method, where the intrinsic anisotropy of the scattering is taken into account only in the first scattering order. The Compton recoil is also treated accurately. It includes also a reflection component described following White, Lightman & Zdziarski (whi88 (1988)) and Lightman & White (lig88 (1988)) and assuming neutral matter. The spectral shape of the reflected photons is averaged over angles. It is multiplied by a first normalization factor which depends on the inclination angle (see Ghisellini, Haardt & Matt ghi94 (1994) for details). In addition, the usual normalization is left free to vary in the fit procedure, so that, for the given inclination angle, corresponds to a solid angle, subtended by the reflector, of 2. The resulting Comptonization spectral shape generally is quite different from the simple cut-off power law approximation generally used to mimic Comptonization spectra. Moreover, due to anisotropy effects, the first scattering order is reduced in comparison to the other orders, and the observed spectral shape is better approximated by a broken power law, the energy of the break depending mainly on and . It is expected to be in the 2-10 keV range for the parameter values we used (cf. Petrucci et al. pet00 (2000) for more details).
The fit parameters in AC2 are the temperature of the corona , its optical depth , the temperature of the disc (assumed as a single temperature black body) and the reflection normalization . There are then two extra parameters compared to the simple power law + reflection model used by N00. Other natural outputs of AC2 are the total (integrated over the solid angles) X-ray fluxes emitted by the corona (upward toward the observer and backward toward the disc) as well as the total UV flux emitted by the disc and the total flux Compton reflected at the disc surface. Different grids of this model are now available for public use as XSPEC table models111From http://pitto.mib.infn.it/ haardt/ATABLES.
It is important to point out that no links between the Comptonized spectrum and the soft UV disc emission are imposed a priori. The model simply adjusts its parameters to fit the data. It is only a posteriori that the resulting best fit values can be interpreted in a physically motivated scenario. More specifically, the code gives the ratio between an arbitrarily normalized input cooling flux, , and the total emitted Compton spectrum, . That ratio can then be related to a specific geometry of the system, e.g. a homogeneous plane parallel disc-corona system in radiative equilibrium as in Haardt & Maraschi (haa91 (1991)), in which case it must be . This balance is imposed by the feed-back of the corona on the disc and viceversa in the absence of a dissipation mechanism intrinsic to the disc and is independent on the heating rate, provided it heats the electrons in the corona. A doubling of the heating rate doubles and but does not change their ratio. If , a photon starved configuration is required for instance a spherical corona. In the most general case, is a fraction of the observed UV flux . In fact, the condition is strictly valid only if all UV photons cross (and hence cool) the corona. In general . Thus, once the best fit parameters are obtained, one should seek for a self-consistent (in terms of physics and geometry) configuration of the disc+corona system.
AC2 also does not treat the ionization and thermal balance of the cold phase at all. This has certainly some impact on the broad band spectral shape expected from such a model as shown by Malzac et al. (mal03 (2003)), leading, for instance, to higher corona temperature and harder spectra in comparison to the “blackbody + neutral reflection” approximation used here. We believe however that these effects have no strong influence on the spectral variability behaviors studied in this paper.
We have also the possibility of using a semi-spherical geometry for the corona. We have checked however that the results presented below do not significantly change in comparison to the slab configuration (the main change being the larger value of the optical depth for a given slope of the X-ray power law). We thus restrict our analysis to the slab geometry.
We used the uvred model for the reddening, fixing the extinction to the best fit value of Kriss et al. (kri00 (2000)) i.e. . We fixed the column density to the galactic one i.e. cm-2. For the neutral iron line, we simply used a gaussian (zgauss model of xspec), fixing the gaussian energy and width to 6.4 keV and 0.01 keV respectively. The gaussian normalization was let free to vary. Finally we assume a relative normalization of 1 between the IUE and XTE data (we have checked that normalizations of 0.9 or 1.1 do not significantly change the results).
3 Simultaneous IUE and XTE fits
3.1 Fit results

We have reported in Table 1 the best fit values of the different
model parameters, i.e. , , and , for 29 daily
segments fitting simultaneously the IUE and XTE data. We do not include
the first segment obtained at the beginning of the campaign,
JD-24400245.104, since no IUE data were available. We have also reported
in the table
the UV (at 1315 Å) and X-ray (in the 2-10 keV range) fluxes, and the
values.
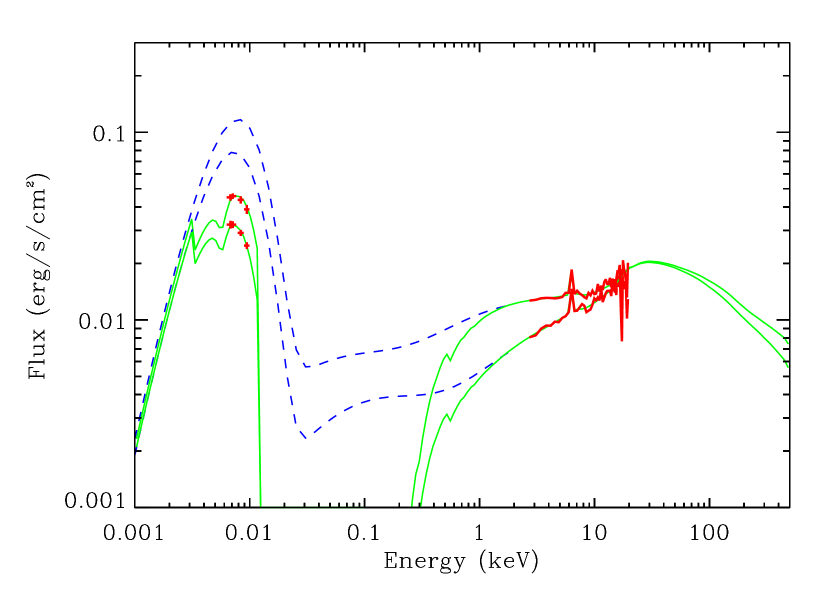
We have plotted in Fig. 1 the data and the corresponding
best fit models for two different states of NGC 7469 (a soft one
corresponding to segment 2 and a hard one corresponding to segment 9).
| Day | |||||||
|---|---|---|---|---|---|---|---|
| (TDJ+24400000) | (keV) | (eV) | () | () | (46 dof) | ||
| 246.177 | 286 | 0.067 | 2.0 | 1.0 | 3.44 | 4.90 | 50.0 |
| 247.247 | 317 | 0.051 | 2.1 | 1.0 | 2.87 | 5.09 | 49.3 |
| 248.316 | 327 | 0.058 | 2.1 | 0.9 | 3.69 | 4.76 | 62.4 |
| 249.386 | 317 | 0.062 | 2.0 | 0.8 | 3.79 | 4.63 | 67.6 |
| 250.456 | 342 | 0.058 | 1.9 | 0.6 | 3.89 | 4.15 | 34.5 |
| 251.579 | 363 | 0.051 | 1.9 | 1.1 | 3.38 | 3.74 | 65.3 |
| 252.631 | 347 | 0.054 | 1.9 | 1.3 | 3.16 | 3.63 | 41.3 |
| 253.676 | 419 | 0.038 | 1.9 | 1.3 | 2.53 | 3.17 | 50.4 |
| 254.714 | 342 | 0.057 | 1.9 | 0.9 | 3.15 | 3.40 | 45.0 |
| 255.777 | 322 | 0.055 | 2.0 | 1.5 | 2.80 | 3.90 | 62.0 |
| 256.811 | 337 | 0.050 | 2.0 | 1.9 | 2.75 | 3.78 | 45.2 |
| 257.840 | 342 | 0.048 | 2.0 | 1.8 | 2.74 | 4.00 | 43.9 |
| 258.865 | 322 | 0.050 | 2.1 | 1.8 | 2.53 | 4.40 | 49.9 |
| 259.914 | 281 | 0.063 | 2.1 | 2.0 | 2.86 | 4.64 | 43.4 |
| 260.914 | 322 | 0.049 | 2.1 | 1.7 | 2.60 | 4.65 | 56.6 |
| 261.918 | 312 | 0.053 | 2.1 | 1.5 | 2.82 | 4.85 | 42.8 |
| 262.882 | 286 | 0.064 | 2.1 | 1.3 | 3.36 | 5.14 | 56.3 |
| 263.883 | 286 | 0.065 | 2.0 | 1.4 | 3.28 | 5.04 | 55.8 |
| 264.917 | 307 | 0.060 | 2.0 | 0.8 | 3.51 | 5.09 | 40.6 |
| 265.953 | 296 | 0.067 | 2.1 | 1.2 | 3.90 | 4.95 | 64.9 |
| 267.019 | 327 | 0.062 | 2.1 | 0.8 | 4.02 | 4.50 | 61.8 |
| 268.084 | 301 | 0.072 | 1.9 | 1.1 | 3.92 | 3.99 | 53.8 |
| 269.155 | 358 | 0.058 | 1.8 | 0.5 | 3.83 | 3.53 | 58.4 |
| 270.222 | 347 | 0.056 | 2.0 | 1.1 | 3.31 | 3.52 | 43.8 |
| 271.282 | 383 | 0.050 | 1.8 | 0.7 | 3.38 | 3.32 | 58.0 |
| 272.361 | 373 | 0.047 | 2.0 | 1.5 | 2.71 | 3.24 | 59.8 |
| 273.417 | 322 | 0.057 | 1.9 | 1.9 | 2.66 | 3.25 | 62.5 |
| 274.488 | 312 | 0.065 | 2.2 | 1.3 | 3.21 | 3.71 | 41.4 |
| 275.547 | 266 | 0.079 | 2.0 | 1.4 | 3.22 | 4.21 | 61.7 |
We obtained acceptable fits for each segment and the total =
1528 for 1334 dof. The use of the IUE and XTE data provide relatively
good constraints on the different parameters of the model. Indeed, the UV
data allow to constrain well . Moreover, in Comptonization
models, and for a given geometry, the ratio between the UV bump maximum
and the X-ray “plateau” (i.e. the X-ray flux near 0.1 keV) is
mainly controlled by the corona optical depth. Combined with the X-ray
slope in the 2-10 keV range it then permits relatively good determination
of and and thus of the X-ray continuum up to the hard
X-ray/soft -ray band. Consequently, the reflection component is
also well constrained even if the XTE data permit precise spectral study
only below 20 keV.
3.2 Light curves of fit parameters
We have plotted the light curves of the different model parameters on the bottom part of Fig. 2, as well as the total (above 0.1 keV) X-ray flux predicted by the AC2 code. We have also plotted the 2-10 keV X-ray and UV (at 1315 Å) light curves and the photon index one, obtained by N00, on the top of the figure.
We have tested the significance of the variability of each parameter. Fitting the different light curves with a constant gives a , for 29 dof, of 57.6, 54.9, 8.3 and 128.5 for , , and , respectively. Except , the other parameters are thus clearly variable (significant at 99% confidence).
A more sensitive way to detect parameters variations is the use of the F-test. For that purpose, we fit again the data but fixing each of the parameters (, , and ) to its weighted average value (i.e. 322 keV, 0.054, 2 eV and 1.1 respectively). By comparing the total of these fits to the when all parameters were free, we derived F-values of 4.3, 3.9, 1.2 and 4.9 for 29 additional parameters. Again, it implies highly significant changes in , and (99%) but no significant changes for . The black body temperature is thus consistent with a constant and we choose to fix it, in the following, to the mean value of 2 eV.
We finally remark that the total X-ray flux (above 0.1 keV) predicted by our model also varies similarly to the observed 2-10 keV flux.
3.3 Correlations
| R | F (2-10) | F1315 | Fline | |||
|---|---|---|---|---|---|---|
| … | -0.65 | -0.26 | -0.15 | -0.73 | -0.03 | |
| -0.79 | … | -0.30 | 0.67 | 0.37 | 0.23 | |
| R | -0.22 | -0.21 | … | -0.79 | -0.05 | -0.31 |
| F (2-10) | -0.20 | 0.59 | -0.79 | … | 0.35 | 0.40 |
| F1315 | -0.67 | 0.35 | -0.07 | 0.30 | … | -0.05 |
| Fline | -0.16 | 0.33 | -0.34 | 0.43 | 0.04 | … |
We have reported in Table 2 the results of the linear (Pearson) and rank (Spearman) correlation tests between the different model parameters, assuming no time lags.
The X-ray flux is apparently correlated, with significances 99%, with the coronal optical depth and anti-correlated with . This anticorrelation was not observed by N00. We also found a correlation between the X-ray and line fluxes but not as strong as N00. Concerning the UV flux, it appears strongly anti-correlated with the coronal temperature . Finally, we found a strong anti-correlation between and . We have plotted the most significant correlations in Figs. 3 and 4 i.e and versus , versus , and versus .
As already remarked by N00, the cross correlation of light curves that have a “red noise” character (i.e. where the variability power scales as ), can produce artificially high correlation coefficients values (Welsh wel99 (1999); Maoz et al. mao00 (2000)). We have thus tested the significance of our results by simulating a number of X-ray and UV light curves with “red noise” power spectra. We adopt a value of of 1.3 and 1.9 for the power law index of the X-ray and UV power-density spectra respectively (cf. N98 and N00).
In 200 trials of 29 points, we never obtained Spearman or Pearson correlation coefficients as high as that observed in the real data. We thus conclude that the correlations shown in bold in Table 2 are unlikely to arise by chance. We discuss these different correlations in the following.
3.3.1 versus
The coronal temperature appears strongly anticorrelated with the UV flux ( mimics very well the total UV flux variations predicted by our model and in the following we will now only use the term instead of ). We found a rank Spearman coefficient of 0.73 while the highest coefficient obtained with our simulations, using 200 trials, was 0.5 (0.6 for 400 trials). This anti-correlation clearly corresponds to the vs. correlation found by N00.
These authors interpret this correlation as a strong support for Comptonization models where any ”primary” increase of the UV seed photons (not accompanied by an increase of the coronal heating rate) is generally expected to produce an increase of the cooling of the corona and thus a steepening of the spectrum and a decreasing of the corona temperature. We will see in the following that, in the context of coupled disc-corona models where the UV arises from reprocessing, a geometrical and/or energetic change of the disc-corona configuration is required.
3.3.2 versus
We find a strong correlation between the coronal optical depth and the X-ray emission. As already noted in Sect. 2.2, in the code we used there is no link imposed a priori between and the total X-ray flux and consequently between and . Such correlation is not simply explained in the Comptonization model framework and may reflect a process of different nature.
For instance, we expect that part of the X-ray flux produced by the corona illuminates the surrounding cold thick material, seed of soft photons. It is also possible that the hot corona is produced by e.g. evaporation of part of this cold matter or by magnetic buoyancy inside the cold matter (Meyer & Meyer-Hofmeister mey94 (1994); Meyer et al. mey00 (2000); Liu et al. liu02 (2002); Merloni & Fabian mer02 (2002); Merloni mer03 (2003)). Then variations of the X-ray flux may likely modify the properties of the upper layers of the accretion disc, and thus influence the corona formation. For instance, thermal instabilities are known to exist in illuminated plasma (Różańska & Czerny roz96 (1996); Nayakshin, Kazanas & Kallman nay00 (2000)), and the degree of ionization and temperature of the disc surface may rapidly increase in response to an increase of the illuminating flux. It may then favor the evaporation of part of the disc matter, increasing consequently the corona optical depth (but see Sect. 4.3).
3.3.3 vs


We have reported on Fig. 4 the coronal optical depth
versus the coronal temperature deduced from our fits. A
strong anti-correlation is clearly visible. Such anti-correlation is
indeed expected in the case of a corona-disc configuration in radiative
equilibrium. It depends however on the real geometry of the system
(Haardt & Maraschi, haa93b (1993); Stern et al. ste95 (1995); Malzac et
al. mal01 (2001)). The relation expected in the case of a slab corona
above a passive disc has been overplotted in solid line in Fig.
4. The data seem to be in good agreement with the
theoretical predictions, even if they slightly stand above the solid
line and present some dispersion.
It is worth noting that in our fitting procedure, we have assumed that all the observed UV emission, whatever its origin, has crossed and cooled the corona. It is however possible that part of the disc emission does not interact with the corona, like in the case of a patchy or spherical corona. We have simulated such a configuration by adding a black body component to the model used to fit the data. Its temperature was fixed to 2 eV and its normalization was fixed so that the corresponding flux (at 1315Å) was half the observed mean UV flux. In this way, we impose that a fixed part of the UV emission does not cross and cool the corona. The corresponding values of and have been overplotted with triangles in Fig. 4. We omit the error bars for clarity. The triangles are clearly above the solid line, as expected for a more photon starved configuration. The total that we obtained with this model is 1592 still for 1334 dof, slightly larger than without the addition of a black body component, but statistically equivalent. A geometry more photon-starved than the simple slab corona is thus also in agreement with the observations.
It is worth noting that the addition of a constant black body component does not substantially modify the results presented above. In particular, we still found correlation coefficients of the same order of magnitude than those reported in Table 2.
3.3.4 , versus
We found only a weak correlation between the line flux and the X-ray flux (cf. NOO who found a stronger correlation) but we did find an anti-correlation, not noted by N00, between and .
It is known that the measurement of the reflection component depends on the assumed model for the continuum. For example, large differences are expected between a simple power law shape and a real Comptonization model (Petrucci et al. pet01b (2001)). It may then explain the difference between our results and those of N00. It does not explain however why is anticorrelated with the 2-10 keV flux. Moreover these results are relatively difficult to explain in the standard view since both the line and the reflection component are expected to arise from the same region and thus to vary in the same way.
It is possible that part of the reflection components is emitted close to the central region while the other part may be produced by a remote reflector (indeed the presence of a distant reflector may explain the - anticorrelation). In this case, and in the presence of flux and spectral variability, like for NGC 7469, the measurement of and may not be very reliable and meaningful (Malzac & Petrucci mal02 (2002)) especially with the limited band pass and spectral resolution of XTE and the increasing noise at high energy (near 20 keV). In agreement with N00, we thus believe that the derived values of and may not be truly representative of the strength and spectral shape of the real reflection components in NGC 7469. We will thus not discuss this parameter in the following.
4 Discussion
Important results have emerged from this analysis. Firstly, we
obtained very acceptable fits, from the UV to the X-ray range, of the
29 daily spectra of NGC 7469 using a realistic thermal Comptonization
model. This model is able to explain the spectral shape of the
different UV/X-ray daily spectra but also the UV and X-ray flux
variability. In agreement with the conclusion of N00 (see also Chiang
chi02 (2002)), the absence of a clear correlation between the UV and
X-ray fluxes, as reported by N98, was thus clearly misleading. It
simply results from the complex flux and spectral variability of this
source which may produce, when observed in narrow energy bands,
relatively unexpected behaviors. Berkley et al. (ber00 (2000)) have
failed to reproduce the UV and X-ray light curves of NGC 7469 using a
simple model where an X-ray point source illuminates an infinite
accretion disc. This model does not consider spectral changes at all
and thus cannot reflect the intrinsic spectral complexity of
comptonization models. We believe that this
is the main reason of the results they obtained.
We also note at this point that our best fit results reported in Table
1 are quantitatively different from those obtained by Chiang
(chi02 (2002)) fitting the same data. We also believe that the
differences are certainly due to the approximate model used by this
author to mimic thermal Comptonization spectra. For example, for corona
optical depth as small as the ones he found (cf. his Fig. 5), a thermal
Comptonization spectrum is formed of well separated bumps of different
scattering orders and a simple cut-off power law is a really poor
approximation.
Secondly, we found very interesting correlations between the UV/X-ray fluxes and the model parameters, the most important one being the anticorrelation between the UV flux and the corona temperature. It is the equivalent of the - correlation found by N00, fitting the data with a simple cut-off power law model. This anticorrelation can be simply explained in the framework of thermal Comptonization models. Indeed, the increase of the UV soft photons flux, if ”primary”, generally means an increase of the coronal cooling. This then produces a decrease of the corona temperature and a softening of the spectrum as observed.
However, important results stem from this interpretation. First, the decrease of the corona temperature due to the increase of the coronal cooling is completely true in the case of a pair-free corona. Indeed, for a pair-dominated corona, the increase of the cooling would correspond to an increase of the corona temperature rather than a decrease (Ghisellini & Haardt, ghi94 (1994)). As discussed in Sect. 4.4, there are actually strong indications supporting the presence of a pair-free corona in NGC 7469, thus justifying the above interpretation.
More importantly, we note that the - anticorrelation cannot be reconciled with a fixed disc-corona configuration in radiative balance. As explained in Sect. 2.2, such configuration corresponds to a fixed ratio . But there is a priori no link between and the corona parameters like its temperature or optical depth. and have only to adjust themselves in order to insure a constant heating/cooling ratio (cf. Sect. 2.2). There is thus no reason for and/or to change, whatever the value of .
As discussed in the following sections, the - anticorrelation necessarily suggests a change of the geometry of the disc-corona configuration.
4.1 UV emission dominated by reprocessing
In the Comptonization code we used, there is no constraint, a
priori, on the origin of the UV emission. It may be dominated by the
intrinsic disc emission, by the reprocessed one, or both may be of the
same order. A check can be made a posteriori by comparing the
- values with the theoretical expectations as we have done in
Sect. 3.3.3 and Fig. 4. If the intrinsic disc
emission were dominant, the corona should be overcooled in comparison to
a corona above a passive disc, and the - values should be in
the lower right part of Fig. 4, below the
solid line, which is not what we obtain.
Another way to see this is to compare the X-ray flux expected to be reprocessed by the disc, , and the UV flux which crosses and effectively cools the corona . The former is simply the difference between the flux emitted by the corona backward toward the disc and the flux Compton reflected by the disc. For the latter, and in the case of a slab corona completely covering the disc, is equal to the total disc emission (this does not correspond to the observed UV emission, since part of the disc emission is comptonized in the corona). Both and are natural outputs of the Comptonization model used to fit the data. We have plotted in Fig. 5, the corresponding ratio . This ratio appears to be generally larger than 1. It is also variable between 1 and 1.8 and this point is discussed in the next section. If some part of the UV emission crossing the corona was intrinsic to the disc we would expect this ratio to be smaller than 1 which is not the case.
These results thus suggest that, in the case of NGC 7469, the intrinsic disc emission is negligible in comparison to the reprocessed one. This conclusion is in complete agreement with that of N00. It also agrees with the observed delays, increasing with wavelength, observed between different UV bands and interpreted as the different light travel time between the illuminating X-ray source and the disc reprocessing regions (Wanders et al. wan97 (1997); Kriss et al. kri00 (2000)).
Still concerning Fig. 5, we note that, starting from the epoch (segm n. 15) where the ratio is nearly 1, as expected for the slab configuration, this ratio reaches its maxima in near correspondence with the maxima of the X-ray light curve (near minima for the UV fluxes). One can thus interpret the ”oscillation” as a change in geometry whereby the fraction of reprocessed photons which re-enter and cool the corona varies.

4.2 Corona geometry variations as the origin of the observed variability
Simulations of Malzac & Jourdain (mal01 (2001)) show that the time scale for a disc-corona system to reach radiative equilibrium, after rapid radiative perturbation in one of the two phases, is of the order of a few corona light crossing times i.e. well smaller than a day. We can thus (reasonably) assume that each of the 29 daily average spectra and fluxes of the observation of NGC 7469 correspond to a disc-corona system where hot and cold phases are in radiative balance.
We have also shown in the previous section that the disc emission is
apparently dominated by the X-ray reprocessing. In this case, a fixed
disc-corona configuration in radiative equilibrium should correspond to
a constant / ratio (cf. Sect. 2.2) contrary to
what we observe in Fig. 5. We are thus bring to the
conclusion that the disc-corona geometry necessarily varies during
the total observation, producing the observed spectral and flux
variability.
It is not clear how the geometry really varies especially since we have no real constraint on the geometry itself. However, the fact that the X-ray emission is apparently the primary source of radiation (the UV being only produced by reprocessing), but also of variability (the total X-ray flux, above 0.1 keV, is indeed predicted to vary along the observation, cf. Fig. 2), naturally suggests that the change of the disc-corona geometry is actually a change of the corona geometry: the larger/smaller the corona, the stronger/weaker the X-ray emission.
We then propose the following scenario. Suppose that the origin of the day time scale variability is indeed a change of the global corona geometry. Suppose for example that the corona, which covers initially a large part of the disc, then becomes more patchy. Then the more patchy the corona, the hotter the mean corona temperature becomes and the harder the X-ray spectrum is. At the same time, the corona covering factor decreasing, the reprocessed flux, and consequently the global UV flux, decreases. This scenario thus simply explains the observed - anticorrelation.
Moreover we may naturally expect the optical depth of the corona to depend on the disc X-ray illumination (which mainly occurs below the corona blobs) as already suggested in Sect. 3.3.2. The variation of the X-ray flux impinging on the disc could likely modify the structure of the upper layers of the accretion disc and thus have an impact on the corona formation process. A strong X-ray emission would then help the evaporation of the accretion disc material thus increasing the corona optical depth. This could also explain the correlation between the corona optical depth and the X-ray flux.
We of course do not assert that this scenario is unique. We easily imagine that the change of the disc-corona geometry is certainly more complex, and may also imply changes of the disc itself. For instance, its inner region may become geometrically thick and optically thin, due to thermal instabilities (however see next section), or its inner radius may vary with time. Consequently, it would modify the UV flux entering the corona as well as the reflection component. The time scale for such processes to occur is however expected to be quite long in comparison to what we observe. Anyway, whatever the scenario proposed, the present analysis strongly requires a change of the disc-corona configuration. On the other hand, this appears to be a very plausible origin for the flux and spectral variability observed in NGC 7469.
4.3 A magnetically dominated corona in NGC 7469?
The mass of the black hole supposed to be present in the central region of NGC 7469 has been estimated in between and solar masses. Precise measurements, using different methods, favor a mass of about 7 (Collier et al. col98 (1998); Wandel et al. wan99 (1999)). This corresponds to an Eddington luminosity erg.s-1.
Our model gives us an estimate of the total luminosity emitted by the
central engine in NGC 7469, from the UV to the hard X-rays (if we admit
that the UV emission is in large part dominated by the reprocessing of
X-rays, it is equal to the downscattered emission emitted by the corona).
Assuming a distance of 70 Mpc (with =75 km.s-1.Mpc-1), the
luminosity varies between 2 and 3erg.s-1 i.e. of the
order of , meaning that the source accretes near its Eddington
rate.
It is known that for such high accretion rate, the inner part of the
accretion disc, which is dominated by the radiation pressure, is
viscously and thermally unstable (Lightman & Eardley lig74 (1974);
Shakura & Sunyaev sha76 (1976)) and may be subject to violent clumping
instabilities (Begelman beg01 (2001); Turner, Stone & Sano
tur02 (2002)). If the disc remains geometrically thin, most of the
disc mass form very dense clumps embedded in a tenuous hot corona. In
this case however, we expect very soft spectra unless the covering
fraction of the cold clouds is small which results however in low
reflection component (Malzac & Celotti mal02 (2002)). This does not
agree with the value of and observed in NGC 7469.
A possible solution could be the presence of disc-corona configurations
where a major fraction of the accretion power is released in the corona,
as those proposed by Svensson & Zdziarski (sve94 (1994)), Merloni &
Fabian (mer02 (2002)), and more recently by Merloni (mer03 (2003)). The
presence of such strong coronae indeed prevents the development of disc
instabilities. Merloni (mer03 (2003)) found for example new thermally
and viscously stable optically thick accretion disc solutions for
magnetized turbulent flows. Assuming that the magnetic field
amplification, via MRI, is balanced by buoyant escape, they obtained high
viscosity solutions where a large fraction of the accretion power is
liberated in the corona. These solutions appear only above a critical
accretion rate of the order of few tenths of the Eddington one, which
corresponds to the case of NGC 7469. The disc geometry being conserved
in these solutions, we also expect the reflection normalization to be of
the order of unity as observed.
If this interpretation is correct, it is likely that parts of the disc involved in the corona formation process are intrinsically weakly luminous, most of the energy being released mechanicly/magneticaly rather than radiatively. The observed UV flux would then be dominated by the reprocessed emission in agreement with the observations. Moreover, it could also explain why the black body temperature deduced from our fits is significantly smaller than the inner temperature (at 10 Schwarzschild radii) of 50 eV expected for a standard accretion disc (i.e. without corona) assuming the black hole mass and accretion rate estimates of Collier et al. (col98 (1998)) from optical data analysis.
4.4 A pair free corona
As already said, the code we use can give us the total X-ray and UV fluxes (and consequently the luminosity) emitted by the corona and the disc respectively. Now, from the variability in both bands, we can also estimate an upper limit of the size of the emitting regions, and , and consequently a lower limit on the compactnesses .
The X-rays appears to be variable on a timescale of less than 1 day (cf. N98, N00) thus where is a 1 light day length. On the other hand the UV vary on a longer time scale of the order of 5 days (Wanders et al. wan97 (1997); N98; N00; Collier & Peterson col01 (2001)). Then the compactness ratio . We have reported in Fig. 6, the values corresponding to our 29 daily observations. We obtained a slight correlation between these 2 variables. We also note that they only vary by about 50-60% during the campaign.

These results clearly disagree with the pair-dominated expectations computed by Ghisellini & Haardt (ghi94 (1994)). Their Fig. 2 shows that, if the corona of NGC 7469 is pair dominated, its compactness ratio has to decrease and its high compactness to increase (both by a factor 10) from the softest state (=2.01, =266 keV) to the hardest state (=1.7, =420 keV) reach by the source during the 29 days of observation. It would thus require very large changes (of factor 5 or more) of the characteristic size of both the UV and X-ray emitting regions for our results to be compatible with the pair dominated case. This is in contradiction with the observations. For instance, the observed UV flux varying by only 50-60% imposes the size of the emitting region (assumed to be optically thick) to vary at most by the same amount.
5 Conclusion
We have re-analyzed in this paper the simultaneous 30 days IUE/XTE
observation of NGC 7469 done in 1996, adopting and fitting directly to
the data a detailed model of the Comptonized spectrum. This contrasts with
previous spectral analysis where a simple power law was used to model the
continuum. We were thus able to fit simultaneously the data from the UV
to the hard X-ray band in a self-consistent way and to obtain direct
constraints on the physical parameters of the disc-corona system, like the
temperature and optical depth of the corona.
The model we use is able to explain well the spectral shape of the
different UV/X-ray spectra but also the UV and X-ray flux variability.
The absence of a clear correlation between the UV and X-ray fluxes, as
reported by N98, was thus clearly misleading. It underlines the
importance of the use of consistent models when fitting so intimately
related energy bands. In this context, the observed delay of 0.14
day between the UV and X-ray light curves of NGC 4051, as reported by
Mason et al. mas02 (2002), may not correspond to a response delay
between the UV and X-ray emitting region.
Concerning NGC 7469, the data appear to be roughly consistent with a slab
geometry where all the power is liberated inside the corona and where the
UV flux is dominated by the reprocessing. We note however that more
photon-starved geometries also agree with the data.
We also find very interesting correlations between the different model
parameters as the one between the corona temperature and the UV flux. If
it can be easily explained in the framework of thermal comptonization
model (an increase of the UV flux means an increase of the corona cooling
and thus, in general, a decrease of the corona temperature), it
necessarely implies slight changes of the disc-corona configuration
during the 29 days of observation. We thus propose a model where the main
origin of the variability is a change of the global corona geometry. The
more patchy it becomes, the hotter the temperature. In the same time, the
reprocessed flux, i.e. the UV emission, decreases.
We also found an interesting correlation between the corona optical depth
and the X-ray flux which is, a priori, not expected by Comptonization
models and may result from a different, but connected, process linked to
the corona formation.
We show that NGC 7469 is apparently accreting at nearly the Eddington
rate. The presence of a reflection component of the order of unity and of
a relatively hard spectrum suggest the presence of a magnetically
dominated disc-corona system in this source where most of the accreting
energy is released in the corona. Such solutions have recently been shown
to be thermally and viscously stable by Merloni (mer03 (2003)). We
finally found strong evidences in favor of a pair free
corona.
We note finally that the lack of precise data above 20 keV prevents however any detailed spectral study of the soft emission of the source. For instance, the study of the variability of the high energy cut-off, would have given additionnal constraints on the model parameters, especially on the corona temperature. Such very broad band study would require simultaneous observations with high energy satellites like XMM and INTEGRAL.
References
- (1) Barr, P. 1986, MNRAS, 223, 29P
- (2) Begelman, M. C. 2001, ApJ, 551, 897
- (3) Berkley, A. J., Kazanas, D., & Ozik, J. 2000, ApJ, 535, 712
- (4) Brandt, W. N., Fabian, A. C., Nandra, K., & Tsuruta, S. 1993, MNRAS, 265, 996
- (5) Chiang, J., Reynolds, C. S., Blaes, O. M., Nowak, M. A., Murray, N., Madejski, G., Marshall, H. L., & Magdziarz, P. 2000, ApJ, 528, 292
- (6) Chiang, J. 2002, ApJ, 572, 79
- (7) Clavel, J., et al. 1992, ApJ, 393, 113
- (8) Collier, S. J. et al. 1998, ApJ, 500, 162
- (9) Collier, S. & Peterson, B. M. 2001, ApJ, 555, 775
- (10) De Rosa, A., Fabian, A. C., & Piro, L. 2002, MNRAS, 334, L21
- (11) Done, C., Ghisellini, G., & Fabian, A. C. 1990, MNRAS, 245, 1
- (12) Edelson, R. A. et al. 1996, ApJ, 470, 364
- (13) Edelson, R. et al. 2000, ApJ, 534, 180
- (14) Edelson, R., Turner, T. J., Pounds, K., Vaughan, S., Markowitz, A., Marshall, H., Dobbie, P., & Warwick, R. 2002, ApJ, 568, 610
- (15) Ghisellini, G., Haardt, F. & Matt, G. 1994, ApJ, 429, L53
- (16) Gondek, D., Zdziarski, A. A., Johnson, W. N., George, I. M., McNaron-Brown, K., Magdziarz, P., Smith, D., & Gruber, D. E. 1996, MNRAS, 282, 646
- (17) Guainazzi, M., Matsuoka, M., Piro, L., Mihara, T., & Yamauchi, M. 1994, ApJ, 436, L35
- (18) Haardt, F. 1993, ApJ, 413, 680
- (19) Haardt, F. & Maraschi, L. 1991, ApJ, 380, L51
- (20) Haardt, F. & Maraschi, L. 1993, ApJ, 413, 507
- (21) Haardt, F. 1994, PhD dissertation, SISSA, Trieste (H94)
- (22) Haardt, F. , Maraschi, L. & Ghisellini, G. 1997, ApJ, 476, 620
- (23) Henri, G. & Pelletier, G. 1991, ApJ, 383, L7
- (24) Jourdain, E., et al. 1992, A&A, 256, L38
- (25) Kriss, G. A., Peterson, B. M., Crenshaw, D. M., & Zheng, W. 2000, ApJ, 535, 58
- (26) Lightman, A. P. & Eardley, D. M. 1974, ApJ, 187, L1
- (27) Lightman, A. P. & White, T. R. 1988, ApJ, 335, 57
- (28) Liu, B. F., Mineshige, S., & Shibata, K. 2002, ApJ, 572, L173
- (29) Maisack, M., et al. 1993, ApJ, 407, L61
- (30) Malkan, M. A. & Sargent, W. L. W. 1982, ApJ, 254, 22
- (31) Malzac, J. & Jourdain, E. 2000, A&A, 359, 843
- (32) Malzac, J., Beloborodov, A. M., & Poutanen, J. 2001, MNRAS, 326, 417
- (33) Malzac, J. & Petrucci, P. 2002, MNRAS, 336, 1209
- (34) Malzac, J., Mouchet, M., & Dumont, A. M. 2002, A&A submitted
- (35) Maoz, D., Edelson, R., & Nandra, K. 2000, AJ, 119, 119
- (36) Maoz, D., Markowitz, A., Edelson, R., & Nandra, K. 2002, AJ, 124, 1988
- (37) Marshall, H. L. et al. 1997, ApJ, 479, 222
- (38) Mason, K. O. et al. 2002, ApJ, 580, L117
- (39) Matt G., 2001, in “X-Ray Astronomy, Stellar Endpoints, AGN, and the Diffuse X-ray Background, Bologna, Italy 1999”, Eds N.E. White, G. Malaguti, G.G.C. Palumbo, AIP conference proceedings 599, 209, (astro-ph/0007105)
- (40) Merloni A. MNRAS, 341, 1051
- (41) Merloni, A. & Fabian, A. C. 2002, MNRAS, 332, 165
- (42) Meyer, F. & Meyer-Hofmeister, E. 1994, A&A, 288, 175
- (43) Meyer, F., Liu, B. F., & Meyer-Hofmeister, E. 2000, A&A, 361, 175
- (44) Nandra, K., Clavel, J., Edelson, R. A., George, I. M., Malkan, M. A., Mushotzky, R. F., Peterson, B. M., & Turner, T. J. 1998, ApJ, 505, 594 (N98)
- (45) Nandra, K., Le, T., George, I. M., Edelson, R. A., Mushotzky, R. F., Peterson, B. M., & Turner, T. J. 2000, ApJ, 544, 734 (N00)
- (46) Nandra, K. & Papadakis, I. E. 2001, ApJ, 554, 710
- (47) Nayakshin, S., Kazanas, D., & Kallman, T. R. 2000, ApJ, 537, 833
- (48) Papadakis, I. E., Nandra, K., & Kazanas, D. 2001, ApJ, 554, L133
- (49) Perola, G. C., Matt, G., Cappi, M., Fiore, F., Guainazzi, M., Maraschi, L., Petrucci, P. O., & Piro, L. 2002, A&A, 389, 802
- (50) Petrucci, P. O. et al. 2000, ApJ, 540, 131
- (51) Petrucci, P. O., Henri, G., & Pelletier, G. 2001, A&A, 374, 719
- (52) Petrucci, P. O. et al. 2001, ApJ, 556, 716
- (53) Różańska, A. & Czerny, B. 1996, Acta Astronomica, v.46, pp.233-252, (1996)., 46, 233
- (54) Różańska, A. & Czerny, B. 2000, A&A, 360, 1170
- (55) Shakura, N. I. & Suniaev, R. A. 1976, MNRAS, 175, 613
- (56) Shemmer, O. et al. 2001, ApJ, 561, 162
- (57) Shields, G. A. 1978, Nature, 272, 706
- (58) Stern, B. E., Poutanen, J. , Svensson, R. , Sikora, M. & Begelman, M. C. 1995, ApJ, 449, L13
- (59) Svensson, R. 1996, A&AS, 120, C475
- (60) Svensson, R. & Zdziarski, A. A. 1994, ApJ, 436, 599
- (61) Turner, N. J., Stone, J. M., & Sano, T. 2002, ApJ, 566, 148
- (62) Turner, T. J., Weaver, K. A., Mushotzky, R. F., Holt, S. S., & Madejski, G. M. 1991, ApJ, 381, 85
- (63) Turner, T. J., George, I. M., & Mushotzky, R. F. 1993, ApJ, 412, 72
- (64) Uttley, P., McHardy, I. M., Papadakis, I. E., Cagnoni, I., & Fruscione, A. 2000, MNRAS, 312, 880
- (65) S. Vaughan, A. C. Fabian & K. Nandra 2003, MNRASin press (astro-ph/0211421)
- (66) Wandel, A., Peterson, B. M., & Malkan, M. A. 1999, ApJ, 526, 579
- (67) Wanders, I. et al. 1997, ApJS, 113, 69
- (68) Welsh, W. F. 1999, PASP, 111, 1347
- (69) White, T. R., Lightman, A. P. & Zdiziarski, A. A. 1988, ApJ, 331, 939
- (70) Zdziarski, A. A., Zycki, P. T., & Krolik, J. H. 1993, ApJ, 414, L81
- (71) Zdziarski, A. A. & Grandi, P. 2001, ApJ, 551, 186