Probing the Low Mass Stellar End of the Chamaeleontis Cluster
Abstract
We have identified three faint new members of the Chamaeleontis cluster. Spectral types of the new members are estimated to be M5 based on their TiO band strengths and broadband colors. With an age of Myr for the cluster, masses of these new members are estimated to be M⊙. All three display strong Li 6708 Å absorption and H emission features including one with H emission equivalent width Å along with HeI 6678 & 7605 Å emission features that are characteristics of classical T Tauri stars.
1 Introduction
Recently, a compact open cluster was found only 97 pc from Earth deep in the southern hemisphere (Mamajek et al., 1999, 2000). Compared to other known stellar groups, Chamaeleontis is quite unique in many aspects. Within pc of Earth, stellar groups with a similar number of constituents (i.e., few tens of members) ranging in age from to Myr (TW Hydrae Association, the Pictoris moving group, the Tucana/Horologium Association, and Ursa Majoris group) are much more diffuse than Cha. The Cha cluster of 15 known members (Mamajek et al., 1999; Lawson et al., 2002) is compact (diameter pc) and very young (age Myr) which are great advantages in thorough identification of its members. Despite a sensitive search for members in the central diameter of the cluster (ROSAT High Resolution Imager field of view, see Mamajek et al. 1999), currently known cluster membership is heavily weighted toward high mass stars (Mamajek et al., 1999, 2000; Lawson et al., 2002). This skewed mass function may be interpreted either as dynamical scattering of low mass stars to the outskirts of the cluster or suppressed low mass star formation.
Therefore, we initiated a photometric/spectroscopic search for “missing” low mass members of Cha over a wide area (diameter pc) using 2MASS and USNO-B1 (Monet et al., 2003) all-sky survey data.
2 Target selection and Observation
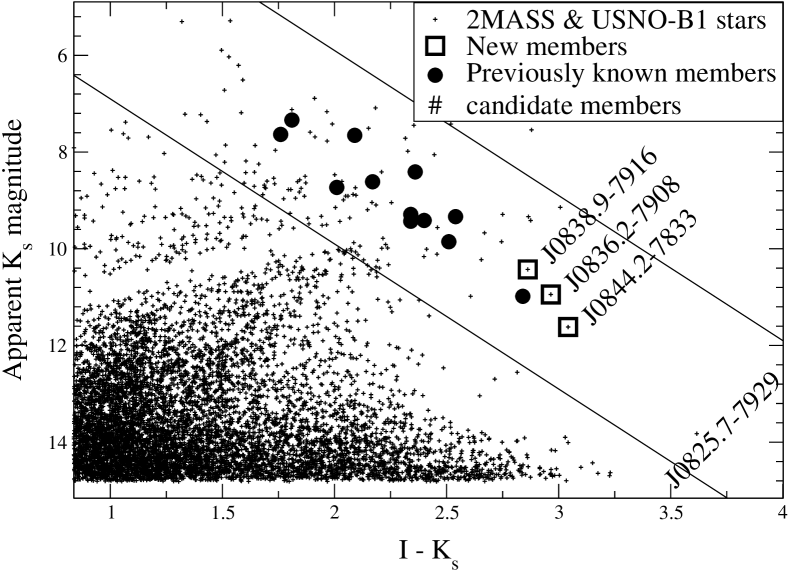
Since colors do not effectively differentiate among stars of early to mid-M spectral types, to identify potential members of the cluster, we first constructed an versus color magnitude diagram using 2MASS (for magnitude) and USNO-B1 (for magnitudes) catalog data (Figure 1). Because of the small proper motions of cluster members ( mas/yr) and the small baseline between the 2MASS images and USNO-B1 plate epochs ( years), we matched 2MASS and USNO-B1 sources only when offsets between the catalog positions were . The cross correlation was performed within one degree radius of Cha (J2000, , ). USNO photographic data have large photometric uncertainty of up to 0.5 mag, but because of the long baseline afforded by the color, one can use this color reliably even with occasional color uncertainty of up to 0.5 mag.
All previously known cluster members are well separated from the vast majority of background stars especially in the M spectral type region (). This is because of the proximity and extreme youth of the cluster. Almost all background stars appear fainter than the cluster members as one would expect (Figure 1). For clarity and to better define the locus of the cluster members, we used I band data from Lawson et al. (2001) instead of the USNO-B1 I magnitudes for the already known members.
The apparent avoided region ( mag width in ) around of Figure 1 is due to an incorrect photometric calibration of USNO-B1 catalog -band magnitudes. Photographic plates covering the Cha region are “uncalibratable”; their intrinsic variation is many magnitudes and their non-linearity is terrible even by photographic standards (D. Monet 2003, private communication). When compared to DENIS I measurements for common stars in the region, we found that bright stars (above the apparent gap) are systematically brighter by 0.25 mag whereas fainter stars are systematically fainter by 0.25 mag than their DENIS I magnitudes. However, this systematic error does not affect our study because our search region on Figure 1 was chosen sufficiently large (4 mag width in for a given color) so that all cluster members whose I measurements suffered by this systematic error should still be selected.
Occasionally, foreground dwarfs and background giants appear near the cluster members and we could identify most such bright contaminants from their spectral types (from SIMBAD), Hipparcos distance, proper motions, and brightness.
In this study we focused mainly on late-type members of the cluster for the following reasons. First, they are better distinguished from non-members due to the paucity of such red, bright contaminants (see Figure 1). Secondly, if dynamical segregation took place in the cluster, low mass members would be expected to be found on the outskirts of the cluster. Four candidates that lie near the extrapolated cluster isochrone are selected (Figure 1).
To check the reliability of selecting candidate members based on location on the color magnitude diagram, we took a spectrum of candidate cluster member J with the Low-Dispersion Survey Spectrograph (LDSS-2) at the Magellan Clay 6.5 m telescope at Las Campanas Observatory on UT date 2003-03-28. Although the spectral resolution of LDSS-2 was too low to check for the presence of a Li 6708 Å absorption feature, the spectrum showed prominent Hydrogen Balmer series emission lines which indicated likely cluster membership for this star. Encouraged by the J observation, we observed all four candidate members with the Royal Greenwich Observatory (RGO) Spectrograph and 1200R grating at the AAT 3.9 m telescope on UT date 2003-05-10. RGO spectra were reduced following standard procedure (bias subtraction, flat fielding, etc.) using IRAF tasks. Telluric and instrumental response features were removed by using a spectrum of smooth spectrum standard star, HD 84903.
To check if there exist any previously unidentified K/early-M type () cluster members, we selected 15 target stars within a degree radius of Cha that meet the following criteria: (1) locations on CMD lie between mag of the locus of known members, (2) proper motions from Tycho-2 or USNO-B1 similar to those of known cluster members ( and ), (3) I magnitudes from USNO-B1 smaller than 13.0 to ensure high S/N data from the SSO 2.3 m telescope. (4) locations on a versus color-color diagram are within mag of the locus of known members. These selected stars were observed during UT date 2003-07-11 through 07-13 with the double beam grating spectrograph (DBS) of the Australian National University’s 2.3 m telescope. DBS data were reduced in a similar fashion as described in Song, Bessell, & Zuckerman (2002). Positions and USNO-I magnitudes of these 15 stars are given in Table 2.
3 Results and Discussion
| Candidate No. | J | J | J | J |
| RA (J2000) | ||||
| DEC (J2000) | ||||
| EW(H) [Å] | absorption | |||
| EW(Li 6708) [mÅ] | 500 | 470 | 480 | — |
| TiO5 | 0.29 | 0.27 | 0.33 | – |
| 2.86 | 2.96 | 3.04 | 3.62 | |
| Spectral Type | M5 | M5.5 | M4.5/M5.5 | – |
| Membership | Likely | Likely | Likely | No |
| J also shows HeI 6678 (EW=1.8 Å) and 7605 (EW=0.9 Å). | ||||
| Negative EW indicates an emission line | ||||
RGO spectra of candidate members J, J, & J all showed prominent H emission features and strong Li 6708 Å line absorption (Figure 2) which implies true membership. The two leftmost emission features (6300 & 6363 Å) are Oxygen I air-glows due to insufficient telluric features removal (confirmed by looking at the sky region of the raw spectra). The proper motion of J from USNO-B1 catalog (, mas/yr) also supports its true membership when compared to the mean proper motions of known cluster members (, mas/yr). Based on the TiO5 band strength around 7100 Å (Reid et al., 1995) and 2MASS measurements, we estimate spectral types M5 of the three stars marking these stars as the lowest mass ( based on Myr pre-main sequence model of Baraffe et al. 1998) known members of the cluster. Details are summarized in Table 1.

J turned out to be a close visual binary with separation and we took spectra of both stars by putting them on the slit simultaneously. The fainter star was a late-type star and the brighter one was a background hot star. For the fainter star of the J visual binary, even with the accumulated integration time of one hour, the signal-to-noise ratio of the reduced spectrum was too low () to draw any firm conclusions. However, from the raw data, we see a hint of an H line in absorption. Were J a true member, its spectral type would be M7/8 and we would expect to see a prominent H emission feature. Thus, we believe the candidate J is a non-member.
Because of the 2MASS sensitivity limit ), we would not be able to find any later M or L-type members even if they exist. A deep near infrared photometric measurement can allow one to search for L-type cluster members. If found, late-M/early-L members will be brown dwarfs and late L members will be high mass planets.
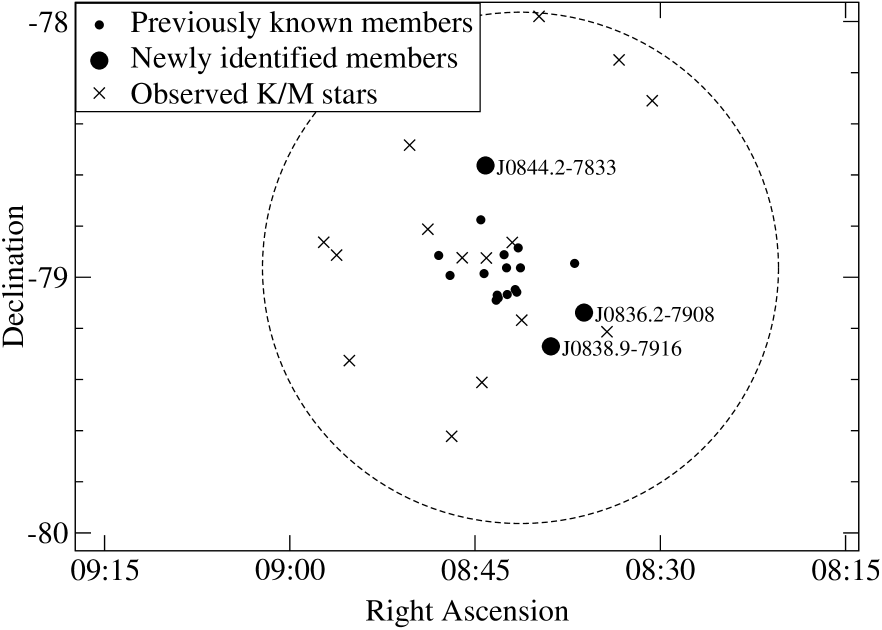
The fact that none of the 15 K/early-M candidate members turned out to be a member is significant. Considering the selection criteria of those 15 candidates, we expected at least a fair fraction of the candidates to be real members. In addition to these 15 stars, we observed seven stars satisfying the same set of selection criteria but slightly outside of the one degree radius search region. However, none of them turned out to be a member. While three lowest mass members are found at the outskirt of the cluster, the fact that no K/early-M members have yet been found in the outer region of the cluster indicates that a strong mass segregation may have occurred already in this very young cluster (Figure 3). A more thorough survey of cluster members using better photometric data (i.e., full DENIS survey data; currently available April 2003 released data cover 40 % of the 1 degree radius region around Cha.) accompanied by rigorous spectroscopic observation may help to test the mass segregation of this cluster more thoroughly. Allegedly, JHK colors from 2MASS survey do not effectively differentiate K/early-M stars thus cluster candidate member selection based only on 2MASS data is not useful.
| RA | DEC | I | RA | DEC | I |
|---|---|---|---|---|---|
| 08:30:39.17 | -78:18:35.0 | 12.60 | 08:33:20.24 | -78:09:00.1 | 9.37 |
| 08:34:19.11 | -79:12:47.3 | 6.82 | 08:39:49.04 | -77:58:46.6 | 9.72 |
| 08:41:13.27 | -79:10:04.4 | 9.13 | 08:41:59.27 | -78:51:50.4 | 12.56 |
| 08:44:05.06 | -78:55:28.9 | 8.63 | 08:44:26.87 | -79:24:40.8 | 9.51 |
| 08:46:02.37 | -78:55:26.2 | 10.97 | 08:46:53.58 | -79:37:19.1 | 10.27 |
| 08:48:49.17 | -78:48:43.5 | 12.22 | 08:50:17.67 | -78:28:59.7 | 8.23 |
| 08:54:23.64 | -79:46:28.4 | 9.09 | 08:55:10.63 | -79:19:33.7 | 8.93 |
| 08:56:12.55 | -78:54:48.2 | 9.41 |
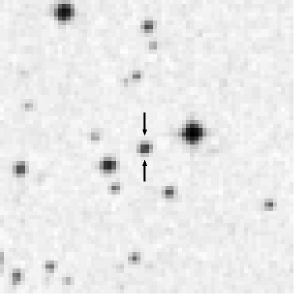
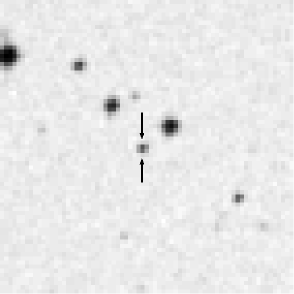
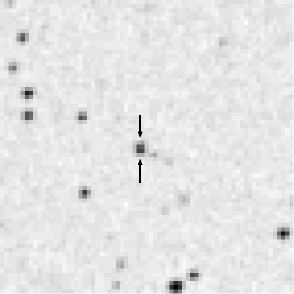
Finder charts of the three identified new members are provided in Figure 4.
Since high spectral resolution spectra are not available for Cha members, the velocity dispersion of the cluster has not been measured yet; hence we do not know if it is gravitationally bound or not. However, compared to the more dispersed but similar age stellar groups, the TW Hyadrae association ( Myr) and Pictoris moving group ( Myr), the Cha cluster is quite compact suggesting a gravitationally bound system.
References
- Baraffe et al. (1998) Baraffe, I., Chabrier, G., Allard, F., & Hauschildt, P. H. 1998, A&A, 337, 403
- Lawson et al. (2001) Lawson, W. A., Crause, L. A., Mamajek, E. E., & Feigelson, E. D. 2001, MNRAS, 321, 57
- Lawson et al. (2002) — 2002, MNRAS, 329, L29
- Mamajek et al. (1999) Mamajek, E. E., Lawson, W. A., & Feigelson, E. D. 1999, ApJ, 516, L77
- Mamajek et al. (2000) — 2000, ApJ, 544, 356
- Monet et al. (2003) Monet, D. G., et al. 2003, AJ, 125, 984
- Reid et al. (1995) Reid, I. N., Hawley, S. L., & Gizis, J. E. 1995, AJ, 110, 1838
- Song, Bessell, & Zuckerman (2002) Song, I., Bessell, M. S., & Zuckerman, B. 2002, ApJ, 581, L43