Extended Red Emission: Photoluminescence by Interstellar Nanoparticles
Abstract
Interstellar dust in nebulae and in the diffuse interstellar medium of galaxies contains a component which responds to illumination by ultraviolet photons with efficient luminescence in the 500 nm to 1000 nm spectral range, known as Extended Red Emission (ERE). We review the techniques of detection and the observational characteristics of the ERE in a wide range of astrophysical environments. We then discuss results of the analysis of ERE observations, leading to a set of specific constraints that any proposal for the ERE carrier must confront. Finally, we review specific models that have been advanced over the past two decades to explain the ERE phenomenon. Despite promising progress on several fronts, no completely satisfactory model for the ERE carrier/process exists at this time.
Ritter Astrophysical Research Center, The University of Toledo, Toledo, OH 43606 USA
Ritter Astrophysical Research Center, The University of Toledo, Toledo, OH 43606, USA
1. Introduction
Our knowledge of the existence of interstellar dust, its spatial distribution, its chemical composition and size distribution, and its mass relative to the rest of the interstellar medium is almost exclusively based upon observations of the interactions of interstellar dust grains with radiation. The processes studied in the past included mainly interstellar extinction and polarization of starlight at optical, near-IR and ultraviolet wavelengths, followed by studies of dust emission over a wide range of wavelengths from the near-IR to the sub-mm and microwave region. In this paper we are reviewing efforts to study interstellar dust through the process of photoluminescence (PL), a process in which absorptions of photons at ultraviolet/optical wavelengths are followed by electronic transitions associated with the emission of longer-wavelength optical and near-IR photons.
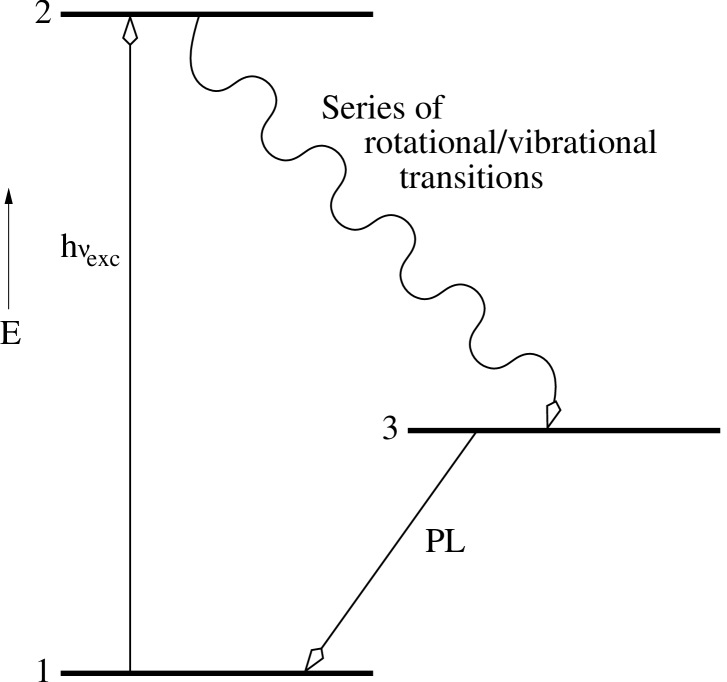
Figure 1 schematically illustrates the physics of a PL process. The ground state (1) represents the electronic ground state of a large molecule or molecular ion, or a state near the top of the valence band in a semiconductor particle. The excitation of the PL process under astrophysical conditions results from the absorption of a single UV/optical photon, leading to an electronic transition from state (1) to state (2). State (2) typically is a bound, high-lying vibrational/rotational level of the first or second electronically excited state of a molecule or molecular ion, or a high state in the conduction band of a semiconductor particle. The excited system relaxes through a series vibrational/rotational transitions until the electron finds itself in state (3), from where an optical electronic transition back to the ground state (1) is possible. In a polycyclic aromatic hydrocarbon (PAH) molecule, for example, state (3) can either be the lowest state in the singlet or triplet vibrational/rotational manifold of the first excited electronic level. The resulting emissions are referred to as fluorescence and phosphorescence, respectively. In a semiconductor particle, state (3) is a state near the lower edge of the conduction band, and the downward transition across the band-gap is simply referred to as photoluminescence. For a more complete review of PL in aromatic molecules and in semiconductor nanoparticles, the reader should consult the works of Birks (1970) and Yoffe (2001).
Different photoluminescing systems can be characterized by the energy difference between the exciting and PL photons, known as the Stokes shift, and by the quantum yield or photon conversion efficiency, measured by the number ratio of PL photons and exciting photons needed to produce the photoluminescence. Most luminescing systems exhibit quantum yields of substantially less than 100, but if the energy of the exciting photon is more than twice the energy of the PL photon, highly isolated molecules or molecular ions are expected to yield two (or more) PL photons per excitation, in a process known as Poincaré fluorescence (Leger et al. 1988). Thus, quantum yields well in excess of 100 may result in systems with large Stokes shifts under astrophysical conditions, although no specific identifications invoking this process have been made. In most natural systems, ionization or the creation of defects either quenches or shifts the PL into another spectral region, e.g. the near-IR, which permits relaxation to occur without the emission of an optical photon, thus reducing the quantum yield to well below .
Early suggestions that the high surface brightness of reflection nebulae in the visible might be due in part to fluorescence by the nebular dust grains were advanced by Struve & Swings (1948) and by Aller (1956). Indeed, many minerals now thought to be part of the composition of interstellar grains do fluoresce under illumination by ultraviolet light or following particle bombardment (Blair & Eddington 1968; Koike et al. 2002). However, a first sensitive search for the existence of such fluorescence in several bright reflection nebulae at wavelengths shortward of nm by Rush & Witt (1975) failed to reveal any detectable sign of dust fluorescence, leading to the conclusion that the nebular surface brightness at these wavelengths was a result of scattering with a relatively high grain albedo.
The advent of new, sensitive detectors in the red region of the visible spectrum in the 1970’s brought the first detections of PL, although they were not immediately recognized as such. The detection of the broad luminescence band in the spectrum of the Red Rectangle nebula (Cohen et al. 1975) was followed by its analysis in terms of unusual dust scattering properties by Greenstein & Oke (1977), although the possibility of fluorescence was mentioned. Subsequently, with much better observational data, Schmidt, Cohen, & Margon (1980) suggested a molecular-emission origin for the broad band of excess radiation in the Red Rectangle. The belief that this object was unique in exhibiting this excess radiation and the lack of a context of other sources showing the same phenomenon clearly contributed to our inability to recognize the true nature of the luminescence process in the Red Rectangle. For example, the spectrum of red excess radiation detected in the Galactic dark nebula Lynds 1780 by Mattila (1979) appeared sufficiently different that its connection to the Red Rectangle was not recognized until several years later (Chlewicki & Laureijs 1987).
A breakthrough occurred in this field with the realization that dust luminescence in the red part of the spectrum, extended red emission or ERE, as it soon became known, was a common feature in many dusty environments that are illuminated by ultraviolet photons. Detections of the ERE in reflection nebulae (Witt, Schild, & Kraiman 1984; Witt & Schild 1986, 1988) soon led to the observation of ERE in high-latitude cirrus clouds (Guhathakurta & Tyson 1989) and to the discovery of the presence of ERE in the continuum spectrum of planetary nebulae (Furton & Witt 1990, 1992). Perrin & Sivan (1992) started a series of discoveries of the ERE band in HII regions with the Orion nebula, followed by the 30 Doradus nebula in the LMC (Darbon, Perrin, & Sivan 1998) and the HII region Sh 152 (Darbon et al. 2000). The ERE detections in other external galaxies include the halo of M82 (Perrin, Darbon, & Sivan 1995) and the prominent dust lane in NGC 4826, the Evil Eye galaxy (Pierini et al. 2002). The detection and measurement of ERE in the diffuse interstellar medium of the Milky Way Galaxy over a wide range of Galactic latitudes by Gordon, Witt, & Friedmann (1998) represents a particular milestone for three reasons. It demonstrated that the ERE carrier is a component of interstellar dust on a Galaxy-wide scale; it represented detections of the ERE intensities at a level three orders of magnitude fainter than observed in the Red Rectangle; and finally, it permitted the first reliable estimate of the quantum yield or photon conversion efficiency of the ERE process.
In this paper we review first the observational techniques used for the detection, independent confirmation, and study of the ERE in different types of sources. We then discuss the analysis of the existing ERE data and the environments in which ERE is found, leading to a set of observational constraints that specific proposals for ERE carriers must confront. Finally, we will introduce specific models that have been advanced over the past two decades in order to explain the ERE phenomenon.
2. Observational Techniques for ERE Detection
Several factors contribute to the challenges one faces when attempting to observe ERE. First, ERE appears only in spatially extended objects, usually of relatively low surface brightness. Second, ERE is a very broad emission, spanning the wavelength range from 540 nm to at least 950 nm. And third, it always occurs in conjunction with other sources of diffuse emission or scattered light, most of which frequently are much brighter than the ERE. For example, in reflection nebulae the competing radiation is dust-scattered light; in HII regions dust-scattered light, atomic recombination continua as well as line emissions occur in the same spectral region, while in external galaxies integrated starlight is a contender as well. Attempts to measure ERE as part of the high-Galactic-latitude background require careful subtractions of atmospheric foregrounds such as airglow and atmospheric scattered light, zodiacal light, integrated starlight and diffuse Galactic light, before the ERE can be isolated. As a result, different observational techniques must be applied to different types of sources.
2.1. Color-Difference Technique
The color-difference technique is an efficient way to probe the presence of ERE in extended objects, provided that broadband colors of the source are readily predictable in the absence of ERE, and the presence of sufficient ERE changes these colors. This is the case when the competing radiation is dust-scattered starlight, e.g. in reflection nebulae (RN) or in the the diffuse Galactic background radiation. In an optically thin RN, the well-known wavelength dependence of the scattering optical depth leaves the nebular radiation bluer than that of the illuminating star throughout the optical spectrum. A simple approach for estimating the color difference between scattered and illuminating radiation is given by Witt (1985). If, therefore, the V-R color of a nebular region is redder than that of the star while the B-V color is bluer, this is a strong indication for the presence of ERE. This can be further confirmed by spectroscopic techniques (see below). Data suitable for the color-difference method can be obtained by broadband CCD imaging of individual RN (Witt & Schild 1985, 1986). In Figure 2, we show how the color differences C(V,R) and C(V,I) between nebular regions in the RN NGC 2023 and NGC 7023 and their respective illuminating stars are systematically too red for their corresponding C(B,V) color differences.
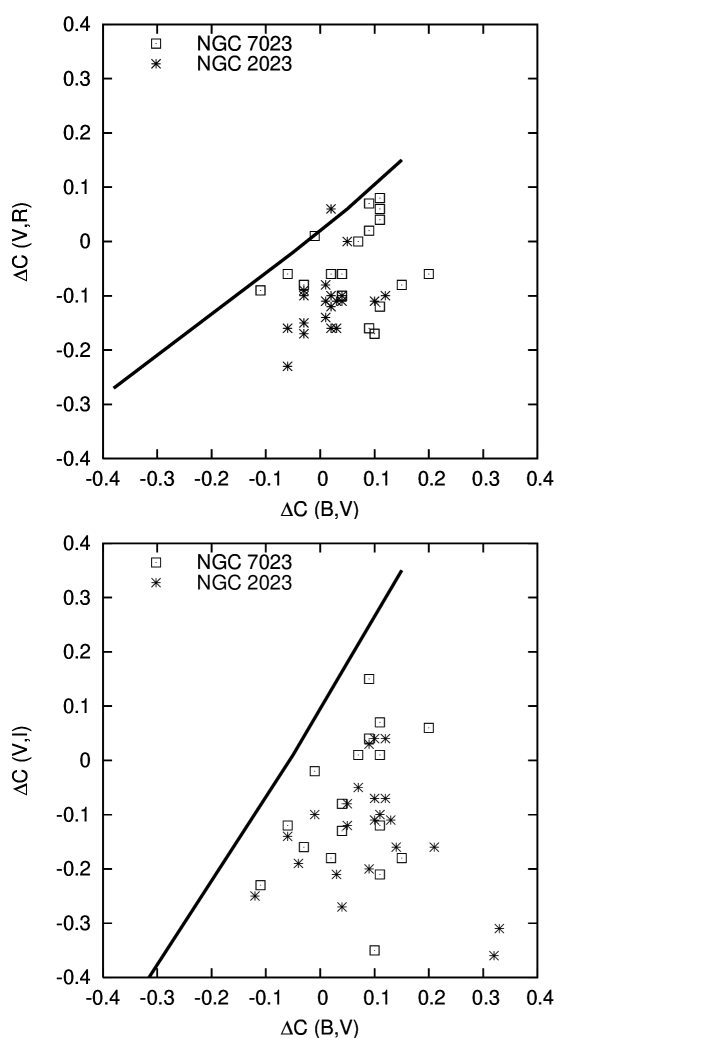
The degree to which each measured point falls below the expected relations between the color differences based on scattering alone (solid line) is a measure of the relative strength of the ERE. These observational data show that ERE is present to variable degrees in both the R- and I-bands in different locations within NGC 2023 and NGC 7023. Early detections of ERE in high-latitude cirrus clouds (Guhathakurta & Tyson 1989; Gordon et al. 1998) also relied upon the fact that the color of the cirrus is substantially redder than that of the illuminating starlight.
2.2. Long-Slit Spectroscopy
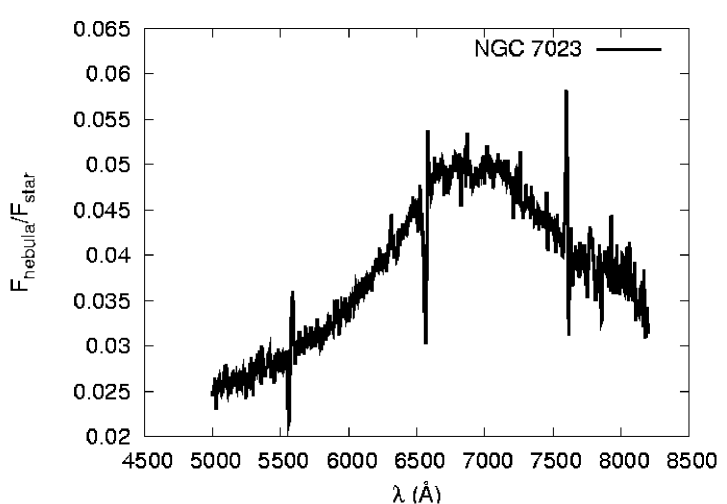
The spectroscopy of ERE in low-surface-brightness, extended sources is strongly affected by terrestrial airglow. Long-slit spectrographs provide the best approach to simultaneously record and subsequently subtract the foreground sky spectrum. Also, in sources whose spectrum is dominated by emission lines, e.g. HII regions and planetary nebulae, long-slit spectroscopy offers a possibility for studying the faint continuum, including the broad ERE band, between strong emission lines. The large extent of the ERE in wavelengths requires a combination of relatively low wavelength resolution and broad spectral coverage. If the resulting spectrum is a combination of scattered light and ERE, as for example in RN,the presence and relative strength of the ERE is revealed by dividing the nebular spectrum by the spectrum of the illuminating star, as shown in Figure 3.
The application of long-slit spectroscopy to the search for ERE in planetary nebulae is described by Furton & Witt (1990; 1992), and the use of the same method in HII regions was first demonstrated by Perrin & Sivan (1992) in the case of the Orion nebula. ERE spectra and band-integrated intensities as well as observed upper limits for a large sample of reflection nebulae based on long-slit spectroscopy have been reported by Witt & Boroson (1990).
2.3. Line-Depth Technique
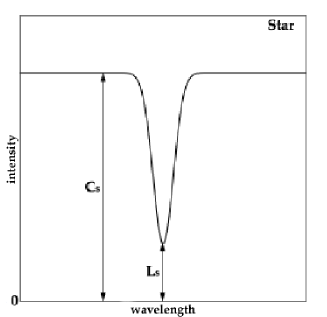
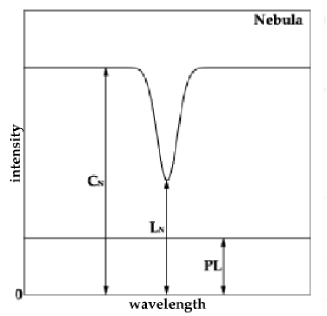
The presence of quasi-continuous luminescence may be difficult to discern, if it lacks a distinctive spectral feature, as is the case with the ERE band. In reflection nebulae, however, one can easily distinguish dust luminescence from scattered radiation by virtue of the fact that scattering faithfully reproduces relative line depths or equivalent widths of spectral lines present in the spectrum of the illuminating source. The presence of a certain fraction of luminescence at the positions of such lines is revealed by a proportional reduction in the relative line depths in the nebular spectrum compared to corresponding relative line depths in the illuminating star, as illustrated in Figure 4.
This method is particularly useful in the search for luminescence in the blue part of the spectrum, where strong hydrogen Balmer lines dominate the spectra of most reflection nebulae. It is important to note that the spectral resolution of both the stellar and the nebular spectrum must be identical to avoid a false-positive result. This method was first employed by Rush & Witt (1975), who used photographic spectroscopy and narrow-band photoelectric photometry to place useful upper limits on the contribution made by possible dust photoluminescence to the observed surface brightness of several reflection nebulae. A recent application of this technique by Vijh, Witt, & Gordon (2003) to sources with known strong ERE, now based on long-slit CCD spectroscopy, resulted in much tighter upper limits consistent with zero luminescence at wavelengths of H and shorter.
2.4. Unsharp Masking
The data shown in Figure 2 demonstrate the high degree of spatial variability of the ratio of ERE to scattered light within a single nebula. A closer examination of the ERE distribution in NGC 2023 and NGC 7023 reveals that the ERE intensity is strongly enhanced in narrow filamentary regions situated on the surfaces of dense molecular clumps facing the respective illumination source. These bright structures are a result of a favorable viewing geometry and a high local opacity for the stellar radiation responsible for ERE excitation, thus leading to exceptionally large column densities of ERE emitters, confined to a space with narrow lateral dimensions. The resulting ERE structures can be imaged with the unsharp masking technique (Malin & Zealy 1979), which permits the simultaneous display of sharp features ranging in intensity over four orders of magnitude. Witt & Malin (1989) applied this technique with good success to NGC 2023. The location, width and orientation of numerous ERE filaments was revealed, enabling subsequent studies of spatial correlations with filamentary emissions by fluorescent molecular hydrogen (Field et al. 1998) and by CN (Fuente, Martin-Pintado, & Gaume 1995).
2.5. Imaging Spectropolarimetry
Scattered light in reflection nebulae is substantially linearly polarized at optical and near-IR wavelengths, typically at the 20% to 30% level. Watkin, Gledhill, & Scarrott (1991), through the use of imaging polarimetry, discovered that localized ERE filaments in NGC 7023 are associated with a significant reduction of linear polarization in the R- and I-bands, consistent with a dilution of polarization through the presence of unpolarized emission with an intensity equal to that of the ERE, as determined by independent spectroscopic and photometric techniques. This demonstration that ERE is unpolarized makes attempts to explain the ERE in terms of scattering with unusual dust characteristics (e.g. Greenstein & Oke 1977) unsustainable. Rather, the ERE must be the result of an unpolarized emission process.
3. Analysis of Observational Data
The identification of the ERE carrier remains an outstanding challenge. None of the current ”unified” dust models (e.g. Draine 2004, Dwek et al. 2004, this volume), which attempt to satisfy several observational constraints simultaneously, predict the existence of the ERE, nor did they explain the phenomenon after its discovery. At this stage, an extensive set of observational data exist which any ERE carrier candidate must meet. Finding some material which produces approximately the correct spectrum of some ERE source is simply not sufficient. To this end, we now summarize the observational information about the ERE and try to deduce the resulting constraints for models.
3.1. ERE Environments
The ERE has been observed by one or more of the techniques described above in the following astrophysical environments:
-
1.
reflection nebulae
-
2.
HII regions
-
3.
dark nebulae (illuminated by the ISRF)
-
4.
high-latitude Galactic diffuse ISM and cirrus
-
5.
dusty ISM of external galaxies
-
6.
carbon-rich planetary nebulae
-
7.
the Red Rectangle, a peculiar proto-planetary nebula
These environments have two factors in common: they contain dust and they are illuminated by radiation fields containing UV photons. In terms of UV photon densities, these regions span a range of six orders of magnitude. In terms of dust, both well-mixed and processed interstellar dust mixtures (the first five cases) and regions where dust is produced in local outflows (the last two cases) are represented. The data suggest that once formed, the ERE carrier is fairly robust and can survive under a wide range of astrophysical conditions. The fact that evidence for ERE was found in carbon-rich planetary nebulae and not in oxygen-rich nebulae, despite comparable efforts on both types of objects (Furton & Witt 1992), suggests a carbonaceous nature for the carrier of the ERE. This argument has lost some of its power in light of the Infrared Space Observatory (ISO) observations of carbon-rich planetaries (Waters et al. 1998), which show the presence of strong spectral features of crystalline silicate features in the mid-IR spectral region. On the other hand, the non-detection of ERE in oxygen-rich planetaries does argue against an association of ERE with oxygen-rich materials. This conclusion is further supported by the fact that the most prominent ERE source with local dust production, the Red Rectangle nebula, is a carbon-rich environment. When considering ERE environments, it must be emphasized that the presence of dust and UV photons appears to be a necessary but not a sufficient condition. A number of bright reflection nebulae associated with B-stars as illuminating sources have not revealed any evidence of ERE presence (Witt & Boroson 1990), prominently among them the Merope nebula in the Pleiades, often presented as the prototype of reflection nebulae. Further evidence that scattering grains, i.e. the large-size end of the grain size distribution, are not directly involved with the production of ERE comes from the fact that the ERE morphology of the Red Rectangle nebula is distinctly different from its scattered-light morphology, and that in planetary nebulae, where ERE is detected, no trace of scattered light can be observed.
3.2. Excitation of ERE
The ERE is caused by PL. This is confirmed by the observation that the maximum ERE intensity in any given environment is closely correlated with the density of the local radiation field (Gordon et al. 1998), in particular the density of UV photons (Smith & Witt 2002). In dense, clumpy nebulae, it is always the side of clumps facing the closest source of UV photon that exhibit the highest ERE intensity (Witt & Malin 1989). These facts leave little doubt that ERE is powered by the absorption of photons. Several observational studies suggest strongly that these photons originate in the ultraviolet spectral region.
Darbon, Perrin, & Sivan (1999), summarizing all successes and failures of searches for ERE in reflection nebulae and HII regions, found that only environments illuminated by sources as hot as K and hotter exhibited ERE, while sources with illuminating stars with 7000 K did not, although ample dust was present in the nebulae with these cooler stars. The results of Darbon et al. (1999) are reproduced in Figure 5.
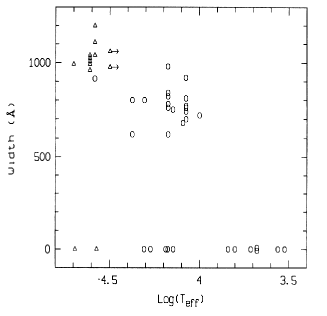
The results suggest that photons with energies E 7.25 eV, the approximate UV-cutoff of = 7000 K atmospheres, are required for ERE excitation. This conclusion is supported by observations of HD 44179, the exciting star of the Red Rectangle, with the International Ultraviolet Explorer (IUE) satellite by Sitko, Savage, & Meade (1981). The spectrum of HD 44179 displays a sharp absorption edge, beginning at 170 nm (7.25 eV) and extending to shorter wavelengths, totally inconsistent with normal dust extinction. In the light of the Darbon et al. (1999) result and given that the Red Rectangle is an exceptionally bright ERE source, it seems likely that this far-UV absorption at wavelengths 170 nm is caused by the ERE carrier particles. This result is further supported by Witt & Schild (1985), who examined the propagation of ERE-exciting photons through the well-studied reflection nebulae NGC 2023 and NGC 7023. They found the opacity for the exciting radiation in these two nebulae to be /E(B-V) = 9.16 and 7.15, respectively, with an uncertainty of 1.5, consistent with the dominant absorption of the ERE-exciting radiation occurring at wavelengths 150 nm. The determination of the spectral region in which the excitation of the ERE takes place is a crucial constraint for the identification of the ERE carrier.
3.3. Variability of the ERE Spectrum
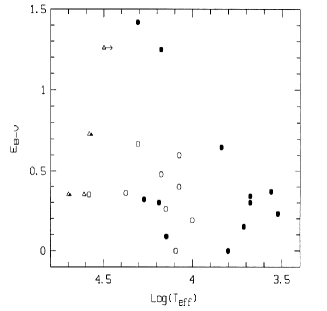
In general, interstellar absorption and emission features are characterized by the relative constancy of their central or peak wavelengths. By contrast, the large variability of the peak wavelength of the ERE band is a defining characteristic of the ERE process. The ERE peak wavelength varies from source to source and within a given source with distance from the illuminating star. In the majority of sources the ERE peak occurs in the 650 nm to 750 nm range, but extreme cases ranging from 610 nm to 950 nm have been found. A positive correlation between the width and the peak wavelength of the ERE band has been demonstrated by Darbon et al. (1999), with the FWHM of the band varying from 60 nm to 120 nm with corresponding changes in the peak position between 650 nm and 780 nm. Smith and Witt (2002) have shown that the ERE peak wavelength is well correlated with the local density of the far-ultraviolet radiation field, as shown in Figure 6.

They proposed that a photo-thermo-dissociation process, increasingly effective in high-radiation-density environments, selectively destroys the smaller ERE carrier particles, shifting the dominant size of the particles towards larger sizes. In this model, the emission wavelengths are related to the sizes of carrier particles through quantum confinement as found in luminescing nanoparticles (Ledoux et al. 2002) or large organic molecules (Platt 1956). It is clear from the observational evidence that models for the ERE carrier which do not account for the variability of the ERE spectrum are not sustainable.
3.4. Correlations/Anti-correlations with other Interstellar Features
The quest for the discovery of the ERE carrier could be narrowed substantially, if correlations with other interstellar features could be established, for which reasonable explanations have already been found. Unfortunately, no clear correlations have emerged so far.
Early ERE studies (Witt & Schild 1988; Witt & Malin 1989) suggested an association between ERE and H2 photo-dissociation fronts, which appeared to support models in which processing of amorphous carbon with atomic hydrogen led to PL by hydrogenated amorphous carbon dust (e.g. Duley & Williams 1990). Later studies of high-spatial-resolution H2-fluorescence maps of NGC 2023 by Field et al. (1994, 1998) revealed significant anti-correlations with ERE, with ERE being observed in the absence of H2-luminescence. Where there is a coincidence of ERE filaments and H2 filaments, it probably results from the fact that both luminescence mechanisms require similar far-ultraviolet radiation for their excitation and this radiation penetrates only a small physical distance into dense molecular clumps, thus producing an apparent strong spatial correlation between two physically unrelated processes.
An equally ubiquitous interstellar component, which is observed in virtually all the same environments in which ERE is seen, produces the near-IR aromatic hydrocarbon features in emission, also known as the unidentified infrared (UIR) bands (see articles by E. Peeters and T. Onaka in this volume). d’Hendecourt et al. (1986) and Leger, Boissel, & d’Hendecourt (1988) proposed that fluorescence by isolated polycyclic aromatic hydrocarbon (PAH) molecules and their ions could indeed be the source of the ERE. Following excitation by ultraviolet photons, these systems are expected to relax through a combination of electronic and vibrational transitions, which would suggest correlations between UIR band emission and the ERE. However, spatially resolved spectroscopy of ERE in the Red Rectangle (Schmidt & Witt 1991) and of the 3.3 m UIR band along an identical slit position (Kerr et al. 1999) produced a strong anti-correlation. If the same carrier is responsible for both emission processes, then this observation suggests that electronic and vibrational de-excitations must occur under mutually exclusive sets of physical conditions. This conclusion was further supported by recent observations of ERE and the UIR bands at 3.3 m and 6.2 m in the compact HII region Sh 152 by Darbon et al. (2000), who found the ERE to be associated with the ionized hydrogen emission while the UIR bands were seen predominantly in the outer, molecular regions. This agrees with earlier results by Perrin & Sivan (1992), who found no correlations between ERE and UIR bands in the Orion nebula.
Finally, several recent models for interstellar dust attribute the 2175 Å ultraviolet extinction feature either in part or totally to absorption by large PAH molecules or clusters. Some specifically predict that this absorption provides the energy source for the ERE (Seahra & Duley 1999; Duley & Seahra 1999) as well as the UIR band emission. It is interesting in this context that the nebula with the most intense ERE, the Red Rectangle, produces only a very weak 2175 Å feature (Sitko et al. 1981), while another nebula, IC 435, illuminated by a hotter star, exhibiting one of the strongest 2175 Å features observed (Witt, Bohlin, & Stecher 1984), shows no observable ERE (Witt & Boroson 1990). There is no observational support for the proposed connection between the 2175 Å band and ERE.
3.5. ERE Photon Conversion Efficiency
The detection of ERE in the high-latitude diffuse Galactic ISM (Guhathakurta & Tyson 1989; Gordon et al. 1998; Szomoru & Guhathakurta 1998) represents a major breakthrough: It allows the measurement of the ERE intensity under optically thin conditions for both the exciting and luminescence radiation in an environment where the total dust column density can be estimated, e.g. from HI column densities or from galaxy counts. Given a fair knowledge of the Galactic interstellar radiation field and its spectrum (Mathis, Mezger, & Panagia 1983), it then becomes possible to estimate a lower limit to the ERE quantum yield, assuming that all absorption at ultraviolet and optical wavelengths by dust along a given line of sight is due to the ERE carrier particles. Based on observations ranging over a wide range of Galactic latitudes, Gordon et al. (1998) found such a lower limit to the photon conversion efficiency of the process leading to ERE of (103), a value confirmed by Szomoru & Guhathakurta (1998). Normalized to the HI column density, this corresponds to an ERE intensity of (. As discussed in Section 3.2 above, only photons at wavelengths shortward of 170 nm are likely causes of ERE; in addition, there are other known absorbing interstellar dust components not likely associated with ERE. For these reasons, this lower limit on the ERE quantum yield is extremely conservative, and it is likely that the true intrinsic quantum yield of the ERE carriers is in the vicinity of 50 or even higher. Such high quantum yields are commonly found in fluorescence of organic molecules (Berlman 1965) and in PL by semiconductor nanoparticles (Ledoux et al. 2001). Even with quantum yields of the order of , the ERE carrier particles would need to absorb about of the UV/optical photons. The intensity of the ERE in the diffuse ISM requires that the ERE carrier is a dominant dust component causing far-UV interstellar absorption, because only a relatively small fraction of the absorbed photon energy re-emerges in the form of ERE photons. The ERE carriers must therefore consist of cosmically abundant refractory elements.
Smith & Witt (2002) extended the determination of ERE conversion efficiencies to numerous other sources, where the ERE has been observed superimposed on a scattered-light continuum. The latter, in conjunction with the spectrum of the illuminating star, was used to obtain an estimate of the local radiation density responsible for ERE excitation. The Smith & Witt results are reproduced in Figure 7, where the ERE quantum yield is plotted as a function of the local ultraviolet radiation density, expressed in units of the interstellar value.

All quantum yields are lower limits in the sense defined by Gordon et al. (1998). Consistent with the finding that the ratio of ERE-to-scattered light is highly variable within each nebula and from one nebula to another, the resulting efficiencies in RN vary over a range of at least two orders of magnitude. It is remarkable, however, that the ERE efficiency is lower in all sources when compared to that in the diffuse ISM and the high-latitude dark nebula L1780, both environments exposed to the low-density interstellar radiation field. Among reflection nebulae, there is a distinct downward trend to lower ERE efficiencies with increasing radiation field densities. The highest ERE quantum yields are found in environments with the lowest radiation densities, i.e. the diffuse ISM and surfaces of interstellar dark nebulae.
3.6. Photo-processing of the ERE Carrier
While the presence of UV photons is essential for stimulating the ERE process in the first place, the observations provide strong evidence that the interaction of the ERE carrier with radiation brings about changes in the carrier with observable consequences for the ERE spectrum and its relative intensity. We identify three phenomena which we attribute to photo-processing of the ERE carrier.
-
•
The peak wavelength of the ERE band shifts to longer wavelengths with increasing density of the local radiation field. (Figure 6)
-
•
In nebulae where ERE is observed, the photon conversion efficiency decreases strongly with increasing density of the UV radiation field. (Figure 7)
-
•
Nebulae in which ERE is not detectable (Witt & Boroson 1990, Table 3) tend to be diffuse, unclumped environments, in which dust has been fully exposed to ultraviolet radiation for a considerable time. In clumpy nebulae, such as NGC 2023 and NGC 7023, the ERE efficiency is highest on the faces of high-density clumps while decreasing to below detectability in low-density interclump regions.
This evidence suggests that exposure to increasingly intense radiation fields first modifies and then either de-activates or destroys the carrier of the ERE. The details of these processes will depend on the specific nature of the actual carrier particles, but any successful model must be able to account for this radiation-dependent behavior. Smith & Witt (2002) noted that photoionization will quench the PL of semiconductor nanoparticles such as oxygen-passivated silicon nanoparticles (SNPs). The balance between photoionization of the SNPs and their recombination with free electrons in any given environment would then determine the ERE efficiency. Furthermore, in increasingly dense and hard UV radiation fields the SNPs would be increasingly multiply ionized, making them subject to photo-fragmentation, a process affecting mainly the smallest among the carrier particles. The resulting change in the SNP size distribution would then lead to the observed shift of the ERE peak towards longer wavelengths.
4. Models for the ERE Carrier
None of the currently discussed ”unified” models for interstellar dust (Draine 2004; Dwek et al. 2004, this volume) specifically predict or account for the existence of ERE and its observed characteristics. Only one attempt (Zubko, Smith, & Witt 1999) has been made to simultaneously meet requirements posed by the wavelength dependence of extinction, abundance constraints, and ERE observations by including silicon nanoparticles as a small-grain component into standard dust models. Lack of adequate knowledge of the size-dependent dielectric functions of likely materials in the nanoparticle regime is currently preventing further work in this direction. Most of the past effort has been focused purely on identifying classes of carrier particles capable of producing the ERE. These have included carbon-based solids, such as hydrogenated amorphous carbon (HAC) (Duley 1985), quenched carbonaceous composite (QCC) (Sakata et al. 1992), coal (Papoular et al. 1996), and bacterial pigments (Hoyle & Wickramasinghe 1999), as well as large carbon-based molecules, such as PAHs (d’Hendecourt et al. 1986; Leger et al. 1988), (Webster 1993) and PAH-clusters (Seahra & Duley 1999). Lately, non-carbon bearing ERE candidates such as silicon nanoparticles (Witt et al. 1998; Ledoux et al. 1998) and silicates (Koike et al. 2002) have also received close attention. In order to judge the success or failure of these efforts, it is essential to summarize the observational constraints such proposals must meet.
4.1. Requirements
Here we summarize the conditions imposed by observations on the carrier particles of the ERE.
-
•
ERE is a PL process.
-
•
Carriers must consist of cosmically abundant refractory elements that are depleted from the gas phase in interstellar space and are capable of forming photoluminescent materials. Such elements include C, O, Si, Fe, and Mg.
-
•
Carrier particles must survive under a wide range of interstellar and circumstellar conditions and have a Galaxy-wide distribution.
-
•
Efficient excitation of the ERE process requires photons with energies in excess of 7.25 eV.
-
•
No PL is detectable in the 350 to 500 nm wavelength range under excitation by UV continuum radiation.
-
•
The PL occurs in a broad, unstructured band with a peak wavelength varying between 600 nm and 900 nm, within given sources and from source to source, in response to increasingly dense and hard illumination by UV photons.
-
•
The width and the peak wavelength of the ERE band are positively correlated.
-
•
Under conditions of low radiation density the ERE quantum yield is .
-
•
The ERE is unpolarized with an isotropic radiation pattern.
-
•
The ERE peak wavelength and quantum yield are strongly affected by the density and hardness of the local UV photon field.
-
•
The ERE is observed in the absence of scattering and appears therefore not associated with sub-micron-sized scattering grains.
-
•
The ERE appears to be uncorrelated with the strength of the interstellar 2175 Å extinction feature and the ubiquitous UIR emission bands.
-
•
The ERE carrier particles appear to originate in such dust-forming environments as the proto-planetary Red Rectangle nebula and in C-rich planetary nebulae.
4.2. Hydrogenated Amorphous Carbon
Hydrogenated amorphous carbon (HAC) is an organic refractory material consisting of a mixture of and coordinated hydrocarbons with a variable band-gap. The HAC ERE model attracted wide support early on, because not only did HAC exhibit PL in apparent agreement with observed ERE spectra (Witt & Schild 1988), it also appears to be an interstellar dust component required to explain the interstellar 3.4 m C-H stretch feature (Pendleton & Allamandola 2002; Furton, Laiho, & Witt 1999) and is widely employed as an integral component of models for interstellar dust. The early HAC PL spectra were obtained with exciting radiation near 500 nm wavelength and they displayed luminescence only in the red region with a spectrum similar to that of the ERE. Under UV illumination, however, the HAC PL spectrum extends well into the blue and near-UV, consistent with a band-gap of over 3 eV (Robertson 1996; Rusli, Robertson, & Amaratunga 1996). Under astrophysical illumination conditions with ample UV photons, HAC would therefore exhibit PL in the 400 nm to 500 nm spectral range, contrary to observation. The HAC band-gap can be narrowed by irradiation or annealing, bringing it closer to the observational constraints, but this also results in a dramatic decrease of the PL quantum yield by three or four orders of magnitude. As a result, HAC is not able to reproduce the spectral characteristics and the observed quantum yield of the ERE simultaneously, and the HAC ERE model is no longer considered viable.
4.3. PAH Molecules and Ions
Large PAH molecules and their ions are considered likely candidates for explaining the ubiquitous UIR emission bands in the ISM and in many of the nebular sources in which ERE is observed as well. Given that PAHs are also known to fluoresce efficiently (Berlman 1965), their role as a potential source of ERE was proposed early on (d’Hendecourt et al. 1986). Under collision-free conditions and with far-UV photons available for excitation, PAHs and their ions are even expected to yield several luminescence photons per single excitation, resulting in efficiencies of several 100 (Leger, et al. 1988). However, neutral PAHs luminesce predominantly in the UV/optical wavelength range (300 nm - 600 nm) (Birks 1973; Peaden et al. 1980), with similar efficiencies in the gas phase (Stockburger 1973; Sgro et al. 2001; Reyle & Brechignac 2000) as in solution (Berlman 1965). Studies of the charge state distribution of PAHs in different interstellar environments by Bakes & Tielens (1994) and Weingartner & Draine (2001) agree that a significant fraction of PAHs should still be neutral in radiation environments typical of reflection nebulae. A size distribution of PAH molecules would therefore reveal its presence by luminescing not only in the red ERE range but in the blue wavelength region as well. The absence of detectable PL at wavelengths 500 nm (Vijh et al. 2003) argues strongly against the existence of smaller PAH molecules (mass 500 amu) in these environments. Laboratory studies of the PL characteristics of larger PAH molecules, especially when excited by far-UV photons in a collision-free environment, are needed to evaluate the likelihood that PAH molecules are the origin of the ERE.
Relatively little is known about the fluorescence characteristics of PAH cations. The comparatively small energy difference ( 1 eV) between the electronic ground state, , and the first excited electronic state, , in most PAH ions (Leach 1987) causes their potential fluorescence to occur in the near-IR and not in the optical range (Crawford, Tielens, & Allamandola 1985). PAH cations are reported to absorb predominantly at energies 7.75 eV ( 160 nm) (Robinson et al. 1997), which results in an increased probability of internal conversion to highly excited vibrational levels of the electronic ground state D0, from where relaxation occurs essentially by emission of IR photons (Leach 1995). This suggests that quantum yields for fluorescence by PAH cations may be quite low.
The absence of consistent spatial correlations between ERE and UIR band emissions attributed to PAHs is not by itself conclusive evidence against the PAH origin of ERE, because PAHs in different size ranges, degrees of hydrogenation, and charge states, all of which are expected to be environment-dependent, could be responsible for UIR bands and ERE to a different extent (Duley 2001). However, so far there is little substantive support in favor of PAHs as likely candidates for ERE carriers.
4.4. PAH Clusters
Spectroscopic data on fluorescence by specific PAH molecules are limited to systems with atomic weight 500 amu or about 40 carbon atoms. Duley & Seahra (1998) suggested that interstellar PAHs exist as much larger molecules or in the form of stacks and aggregates of PAHs of up to 700 carbon atoms, which could be responsible for the interstellar 2175 Å absorption feature as well as the UIR band emissions. They also proposed (Seahra & Duley 1999) that these same PAH clusters will produce PL emission with a principal band centered at 700 nm, which would account for the ERE. This model suffers from several weaknesses. The model predicts two emission side bands, with peaks at 500 nm and 1000 nm wavelength, to be associated with the main ERE band. A search for these additional bands in two of the strongest ERE filaments in NGC 7023 by Gordon et al. (2000) failed to produce evidence for either one. The model predicts a remarkably constant peak wavelength for the main ERE band for a wide range of size distributions of PAH clusters, contrary to the observational evidence (Figure 6). Finally, the model predicts correlations between the strengths of the 2175 Å band and the ERE band, which is not supported by observations. The most attractive feature of this model is the efficient utilization of the same dust component to explain several interstellar phenomena, namely the 2175 Å band, ERE, UIR bands. It would be highly desirable to obtain laboratory data on PAH clusters which could support the multiple claims made for this model (Duley 2001).
4.5. Other Carbonaceous Carrier Models
The molecule exhibits a PL spectrum resembling that of the ERE in a few reflection nebulae, leading Webster (1993) to suggest as the source of ERE. However, sensitive searches for the presence of and in interstellar space and in NGC 7023 (Snow & Seab 1989; Moutou et al. 1999; Herbig 2000) failed to find observable traces of this species. Furthermore, the measured quantum yield of PL is only 8.5 (Kim et al. 1992), missing the ERE requirement by several orders of magnitude.
Discharges through gas mixtures containing hydrocarbons result in non-volatile carbonaceous residues with interesting PL characteristics. Wdowiak et al. (1989), using a gas mixture containing CO, , , , and Ar, with relative abundances approximating those believed to apply to the Red Rectangle, produced luminescing residues of high quantum yield. However, under UV illumination the PL spectrum consistently peaked at wavelengths 600 nm, with substantial parts of the luminescence spectrum extending through the 400 - 500 nm range. The spectral mismatch with the observations plus the presence of blue PL appear to rule out this particular candidate.
Quenched carbonaceous composite (QCC), a filmy residue produced through a microwave discharge in a low-density methane plasma by Sakata et al. (1992), was shown to be a more promising ERE carrier candidate. This material exhibits PL spectra with variable peak wavelengths spanning the 680 - 725 nm range, depending on the substrate temperature during deposition. Blue luminescence is absent in the presence of UV illumination, in agreement with observations. Mass spectroscopy of QCC (Sakata et al. 1983) indicates that QCC does not contain large PAH molecules but appears to consist of a random agglomeration of 1- to 4-ring PAHs, small aliphatic molecules and radicals. When dissolved in liquid freon, QCC exhibits blue luminescence, reminiscent of the fluorescence of small PAHs. A more complete characterization of QCC through additional laboratory work would clearly be desirable.
4.6. Silicon Nanoparticles
In recent years, silicon nanoparticles (SNPs) (Witt et al. 1998; Ledoux et al. 1998, 2000, 2001, 2002) have emerged as an interesting alternative to the carbonaceous ERE carrier candidates discussed above. The SNP model meets the observational constraints posed by ERE observations in respect to spectral variability and quantum yield better than most of the carbonaceous candidates. The photophysics of SNPs (Smith & Witt 2002) also appears to be consistent with the observed variations of ERE peak wavelength and ERE quantum yield with environmental conditions. The balance between photo-ionization and recombination with free electrons, combined with the fact that charged SNPs are much less likely to luminesce, explains the variation of the ERE quantum yield with UV-radiation density, while the expected photo fragmentation of multiply charged SNPs leads to the erosion of the SNP size distribution, starting with the smallest sizes, and a corresponding shift to much longer ERE peak wavelengths in astrophysical environments with the highest radiation densities. Studies of the optical characteristics of SNPs (Amans et al. 2003) show the absorption coefficient still rising at the wavelength of 200 nm, where current measurements stop. This is consistent with ERE excitation requirements, but measurements at shorter wavelengths are urgently needed.
The highly efficient PL exhibited by SNPs is the results of quantum confinement in nanocrystals and passivation of surface dangling bonds with atoms such as H, O, N, C, and Fe. Most existing laboratory studies have been done with O- and H-passivation, and it has been found that the surface composition affects the PL spectrum (Wolkin et al. 1999; Zhou, Brus, & Friesner 2003), in the sense that SNPs with H-passivation and diameters of 2.5 nm luminesce at blue and near-UV wavelengths, while O-passivated SNPs luminesce in the red only. This argues against H-passivated SNPs as ERE carriers, because blue PL is not observed under interstellar conditions. Also not observed is an interstellar absorption feature at 4.6 m, which would have resulting from the expected Si-H vibrational transition. For these reasons, Witt et al. (1998) suggested that interstellar SNPs would most likely be O-passivated. Once produced in a circumstellar outflow, SNPs with oxygen passivation would persist even in the ISM with abundant H-atoms, because the Si-O bond is energetically two to three times stronger than the Si-H bond. Such particles would contribute to the widely observed 9.7 m vibrational Si-O absorption band, generally referred to as the “silicate” feature. However, Li & Draine (2002) have pointed out that stochastically heated O-passivated SNPs would produce a 20 m emission band well in excess of currently established observational limits. This objection might be overcome, if SNPs with O-passivation were either attached to or embedded in larger grains. Experiments, in which SNPs were produced by ion implantation in solids with subsequent annealing, have demonstrated that SNPs preserve their luminescent characteristics even when embedded (e.g. Iwayama et al. 2002). Another way to overcome the objection by Li & Draine (2002) is to consider other forms of passivation. For example, recent laboratory work (Mavi et al. 2003) has shown that passivation with Fe-atoms yields even more persistent and efficient photoluminescence in SNPs than O-passivation. Among astrophysical environments in which Fe-passivated SNPs might form are S-stars (Ferrarotti & Gail 2002), which are characterized by an atmospheric abundance ratio C/O 1. That such environments are likely to contribute grains consisting of Si and Fe to the interstellar dust mixture is supported by the recent observation of a new 1.5 m dust emission feature, attributed to - particles (Gordon et al. 2000). Carbon should be able to provide passivation equally well, although experiments in this direction have yet to be done. The existence of Fe- or C-passivated SNPs could also overcome the observational constraint, which so far has restricted ERE detections to C-rich environments among planetary nebulae (Furton et al. 1992).
A critical observational test of the SNP hypothesis consists of successful searches for a SNP defect band observable near 1.15 m (Gordon et al. 2000). If additional detections of this near-IR band are made, one needs to test the correlation between the peak wavelength of the main SNP band and that of the near-IR band (Hill & Whaley 1996), which is well-established through laboratory experiments. An additional test is possible in the form of searches for enhanced emission from gas-phase [SiII] at 34.8 m in regions where SNPs are expected to be destroyed by photo-fragmentation, e.g. between photo-dissociation fronts and their illuminating sources (Fuente et al. 2000). The strong enhancement of such [SiII] emission in the central part on NGC 7023, a region where ERE is essentially absent, is consistent with photo-destruction of SNPs in this region. Photo-destruction of silicates would also lead to an increase in gas-phase SiII, which, however, should then be associated with corresponding increases in the abundances of gas-phase Fe and Mg.
In summary, the SNP model, while promising, also suffers from a number of loose ends. The study of the optical properties of SNPs must be pushed into the vacuum ultraviolet, the full range of possible passivation schemes must be explored, the process of SNP formation in stellar outflows must be examined, and the question of the long-term persistence of the PL of SNPs under astrophysical conditions over astronomical times scales must be investigated.
5. Conclusions
The ERE is a well-characterized property of dust existing in a wide range of astrophysical environments. The carrier of the ERE is a major component of interstellar dust: it intercepts 20 of the UV/optical photons in the diffuse ISM, if the intrinsic quantum yield is 50, and a still higher fraction of the UV/optical photons, if the yield is lower than 50.. Yet, no current comprehensive model for interstellar dust explicitly accounts for the existence of the ERE. The identification of the ERE carrier remains a challenge for laboratory astrophysics, dust theory, and astronomical observation.
Acknowledgments.
Past and current collaborators have contributed substantially to the our present understanding of this subject: Todd Boroson, Martin Cohen, Doug Furton, Karl Gordon, Daniele Pierini, Dmitri Ryutov, Jr., Rudy Schild, and Tracy Smith. We acknowledge their contributions with gratitude. We also thank Jean-Pierre Sivan for providing Figure 5 and Astronomy & Astrophysysics for permission to reproduce it. Finally, we acknowledge NASA Grant NAG5-9262 for financial support.
References
Aller, L., 1956, Gaseous Nebulae (Wiley, New York)
Amans, D., Callard, S., Gagnaire, A., Joseph, J., Ledoux, G, & Huisken, F. 2003, J. Appl. Phys., 93 (7), 4173
Bakes, E.L.O., & Tielens, A.G.G.M. 1994, ApJ, 427, 822
Berlman, I.B. 1965, Handbook of Fluorescence Spectra of Aromatic Molecules, (New York: Academic Press)
Birks, J.B. 1970, Photophysics of Aromatic Molecules (Wiley: London)
Birks, J.B. 1973, in Organic Molecular Photophysics, J.B. Birks ed., (Wiley, New York), Vol.1, p.1 - 55
Blair, I. M., & Eddington, J. A. 1968, Nature, 217, 157
Chlewicki, G., & Laureijs, R.J. 1987, in Polycyclic Aromatic Hydrocarbons and Astrophysics, A. Leger, L. d’Hendecourt, & N. Boccara, eds., (D. Reidel Publ. Comp., Dordrecht), 335
Cohen, M., et al. 1975, ApJ, 196, 179
Crawford, M.K., Tielens, A.G.G.M., & Allamandola, L.J. 1985, ApJ, 293, L45
Darbon, S., Perrin, J.-M., & Sivan, J.-P. 1998, A&A, 333, 264
Darbon, S., Perrin, J.-M., & Sivan, J.-P. 1999, A&A, 348, 990
Darbon, S., Zavagno, A., Perrin, J.-M., Savine, C., Ducci, V., & Sivan 2000, A&A, 364, 723
d’Hendecourt, L.B., Leger, A., Olofsson, G., &Schmidt, W. 1986, A&A, 170, 91
Duley, W.W. 1985, MNRAS, 215, 259
Duley, W.W. 2001, ApJ, 553, 575
Duley, W.W., & Seahra, S.S. 1998, ApJ, 507, 874
Duley, W.W. & Seahra, S.S. 1999, ApJ, 522, L129
Duley, W.W., Seahra, S., & Williams, D.A. 1997, ApJ, 482, 866
Duley, W.W., & Williams, D.A. 1990, MNRAS, 247, 647
Ferrarotti, A.S., & Gail, H.-P. 2002, A&A, 382, 256
Field, D., Gerin, M., Leach, S., Lemaire, J.L., Pineau Des Forets, G., Rosta, F., & Simons, D. 1994, A&A, 286, 909
Field, D., Lemaire, J.L., Pineau des Forets, G., Gerin, M., Leach, S., Rostas, F., & Rouan, D. 1998, A&A, 333, 280
Fuente, A., Martin-Pintado, J., & Gaume, R. 1995, ApJ, 442, L33
Fuente, A., Martin-Pintado, J., Rodriguez-Fernandez, N.J., Cernicharo, J., & Gerin, M. 2000, A&A, 354, 1053
Furton, D.G., Laiho, J.W., & Witt, A.N. 1999, ApJ, 526, 752
Furton, D.G., & Witt, A.N. 1990, ApJ, 364, L45
Furton, D.G., & Witt, A.N. 1992, ApJ, 386, 587
Furton, D.G., & Witt, A.N. 1993, ApJ, 415, L51
Gordon, K.D., Witt, A.N., & Friedmann, B.C. 1998, ApJ, 498, 522
Gordon, K.D., Witt, A.N., Rudy, R.J., Puetter, R.C., Lynch, D.K., Mazuk, S., Misselt, K.A., Clayton, G.C., & Smith, T.L. 2000, ApJ, 544, 859
Guhathakurta, P., & Tyson, J.A. 1989, ApJ, 346, 773
Greenstein, J.L., & Oke, J.B. 1977, PASP, 89, 131
Herbig, G.H. 2000, ApJ, 542, 334
Hill, , N.A., & Whaley, K.B. 1996, PRL, 76, 3039
Hoyle, F., & Wickramasinghe, N.C. 1999, Ap&SS. 268, 321
Iwayama, T.S., Hama, T., Hole, D.E., & Boyd, I.W. 2002, Surf. & Coatings Technology, 158-159, 712
Kerr, T.H., Hurst, M.E., Miles, J.R., & Sarre, P.J. 1999, MNRAS, 303, 446
Kim, D., Lee, M., Suh, Y.D., & Kim, S.K. 1992, J. Am. Chem. Soc., 114, 4429
Koike, C., Chihara, H., Koike, K., Nakagawa, M., Okada, M., Tsuchiyama, A., Aoki, M., Awata, T., & Atobe, K. 2002, Meteoritics & Planet. Sci., 37, 1591
Leach, S. 1987, in Polycyclic Aromatic Hydrocarbons and Astrophysics, eds: A. Leger, L. d’Hendecourt, & N. Boccara, Dordrecht: Reidel, 99
Leach, S. 1995, Planet. Space Sci., 10/11, 1153
Ledoux, G., Ehbrecht, M., Guillois, O., Huisken, F., Kohn, B., Laguna, M.A., Nenner, I., Paillard, V., Papoular, R., Porterat, D, & Reynaud, C. 1998, A&A, 333, L39
Ledoux, G., Gong, J., Huisken, F., Guillois, O., & Reynauld, C. 2002, Appl. Phys. Lett., 80 (25), 4834
Ledoux, G., Guillois, O., Huisken, F., Kohn, B., Porterat, D., & Reynaud, C. 2001, A&A, 377, 707
Ledoux, G., Guillois, O., Porterat, D., Reynaud, C., Huisken, F., Kohn, B., & Paillard, V. 2000, PRB, 62 (23), 15942
Leger, A, Boissel, P., & d’Hendecourt, L.1988, PRL, 60 (10), 921
Li, A., & Draine, B.T. 2002, ApJ, 564, 803
Malin, D.F., & Zealy, W.J. 1979, S&T, 57, 354
Mathis, J.S., Mezger, P.G., & Panagia, N. 1983, A&A, 128, 212
Mattila, K. 1979, A&A, 78, 253
Mavi, H.S.,Rasheed, B.G., Shukla, A.K., Soni, R.K., & Abbi, S.C. 2003, Mat. Sci. & Eng. B, 97, 239
Moutou, C., Sellgren, K., Verstraete, L., & Leger, A. A&A, 347, 1999
Perrin, J.-M., Darbon, S., & Sivan, J.-P. 1995, A&A, 304, L21
Perrin, J.-M., & Sivan, J.-P. 1992, A&A, 255, 271
Pierini, D., Majeed, A., Boroson, T.A., & Witt, A.N. 2002, ApJ, 569, 184
Papoular, R., Conard, J., Guillois, O., Nenner, I., Reynaud, C., & Rouzaud, J.-N. 1996, A&A, 315, 222
Peaden, P.A., Lee, M.L., Hirata, Y., & Novotny, M. 1980, Analyt. Chem. 52, 2268
Pendleton, Y.J., & Allamandola, L.J. 2002, ApJS, 138, 75
Platt, J.R. 1956, ApJ, 123, 486
Reyle, C., & Brechignac, P. 2000, Eur. Phys. J. D, 8, 205
Robertson, J. 1996, Phys. Rev. B., 53, 16302
Robinson, M.S., Beegle, L.W., & Wdowiak, T.J. 1997, ApJ, 474, 474
Rush, W., & Witt, A.N. 1975, AJ, 80, 31
Rusli, Robertson, J., & Amaratunga, G.A.J. 1996, J. Appl. Phys.., 80, 2998
Sakata, A., Wada, S., Narisawa, T, Asano, Y., Iijima, Y., Onaka, T., & Tokunaga, T. 1992, ApJ, 393, L83
Sakata, A., Wada, S., Okutsu, Y., Shintani, H., & Nakada, Y. 1983, Nature, 301, 493
Schmidt, G.D., & Witt, A.N. 1991, ApJ, 383, 698
Seahra, S.S., & Duley, W.W. 1999, ApJ, 520, 719
Sgro, L.A., Minutolo, P., Basile, G., & D’Alessio, A. 2001, Chemosphere, 42, 671
Sitko, M.L., Savage, B.D., & Meade, M.R. 1981, ApJ, 246, 161
Smith, T.L., & Witt, A.N. 2002, ApJ, 565, 304
Snow, T.P., & Seab, C.G. 1989, A&A, 213, 291
Stockburger, M. 1973, in Organic Molecular Photophysics, J.B. Birks, ed., (Wiley, New York), Vol. 1, p. 57 - 102
Struve, O., & Swings, P. 1948, PASP, 60, 61
Szomoru, A., & Guhathakurta, P. 1998, ApJ, 494, L93
Vijh, U.P., Witt, A.N., & Gordon, K.D. 2003, (in preparation)
Waters, L.B.F.M., et al. 1998, A&A, 331, L61
Watkin, S., Gledhill, T.M., & Scarrott, S.M. 1991, MNRAS, 252, 229
Wdowiak, T.J., Donn, B., Nuth, J.A., Chapelle, E., & Moore, M. 1989, ApJ, 336, 838
Webster, A. 1993, MNRAS, 264, L1
Weingartner, J.C., & Draine, B.T. 2001, ApJS, 134, 263
Witt, A.N. 1985, ApJ, 294, 216
Witt, A.N., Bohlin, R.C., & Stecher, T.P. 1984, ApJ, 279, 698
Witt, A.N., & Boroson, T.A, 1990, ApJ, 355, 182
Witt, A.N., Gordon, K.D., & Furton, D.G. 1998, ApJ, 501, L111
Witt, A.N., & Malin, D.F. 1989, ApJ, 347, L25
Witt, A.N., & Schild, R.E. 1985, ApJ, 294, 225
Witt, A.N., & Schild, R.E. 1986, ApJS, 62, 839
Witt, A.N., & Schild, R.E. 1988, ApJ, 325, 837
Witt, A.N., Schild, R.E., & Kraiman, J.B. 1984, ApJ, 281, 708
Wolkin, M.V., Jorne, J., Fauchet, P.M., Allan, G., & Delerue, C. 1999, PRL, 82, 197
Yoffee, A.D. 2001, Adv. in Phys., 50, 1
Zhou, Z., Brus, L., & Friesner, R. 2003, Nano Lett., 3, 163
Zubko, V.G., Smith, T.L., & Witt, A.N. 1999, ApJ, 511, L57