Radio and Far-Infrared Emission as Tracers of Star Formation and AGN in Nearby Cluster Galaxies
Abstract
We have studied the radio and far-infrared (FIR) emission from galaxies in the nearest clusters ( Mpc) with prominent X-ray emission to investigate the impact of the cluster environment on the star formation and AGN activity in the member galaxies. The X-ray selection criterion is adopted to focus on the most massive and dynamically relaxed clusters. A large majority of cluster galaxies show an excess in radio emission over that predicted from the radio-FIR correlation, the fraction of sources with radio excess increases toward cluster cores, and the radial gradient in the FIR/radio flux ratio is a result of radio enhancement. Of the radio-excess sources, are early-type galaxies and the same fraction host an AGN. The galaxy density drops by a factor of 10 from the composite cluster center out to Mpc, yet galaxies show no change in FIR properties over this region, and show no indication of mass segregation. We have examined in detail the physical mechanisms that might impact the FIR and radio emission of cluster galaxies. While collisional heating of dust may be important for galaxies in cluster centers, it appears to have a negligible effect on the observed FIR emission for our sample galaxies. The correlations between radio and FIR luminosity and radius could be explained by magnetic compression from thermal ICM pressure. We also find that simple delayed harassment cannot fully account for the observed radio, FIR, and mid-IR properties of cluster galaxies.
Subject headings:
galaxies: clusters: general — galaxies: clusters: individual (A262, AWM7, A426, A1060, A1367, Virgo, A1656) — galaxies: elliptical and lenticular, cD — galaxies: interactions — infrared: galaxies — radio continuum: galaxies1. Introduction
The radio and far-infrared (FIR) properties of local galaxies with a wide range in bolometric luminosity, from the faintest dwarf galaxies to ultraluminous infrared galaxies (ULIRGs), have been well documented. The overwhelming majority of these galaxies obey the linear correlation between radio and FIR luminosity which holds over 5 orders of magnitude in luminosity (Price & Duric 1992). The mechanisms for radio and FIR emission are thought to be well understood and both have been shown to be accurate tracers of recent star formation (see Yun, Reddy, & Condon 2001–hereafter YRC–and references therein). The small percentage of luminous galaxies which deviate from the FIR-radio relation in the local universe are thought to be powered by AGN (for those showing excess radio emission over that expected from the radio-FIR correlation and excess mid-IR emission) or are in a short-lived dust enshrouded AGN/starburst phase (for those showing excess FIR emission; YRC). Deviations from the correlation may also arise from environmental changes such as the presence of an intracluster medium (ICM). Studies have found notably lower FIR-radio flux ratios for cluster galaxies than expected from the FIR-radio relation in the field (see Miller & Owen 2001a), indicating some modification of the radio and/or FIR emission mechanisms in cluster galaxies.
Mechanisms that can only affect the observed FIR emission include collisional heating of dust grains by ICM electrons and ram pressure stripping of ISM. In the latter case, observations indicate that such stripping only strongly affects the outer HI disk of the galaxy, leaving the dense molecular gas and dust component intact (Kenney & Young 1986, Cayette et al. 1994). A consequence of the lower star formation rates observed in cluster galaxies (e.g, Gomez et al. 2002) is a corresponding reduction in both FIR and radio emission. Enhancement of radio continuum and FIR emission may result from tidally induced star formation. Mechanisms affecting the observed radio emission include an increase in the magnetic field strength via gas compression as galaxies move through the ICM (Gavazzi & Boselli 1999; Rengarajan, Karnik, & Iyengar 1997; Anderson & Owen 1995; Scodeggio & Gavazzi 1993), simple thermal compression of the magnetic field (e.g., Miller & Owen 2001a), and/or elevated AGN activity arising from frequent galaxy-galaxy collisions or galaxy harassment in the cluster environment (e.g., Moss & Whittle 1993; Lake, Katz, & Moore 1998). Studying radio and FIR emission should therefore be useful in examining these mechanisms.
Miller & Owen (2001a) conducted a study of the radio and FIR properties of a sample of 329 local Abell cluster galaxies. Optically-identified AGNs in their sample show greater radio-to-FIR flux ratios with more scatter than star forming galaxies and galaxies in cluster cores show enhanced radio emission. While unable to rule out ram pressure enhancement, they find that thermal compression of the magnetic field alone could produce the observed radio luminosity segregation.
Prior investigations into the effects of the ICM on galaxy properties have primarily selected clusters based on their optical properties that may not accurately reflect the state of the intracluster medium. For example, the Miller & Owen (2001b) cluster sample has 329 spectroscopically confirmed cluster galaxies, half of which reside in poor clusters where the environmental effects are not as pronounced as in rich clusters. We have adopted a different approach in selecting clusters based on the presence of X-ray emission. The most common explanation for this emission in clusters, first proposed by Felten et al. (1966), is that X-rays result from thermal bremsstrahlung from hot ( K), low density ( atoms cm-3) intracluster gas. The inclusion of X-ray luminous clusters in our sample (1) ensures that only massive, dynamically-relaxed clusters are chosen, and (2) is immune to the biases inherent in optically-selected surveys, such as sensitivity to morphological type, AGN fraction, and ages and masses of galaxies.
X-ray cluster and radio/FIR galaxy selection allows us to compile a homogeneous sample of cluster galaxies in order to address the key questions of this study: (1) does the rich cluster environment help or hinder star formation activity in cluster galaxies, and (2) how does the presence of an ICM affect the frequency of AGN sources? To aid in addressing these questions, we also examine the following: convolution due to projection effects (§3), clustering of early-type sources as predicted by the density-morphology relation (Dressler 1980; §6.1), and FIR emissivity as a function of mass (§6.2). All of these effects can influence the observed radio and FIR properties of cluster galaxies and must be carefully disentangled. To determine whether rich clusters preferentially affect low or high luminosity galaxies, we also examine the faint and bright end behavior of the cluster luminosity function (LF) and compare with that found in the field.
The organization of this paper is as follows. In §2, we present the criteria used to select clusters and individual galaxies. The effects of projection are quantified in §3. The radio-FIR relation and flux density ratio for cluster galaxies are discussed in §4. The effects of the ICM on the galaxy radio and IR luminosity functions are discussed in §5. The radio and FIR properties of the sample are interpreted in the context of the density-morphology relation, mass segregation, and various emission mechanisms in §6, including electron-dust collisional heating and ram-pressure and thermal magnetospheric compression. We also examine the mid-IR properties of the cluster sample to address the frequency of AGN sources in §6.
2. Sample Selection
2.1. Cluster Selection
The clusters used in this study were culled from the flux-limited sample of bright X-ray clusters compiled by Edge et al. (1990) using the following selection criteria. First, we chose only those clusters with , corresponding to the survey limit of the NRAO VLA Sky Survey (NVSS) from which radio data were obtained. Clusters near the galactic plane () were also excluded. Finally, a redshift cutoff of was applied ( Mpc for H km s-1 Mpc-1—this value of Ho is assumed throughout the paper), to ensure accurate NVSS and IRAS detections given the sensitivity and confusion limits of the two surveys. As an added advantage, we only select nearby, well-studied clusters, so that a case-by-case study of individual galaxies can be done. This selection process yielded clusters: A262, AWM7, A426 (Perseus), A1060 (Hydra), A1367, Virgo, and A1656 (Coma). The ACO (Abell, Corwin, & Olowin 1989) cluster richness among these clusters ranges from -1 to 2, but all have virial masses of M⊙ to M⊙ (David, Jones, & Forman 1996; Koranyi & Geller 2000; Ettori, Fabian, & White 1998; Tamura et al. 2000; Donnelly et al. 1998; Colless & Dunn 1996; Schindler, Binggeli, & Böhringer 1999) indicative of a well-defined potential. The central position, assumed redshift, and keV X-ray luminosity of each cluster are included in the data summarized in Table 1.
| aaSystemic cluster velocity from NED | bbVelocity dispersion () from Strubble & Rood (1999), Koranyi et al. (1998), and Fadda et al. (1996) | NCore | NRing | keV Lxdd kev luminosity from Edge et al. (1990) | ||||||
|---|---|---|---|---|---|---|---|---|---|---|
| Name | (J2000.0) | (J2000.0) | (km s-1) | (km s-1) | ClassccRichness class from Abell, Corwin, & Olowin (1989) | (Obs) | (Obs) | Nearly | Nlate | (h erg s-1) |
| A262 | 01 52 50.4 | 36 08 46 | 4887 | 588 | 0 | 6 | 7 | 5 | 8 | |
| AWM7 | 02 54 32.2 | 41 35 10 | 5168 | 680 | -1 | 1 | 4 | 2 | 3 | |
| A426 | 03 18 36.4 | 41 30 54 | 5366 | 1324 | 2 | 1 | 5 | 1 | 5 | |
| A1060 | 10 36 51.3 | -27 31 35 | 3777 | 647 | 1 | 5 | 16 | 4 | 17 | |
| A1367 | 11 44 29.5 | 19 50 21 | 6595 | 879 | 2 | 11 | 9 | 8 | 12 | |
| Virgo | 12 26 32.1 | 12 43 24 | 1075 | 632 | 1 | 3 | 20 | 2 | 21 | 0.52 |
| Coma | 12 59 48.7 | 27 58 50 | 6925 | 1008 | 2 | 6 | 20 | 11 | 15 |
2.2. Galaxy Selection
Individual galaxies in the aforementioned clusters were selected using the following procedure. We used the NASA/IPAC Extragalactic Database (NED) to search for all cataloged galaxies with available redshift within Mpc projected distance from the cluster center. Sources with radial velocities km s-1 than the systemic cluster redshift were excluded from the sample. NED selection is subject to the availability of data, and to investigate this bias we applied the selection criteria above to the Miller & Owen (2001b) sample for clusters common between their sample and ours: A262, A426, A1367, and Coma. The same was done with the AWM7, A1060, and Virgo homogenous samples of Koranyi & Geller (2000), Richter (1989), and Binggeli, Sandage, & Tammann (1985), respectively. All of these samples reduce to subsets of our sample after imposing our selection criteria. There are , , and galaxies in A262, A1367, and Coma, respectively, which are not included in the homogeneous samples above, and may be drawn from other surveys having potentially different selection biases. However, we note that these sources have radio and infrared (IR) luminosities comparable to the rest of the sample, and are morphologically diverse (half are early- and half are late-type galaxies), so their inclusion in the sample should not significantly affect our conclusions.
A constant velocity cutoff of km s-1 preferentially excludes sources with high peculiar velocity, particularly for A1060 and Coma, both having line-of-sight velocity dispersions of km s-1. Adopting a cutoff velocity for A1060 and Coma adds only source with detected radio and FIR flux to the sample, the starburst galaxy NGC4858. Our velocity cutoff quantitatively only affects the normalization of the cluster luminosity function (§5), since there is evidence that all types of galaxies fill luminosity space uniformly (i.e., no mass segregation; §6.2).
The FIR and radio data were obtained from the Infrared Astronomical Satellite (IRAS; Neugebauer et al. 1984) and the NRAO VLA Sky survey (NVSS; Condon et al. 1998), respectively. The IRAS data include m, m, m, and m flux measurements with a 1 error ellipse of . The total luminosity between m and m, dominated by young massive stars, can be estimated from the m and m flux. The NVSS radio survey at GHz ( cm) with the D and DnC configurations of the Very Large Array, has an angular resolution of with a sensitivity of mJy beam-1 at cm. The NVSS is sensitive to galaxies with star formation rates M⊙ yr-1 within a distance of Mpc (YRC; Condon 1992).
In the case of the two nearest clusters, A1060 and Virgo, we searched the NVSS database for radio sources within kpc projected distance (the typical size of a disk galaxy) from the optical position of each of the galaxies. For the other clusters, we chose a search radius of based upon the NVSS and IRAS error ellipses. The probability of finding an unrelated NVSS source within the search radius is . In some cases, confusion between a foreground galaxy and a background radio source (e.g., UGC1416), or between interacting companions (NGC4567 and NGC4568), was resolved using a more detailed inspection. For nearby galaxies with large angular extent in Virgo, the NVSS underestimates the flux due to extended disk emission and in some cases produces multiple radio matches for a single optical position. In these cases, corrections to the radio flux were obtained from the multiple-snapshot study of Condon (1987).
IRAS SCANPI coadditions of each galaxy were obtained and the source is included in our sample if the IRAS source centroid is within of the nominal radio position from the NVSS database and has in the m and m bands. The IRAS satellite has a raw resolution of and for extended sources greater than this, the SCANPI software can miss extended flux. There are such sources in Virgo. IRAS fluxes for of these extended sources were obtained from the IRAS Bright Galaxy imaging compilation of Soifer et al. (1989). Accurate fluxes could not be found in the literature for of the extended objects in Virgo, but all of these sources are excluded from the sample after adopting a luminosity cutoff (see §2.3). To summarize, we selected galaxies from NED with redshifts and they are included in the sample if they have secure NVSS and IRAS and detections. This selection process yields galaxies in the composite cluster.
The GHz radio and m luminosities were calculated using the following relations:
where D is the distance in Mpc, and and are flux densities in units of Jy. The m luminosity is related to the FIR luminosity, , by
(see Helou et al. 1988). The typical uncertainty in the luminosities is (), based on NVSS and IRAS absolute flux calibration errors. Intrinsic scatter due to variations in FIR and radio emission dominates the uncertainties in the flux scaling (YRC).
2.3. Sample Limits and Divisions
| m | |||||||||
|---|---|---|---|---|---|---|---|---|---|
| Cluster | Name | (2000.0) | (2000.0) | (mag) | (km s-1) | (W Hz-1) | (L⊙) | q | Notes |
| A262 | NGC0688 | 1 50 44.41 | 35 17 15.1 | 13.35 | 4151 | 21.68 | 9.76 | 2.37 | (R’)SAB(rs)b;Sbrst |
| UGC1308 | 1 50 51.34 | 36 16 34.3 | 13.77 | 5171 | 22.01 | 9.00 | 1.29 | E | |
| UGC1319 | 1 51 28.99 | 36 3 56.7 | 14.50 | 5310 | 21.95 | 9.63 | 2.03 | Irr | |
| NGC703 | 1 52 39.30 | 36 10 16.0 | 14.27 | 5580 | 21.63 | 9.09 | 1.91 | S0- | |
| UGC1347 | 1 52 45.98 | 36 37 8.1 | 13.49 | 5543 | 21.79 | 9.82 | 2.36 | SAB(rs)c | |
| NGC708 | 1 52 46.45 | 36 9 8.3 | 13.70 | 4855 | 22.53 | 9.10 | 0.98 | cD;E;Sy2 | |
| NGC710 | 1 52 54.25 | 36 3 12.1 | 14.27 | 6125 | 22.25 | 9.82 | 1.84 | Scd | |
| KUG0151+356 | 1 54 11.72 | 35 54 57.0 | 15.70 | 4387 | 21.11 | 8.99 | 2.36 | Spiral | |
| UGC1385 | 1 54 53.81 | 36 55 4.3 | 13.90 | 5621 | 21.98 | 10.43 | 2.64 | (R)SB0/a;Sbrst | |
| UGC1416 | 1 56 46.18 | 36 53 3.3 | 14.72 | 5470 | 21.11 | 8.97 | 2.17 | Sb | |
| NGC753 | 1 57 41.99 | 35 54 58.8 | 12.97 | 4903 | 22.23 | 10.20 | 2.31 | SAB(rs)bc | |
| NGC759 | 1 57 50.43 | 36 20 37.2 | 13.84 | 4667 | 21.89 | 9.60 | 2.00 | E | |
| UGC1460 | 1 59 4.61 | 36 15 25.2 | 14.64 | 4874 | 21.24 | 9.50 | 2.53 | Sa | |
| AWM7 | IC259 | 2 49 45.80 | 41 3 7.7 | 15.00 | 6108 | 21.50 | 9.74 | 2.52 | SB0? |
| NGC1106 | 2 50 40.49 | 41 40 17.8 | 13.30 | 4337 | 22.88 | 9.78 | 1.10 | SA0+;Sy2 | |
| UGC2350 | 2 52 40.27 | 41 23 45.8 | 14.60 | 3964 | 21.22 | 9.38 | 2.51 | Sb | |
| NGC1122 | 2 52 50.76 | 42 12 18.1 | 12.90 | 3599 | 21.80 | 10.03 | 2.53 | SABb | |
| CGCG539-121 | 2 54 16.65 | 42 43 34.1 | 14.70 | 6331 | 21.91 | 9.82 | 2.18 | Spiral | |
| A426 | UGC2608 | 3 15 1.48 | 42 2 8.8 | 13.70 | 6998 | 22.76 | 10.63 | 2.06 | (R’)SB(s)b;Sy2 |
| UGC2617 | 3 16 1.32 | 40 53 14.7 | 13.80 | 4697 | 21.33 | 9.53 | 2.69 | SAB(s)d | |
| IC310 | 3 16 42.95 | 41 19 28.7 | 13.89 | 5660 | 23.01 | 9.50 | 0.86 | SA(r) | |
| UGC2654 | 3 18 43.38 | 42 17 59.9 | 14.20 | 5793 | 21.87 | 9.94 | 2.38 | S? | |
| NGC1275 | 3 19 48.16 | 41 30 42.1 | 12.64 | 5264 | 25.15 | 10.52 | -0.47 | cD;pec;NLRG;Sy2 | |
| UGC2696 | 3 22 5.79 | 42 10 15.3 | 15.50 | 5453 | 21.25 | 9.09 | 2.13 | Scd | |
| A1060 | IRAS10288-2824 | 10 31 13.55 | -28 39 51.8 | 15.33 | 3690 | 20.98 | 9.20 | 2.43 | SABa |
| ESO436-G034 | 10 32 44.35 | -28 36 40.2 | 14.38 | 3624 | 21.21 | 9.32 | 2.50 | Sb | |
| ESO501-G017 | 10 34 24.09 | -26 29 27.8 | 14.97 | 4429 | 21.17 | 9.46 | 2.47 | S0(7) | |
| NGC3285B | 10 34 37.22 | -27 39 12.5 | 13.86 | 2952 | 21.09 | 9.08 | 2.39 | SB(rs)b | |
| ESO436-IG042 | 10 34 38.74 | -28 35 0.3 | 14.40 | 3190 | 21.77 | 9.87 | 2.28 | E4 | |
| ESO436-G046 | 10 34 50.35 | -28 35 4.7 | 13.42 | 3436 | 20.92 | 9.60 | 2.97 | SB(rs)b | |
| ESO437-G002 | 10 34 59.31 | -28 4 44.2 | 14.63 | 2311 | 21.30 | 9.23 | 2.28 | Sc;pec | |
| ESO437-IG003 | 10 35 7.89 | -27 59 27.2 | … | 2391 | 21.22 | 8.95 | 2.15 | … | |
| ESO437-G004 | 10 35 23.75 | -28 18 49.8 | 13.93 | 3304 | 21.05 | 9.21 | 2.53 | SB(r)b | |
| ESO437-G015 | 10 36 57.88 | -28 10 31.2 | 13.53 | 2743 | 20.99 | 9.09 | 2.32 | SB(s);sp | |
| NGC3312 | 10 37 2.55 | -27 33 52.7 | 12.68 | 2886 | 22.17 | 9.30 | 1.56 | Sab(r)p;AGN | |
| ESO501-G045 | 10 37 12.64 | -26 40 22.5 | 15.11 | 4578 | 20.92 | 9.17 | 2.52 | S0(3)/a(r) | |
| NGC3314A | 10 37 12.64 | -27 41 3.1 | 14.40 | 2872 | 21.91 | 9.60 | 1.99 | Sab:sp | |
| ESO501-G053 | 10 37 37.91 | -26 16 37.0 | 14.80 | 3814 | 21.06 | 9.33 | 2.56 | Sa | |
| ESO501-G059 | 10 37 49.46 | -27 7 17.4 | 14.97 | 2437 | 21.66 | 9.36 | 1.99 | Sc | |
| ESO501-G065 | 10 38 33.53 | -27 44 12.4 | 13.71 | 4425 | 21.86 | 9.55 | 2.00 | SB(s)d:pec | |
| ESO437-G025 | 10 38 40.10 | -28 34 4.9 | 14.49 | 3458 | 20.98 | 9.19 | 2.57 | S(B)b | |
| IRAS10369-2827 | 10 39 16.78 | -28 42 52.1 | 15.69 | 2811 | 21.12 | 9.17 | 2.24 | S0/a | |
| ESO501-G068 | 10 39 17.47 | -26 50 23.7 | 14.25 | 3090 | 20.93 | 9.15 | 2.57 | S(B)bc(rs) | |
| NGC3336 | 10 40 17.15 | -27 46 46.4 | 13.00 | 4000 | 21.72 | 9.59 | 2.22 | SA(rs)c | |
| ESO501-G075 | 10 40 58.75 | -27 5 8.8 | 13.48 | 4750 | 21.18 | 9.33 | 2.56 | SA(s)c | |
| A1367 | CGCG097-068 | 11 42 24.49 | 20 7 11.8 | 14.55 | 5974 | 22.05 | 10.15 | 2.35 | Sbc |
| CGCG097-073 | 11 42 56.22 | 19 58 10.3 | 15.50 | 7275 | 22.30 | 9.37 | 1.29 | SAcd:pec | |
| UGC6680 | 11 43 2.27 | 19 38 36.1 | 15.04 | 6985 | 21.79 | 8.94 | 1.71 | Sb | |
| CGCG097-079 | 11 43 12.22 | 20 0 26.8 | 15.70 | 7000 | 21.67 | 9.38 | 2.03 | Irr | |
| UGC6697 | 11 43 48.45 | 19 58 14.3 | 14.08 | 6725 | 22.70 | 10.10 | 1.66 | Im | |
| CGCG097-092 | 11 43 58.49 | 20 11 16.3 | 15.50 | 6373 | 21.43 | 9.52 | 2.33 | Sbc | |
| NGC3840 | 11 43 59.28 | 20 4 32.5 | 14.54 | 7368 | 21.60 | 9.79 | 2.45 | Sa | |
| NGC3842 | 11 44 1.81 | 19 56 56.7 | 12.78 | 6316 | 22.06 | 9.44 | 1.79 | E | |
| IRAS11419+2022 | 11 44 32.05 | 20 6 22.0 | 15.40 | 7230 | 21.46 | 9.94 | 2.70 | S0 | |
| UGC6719 | 11 44 47.47 | 20 7 25.5 | 14.44 | 6571 | 21.42 | 9.30 | 2.15 | Sab | |
| NGC3860B | 11 44 46.80 | 19 46 13.3 | 15.30 | 8293 | 21.73 | 9.81 | 2.45 | Irr | |
| NGC3860 | 11 44 48.86 | 19 47 47.1 | 14.22 | 5595 | 22.16 | 9.75 | 1.98 | Sa | |
| NGC3859 | 11 44 51.20 | 19 27 21.5 | 14.76 | 5468 | 21.97 | 9.90 | 2.24 | Irr | |
| CGCG097-125 | 11 44 54.97 | 19 46 24.7 | 15.74 | 8271 | 21.35 | 9.69 | 2.71 | S0a | |
| NGC3861 | 11 45 4.33 | 19 58 21.0 | 13.47 | 5085 | 21.91 | 9.51 | 2.07 | (R’)SAB(r)b | |
| NGC3862 | 11 45 5.23 | 19 36 37.8 | 13.67 | 6511 | 24.51 | 9.06 | -1.11 | E;LERG | |
| CGCG097-133NED01 | 11 45 17.32 | 20 1 17.3 | 15.71 | 5290 | 21.62 | 9.47 | 2.17 | E | |
| CGCG127-049 | 11 45 49.50 | 20 37 29.6 | 15.40 | 7061 | 21.46 | 9.72 | 2.52 | S- | |
| IC0732S | 11 45 59.83 | 20 26 28.7 | 15.45 | 7311 | 22.24 | 10.50 | 2.49 | S0/a | |
| NGC3884 | 11 46 12.23 | 20 23 31.0 | 13.50 | 6946 | 22.10 | 9.37 | 1.65 | SA(r)0/a;LINER;Sy1 |
| m | |||||||||
|---|---|---|---|---|---|---|---|---|---|
| Cluster | Name | (2000.0) | (2000.0) | (mag) | (km s-1) | (W Hz-1) | (L⊙) | q | Notes |
| Virgo | NGC4152 | 12 10 37.59 | 16 1 58.3 | 12.66 | 2167 | 20.90 | 8.96 | 2.32 | SAB(rs)c;HII;Sbrst |
| MESSIER098 | 12 13 48.40 | 14 54 3.5 | 10.95 | -142 | 21.26 | 9.24 | 2.30 | SAB(s)ab;HII;Sy | |
| NGC4208 | 12 15 38.69 | 13 54 1.3 | 11.83 | -81 | 20.82 | 9.13 | 2.62 | SAc | |
| MESSIER099 | 12 18 50.14 | 14 24 50.1 | 10.44 | 2407 | 22.02 | 9.87 | 2.16 | SA(s)c | |
| NGC4293 | 12 21 12.79 | 18 22 56.4 | 11.26 | 893 | 20.66 | 9.02 | 2.62 | (R)SB(s)0/a;LINER | |
| NGC4298 | 12 21 33.13 | 14 36 16.5 | 12.04 | 1135 | 21.03 | 9.01 | 2.37 | SA(rs)c | |
| NGC4302 | 12 21 42.36 | 14 35 44.3 | 12.50 | 1149 | 20.93 | 8.92 | 2.47 | Sc:sp | |
| MESSIER100 | 12 22 55.06 | 15 49 21.5 | 10.05 | 1571 | 21.92 | 9.74 | 2.13 | SAB(s)bc;LINERHII | |
| NGC4383 | 12 25 25.54 | 16 28 10.8 | 12.67 | 1710 | 20.85 | 9.26 | 2.61 | Sa? | |
| NGC4388 | 12 25 46.97 | 12 39 43.7 | 11.76 | 2524 | 21.56 | 9.35 | 2.02 | SA(s)b:sp;Sy2 | |
| NGC4402 | 12 26 7.71 | 13 6 50.3 | 12.55 | 232 | 21.11 | 9.06 | 2.30 | Sb | |
| NGC4419 | 12 26 56.42 | 15 2 52.2 | 12.08 | -261 | 21.09 | 9.21 | 2.38 | SB(s)a;LINER;HII | |
| NGC4438 | 12 27 45.56 | 13 0 31.0 | 11.02 | 71 | 21.46 | 8.96 | 1.83 | SA(s)0/apec:LINER | |
| MESSIER088 | 12 31 58.79 | 14 25 5.0 | 10.36 | 2281 | 21.84 | 9.57 | 2.12 | SA(rs)b;Sy2 | |
| NGC4526 | 12 34 2.78 | 7 41 58.0 | 10.66 | 448 | 20.47 | 9.08 | 2.93 | SAB(s) | |
| NGC4535 | 12 34 19.90 | 8 11 50.7 | 10.59 | 1961 | 21.20 | 9.37 | 2.51 | SAB(s)c | |
| NGC4568 | 12 36 34.17 | 11 14 25.3 | 11.68 | 2255 | 21.53 | 9.64 | 2.43 | SA(rs)bc | |
| MESSIER090 | 12 36 49.62 | 13 9 56.9 | 10.26 | -235 | 21.31 | 9.33 | 2.33 | SAB(rs)ab;LINER;Sy | |
| MESSIER058 | 12 37 43.74 | 11 49 8.0 | 10.48 | 1519 | 21.41 | 9.09 | 2.07 | SAB(rs)b;LINER;Sy1.9 | |
| NGC4634 | 12 42 40.74 | 14 17 46.3 | 13.16 | 297 | 20.91 | 8.93 | 2.35 | SBcd:sp | |
| NGC4647 | 12 43 32.49 | 11 34 58.1 | 11.94 | 1422 | 21.13 | 9.05 | 2.28 | SAB(rs)c | |
| NGC4651 | 12 43 42.81 | 16 23 36.8 | 11.39 | 805 | 20.92 | 9.09 | 2.49 | SA(rs)c;LINER | |
| NGC4654 | 12 43 55.76 | 13 7 45.1 | 11.10 | 1037 | 21.48 | 9.47 | 2.30 | SAB(rs)cd | |
| Coma | MRK0053 | 12 56 6.29 | 27 40 41.9 | 16.20 | 4968 | 21.67 | 9.74 | 2.36 | Sa;HII |
| NGC4839 | 12 57 24.37 | 27 29 55.0 | 13.02 | 7362 | 22.88 | 8.99 | 0.40 | cD;SA0 | |
| KUG1255+283 | 12 57 57.27 | 28 3 39.9 | 16.58 | 8299 | 21.68 | 9.50 | 2.03 | Sb;Sbrst | |
| NGC4848 | 12 58 5.44 | 28 14 37.2 | 14.41 | 7049 | 22.35 | 10.09 | 2.00 | SBab:sp | |
| CGCG160-058 | 12 58 10.06 | 28 42 32.6 | 15.48 | 7616 | 21.69 | 9.45 | 2.12 | Sbc | |
| KUG1255+275 | 12 58 18.78 | 27 18 31.8 | 16.50 | 7389 | 21.72 | 9.56 | 2.11 | Irr;Sbrst | |
| NGC4853 | 12 58 35.30 | 27 35 42.4 | 14.41 | 7660 | 21.44 | 9.74 | 2.61 | (R’)SA0-?;AGN | |
| MRK0056 | 12 58 36.00 | 27 16 4.5 | 16.20 | 7368 | 21.62 | 9.36 | 2.04 | S0;Sbrst | |
| MRK0057 | 12 58 37.57 | 27 10 33.2 | 15.40 | 7666 | 21.76 | 9.53 | 2.00 | Irr | |
| MRK0058 | 12 59 5.06 | 27 38 34.8 | 15.12 | 5554 | 21.54 | 9.49 | 2.18 | SBa;Sbrst | |
| UCM1256+2722 | 12 59 16.12 | 27 6 13.8 | 17.32 | 8604 | 21.60 | 9.46 | 2.15 | Sc+;Sbrst | |
| NGC4869 | 12 59 21.53 | 27 54 38.9 | 14.77 | 6875 | 23.41 | 9.32 | 0.04 | E3 | |
| NGC4874 | 12 59 35.47 | 27 57 36.5 | 12.63 | 7224 | 23.32 | 9.12 | 0.04 | cD;Di | |
| RB038 | 12 59 37.41 | 27 59 17.2 | 15.70 | 6812 | 21.47 | 8.99 | 1.83 | SA0/a | |
| FOCA0430 | 12 59 39.57 | 28 10 31.9 | 18.61 | 5437 | 21.64 | 8.99 | 1.81 | E | |
| KUG1258+279A | 13 0 34.15 | 27 38 9.0 | 15.68 | 7476 | 21.64 | 9.28 | 1.95 | Sb;Sbrst | |
| KUG1258+278 | 13 0 35.63 | 27 34 40.9 | 15.50 | 5097 | 21.41 | 9.32 | 2.25 | Sbc | |
| IC4040 | 13 0 37.97 | 28 3 23.2 | 15.36 | 7840 | 22.33 | 10.00 | 1.92 | Sdm | |
| KUG1258+287 | 13 0 40.77 | 28 31 16.5 | 16.40 | 8901 | 21.81 | 9.24 | 1.59 | Spiral | |
| IC4041 | 13 0 40.07 | 28 0 14.2 | 15.30 | 7112 | 22.06 | 9.79 | 2.09 | SA0 | |
| NGC4911 | 13 0 55.81 | 27 47 27.7 | 13.55 | 7985 | 22.30 | 9.83 | 1.91 | SAB(r)bc | |
| KUG1259+289 | 13 1 24.61 | 28 40 48.9 | 15.31 | 8762 | 21.58 | 9.45 | 2.22 | Irr | |
| NGC4927 | 13 1 57.92 | 28 0 18.1 | 14.95 | 7764 | 21.79 | 9.00 | 1.53 | SA0- | |
| NGC4926A | 13 2 7.48 | 27 38 55.9 | 15.22 | 7188 | 21.39 | 9.68 | 2.55 | S0pec?;Sbrst | |
| KUG1259+284 | 13 2 13.07 | 28 12 47.7 | 15.78 | 8202 | 21.44 | 9.40 | 2.22 | Sb | |
| NGC4931 | 13 3 0.39 | 28 2 24.2 | 14.31 | 5443 | 21.53 | 8.92 | 1.71 | SA0 |
We have imposed a luminosity limit of (the IRAS detection limit for the most distant cluster in our sample, Coma, at Mpc). Figure 1 shows the distances for the galaxies in the clusters as a function of m luminosity. Over of the sample is excluded by adopting our luminosity-limit, including the extended Virgo galaxies for which accurate IRAS fluxes could not be found. The final luminosity-limited catalog contains 114 sources. The sample is small compared to optically-selected cluster samples, but is drawn from a homogeneous selection of clusters based on X-ray emission and is luminosity-complete. The catalog of 114 galaxies is summarized in Table 2, along with the galaxies’ blue magnitudes and RC3 morphological codes from NED.
A key motivation for this study is to understand the effect of ICM density on the star forming activity in member galaxies. Using radius as a proxy for local density, each cluster has been divided into a Core and Ring region. Core galaxies are defined as having a projected clustercentric distance less than Mpc (see §3 for a justification of this radius), and Ring galaxies are defined to have a projected clustercentric distance between Mpc and Mpc. We chose the maximum limit of Mpc since this is a median value for the virial radii of most clusters, typically between Mpc and Mpc. Some fraction of Core galaxies are Ring galaxies appearing in projection and the effect of this contamination is addressed in §3 and §4.3.
Morphological dependencies are investigated by dividing the sample into early-type (E and S0) and late-type subsamples. Of the galaxies, () are early-type galaxies, higher than the detection rate of early-type FIR galaxies in the field (; see Cotton & Condon 1998), and significantly higher than the fraction of ellipticals in the local universe (). This clustering of early-type galaxies reflects the density-morphology relation (Dressler 1980; §6.1). It may also signify that cluster ellipticals are brighter at FIR wavelengths than those found in the field (§6.1). The number of Core, Ring, early-, and late-type galaxies in the luminosity-limited sample for each cluster are summarized in Table 1.

3. Deprojection and Density Distribution of Cluster Sources
Accurate information on the nature of the Core galaxies can be obtained by estimating the amount of source contamination from the Ring region due to projection effects. A geometrical recursive technique employing simple discretization of the Abel integral is used to deproject the sources within spherical shells surrounding the core, starting with the outermost shell. The parameters that characterize the density distribution are the central density (), core radius (), and log-slope (; see equations 4 and 5 below), and of these, can be the most systematically uncertain: the outer shell has the lowest number count, and this statistical error can become significant after propagating to the inner shells, resulting in a range of normalizations. In contrast, and are more resilient to such initial error as they parameterize a “bulk” behavior of the sources. Minimizing the initial error in requires accurate background decontamination, in which case velocity selection may be used to determine the most likely cluster members, as is done in this study. The cluster-to-cluster variation in density distribution is dominated by statistical noise, but there is a clear trend in that of the composite cluster. Table 4 lists the radii of the spherical shells, observed counts within those regions, computed deprojected counts, and estimated density, which increases with decreasing radius. The “radius” of a bin is defined as the mean of the inner and outer radii of that bin.
In relaxed, regular clusters, the number density of galaxies and the gas density are correlated since the crossing time of a cluster galaxy is an order of magnitude shorter than a Hubble time if the cluster is in hydrostatic equilibrium. The hydrostatic model for these clusters provides a consistent fit for both the X-ray and number density distributions (Bahcall & Lubin 1994). The galaxy surface density profile can be represented as
according to the -model (Cavaliere & Fusco-Femiano 1976). The deprojected density that should fit both the number and X-ray gas distribution is then given as:

| Radial Boundaries | Number Density | |||
|---|---|---|---|---|
| Region | (Mpc) | Observed Counts | Deprojected Counts | (Mpc-3) |
| 0 (Core) | 33 | 15.92 | 30.41 | |
| 1 | 20 | 17.85 | 19.55 | |
| 2 | 17 | 10.16 | 6.28 | |
| 3 | 18 | 19.49 | 7.73 | |
| 4 | 16 | 22.47 | 6.19 | |
| 5 | 10 | 28.11 | 5.70 | |
| Total | … | 114 | 114.00 | … |
The accuracy of the deprojection method can be determined by fitting the galaxy surface density with equation (4) (Figure 2). While the confidence limits for , , and are a factor of two times the best-fit values, the mean values of and are consistent with those found for typical clusters ( Mpc-2, Mpc, and with ). Comparison with the independent fit for the deprojected galaxy density (not shown) yields parameters that agree with those in Figure 2. These results indicate that selection based on radio and FIR emission does not bias the galaxy distribution away from that seen among clusters in general.
4. FIR-Radio Relation
4.1. Radio-FIR Correlation
Figure 3 shows the cm radio continuum luminosity plotted against the m luminosity, i.e., the radio-FIR correlation, for the flux-limited sample. The band between the two dotted lines indicates the best-fit linear correlation between radio and FIR luminosity and the scatter of dex for the 1809 galaxies of the IRAS 2 Jy YRC field sample. Most () of the IRAS selected field galaxies, including early-types (E and S0), are normal star forming galaxies following the linear radio-FIR correlation (YRC). Comparison with these field galaxies shows that of the cluster galaxies deviate significantly ( dex) from the radio-FIR correlation defined by the IRAS-selected sample. For comparison, of field galaxies deviate dex from the mean relation, mostly from systematic deviations at the high and low luminosity ends. Twenty-seven percent of the cluster galaxies above our flux limit exhibit a higher radio luminosity than expected from the linear field correlation ( above the field correlation): of these galaxies are in the observed Core region and are early-type galaxies.


None of the sources have , in contrast to the field where are luminous in the infrared (YRC). The 2 Jy selection at is identical to the optical selection of late-type galaxies in the field (YRC). We expect the same selection effect for our cluster sample. Rarity of IR luminous galaxies has been noted in other similarly-sized samples of cluster galaxies (e.g, Bicay & Giovanelli 1987). From YRC, the space density of IR luminous galaxies in the field is about Mpc-3, and there is only a chance of finding such a source within the search volume ( Mpc3) in the field. The high galaxy density in the cluster environment should increase the expected fraction by an order of magnitude to near unity. Their non-detection in these clusters by itself is not a strong indication of bias against IR luminous phenomena in the cluster environment. For comparison, the Abell cluster study of Miller & Owen (2001b) finds only 4 of 329 cluster sources with secure IRAS m and m detections having L⊙, and only of these lies Mpc from the cluster center.
A separate linear least-squares fit to the radio and FIR luminosity for our 182 sample galaxies indicates a shallower than unity log-slope of , but with a dispersion of 0.74, emphasizing the much greater scatter among the cluster galaxies as compared with those from the field (Figure 3). The scatter is slightly less if we only consider galaxies in the luminosity-limited sample. The shallower slope is not statistically significant given the large scatter among cluster galaxies.
Note the apparent bias of sources below the best-fit correlation between and our luminosity cutoff of . Approximately of the galaxies below the luminosity cutoff are in Virgo. The excess of radio-luminous galaxies at L⊙ consists of mostly elliptical and/or Seyfert () galaxies, none of which are included in the Virgo radio-FIR study of Niklas, Klein, & Wielebinski (1995). One source (IC3099) in this region is one of the for which we could not find accurate IRAS fluxes: the radio bias of this source may be due to missing extended FIR emission. Niklas et al. (1995) identify a few Virgo early-type galaxies in the Core with excess and cm radio emission compared with their FIR emission. This is also the case for early-type galaxies further away from the cluster center (Figure 3). Excluding these radio-luminous objects, the majority of the remaining galaxies are situated below the radio-FIR correlation for the YRC field sample, and a formal fit to the data yields a greater than unity slope, consistent with the Niklas et al. (1995) study and with the nonlinearity seen at lower luminosities in the radio-FIR correlation of the YRC field sample (Fig. 5a of YRC; see also Bell 2002 for a more recent review). Possible explanations for this nonlinearity include dust heating by low-mass stars or cosmic-ray diffusion. Adopting a luminosity cutoff excludes this nonlinear regime and selects the region in luminosity-luminosity space where both the FIR and radio luminosity are directly proportional to the massive star formation rate, allowing for an unbiased method of segregating star forming galaxies and AGNs (see §6.3).

4.2. FIR-Radio Flux Density Ratio
To investigate the deviation from the linear radio-FIR correlation, we compute the parameter (Condon, Anderson, & Helou 1991),
where is the observed 1.4 GHz flux density in units of W m-2 Hz-1 and
where and are IRAS 60 m and 100 m band flux densities in Jy (see Helou et al. 1988). The parameter is both independent of distance and starburst strength (YRC; Lisenfeld, Volk, & Xu 1996) and so is a good quantitative measure for comparing galaxies independent of their star formation rates. The values for the cluster galaxies are listed in Table 2 and are plotted in Figure 4. The lines appearing at and delineate the point at which the galaxies have times larger IR and radio flux, respectively, than what would be expected from the radio-FIR correlation. Sources with and are referred to as IR- and radio-excess sources, respectively (YRC).
The mean for the flux-limited sample is , statistically consistent with the mean value of for the field. However, the low value and large scatter as compared with the field is due in part to AGN activity, which results in a systematic difference in the distribution. The mean for the luminosity-limited sample is similar, , with smaller dispersion, despite the exclusion of low radio luminosity sources among the low IR luminosity population of Virgo discussed above. This indicates that the radio-luminous sources below our luminosity cutoff (e.g., elliptical and Seyfert galaxies in Virgo) balance the effect of the galaxies appearing below the radio-FIR correlation. About of the Abell cluster galaxies of Miller & Owen (2001a) populate poor clusters and are projected up to Mpc from the cluster center, yet have a lower mean (). This is likely due to their selection based strictly on radio emission and the presence of a large number of optically-identified AGNs in their sample.
4.2.1 cD Galaxies
There are a total of radio-excess sources in our sample, of which are cD galaxies (NGC708, NGC1275, NGC4839, NGC4874). Radio and X-ray observations of these cD galaxies imply jet-like activity in their nuclei (Conselice, Gallagher, & Wyse 2001; Holtzman et al. 1992; Vermeulen, Readhead, & Backer 1994; Rhee, Burns, & Kowalski 1994; Neumann et al. 2001; Colles & Dunn 1996; Feretti & Giovannini 1987). The FIR luminosity may result from star formation, but in some cases, such as NGC1275, there is also a notable contribution from collisional heating of dust (e.g., Irwin, Stil, & Bridges 2001—see §6.4.1 for further discussion).
4.2.2 Remaining Radio-Excess Sources
Of the remaining radio-excess sources, show radio, X-ray, and/or emission lines consistent with the presence of an AGN. (Bonatto et al. 1996; Owen, Ledlow, & Keel 1996; Sambruna, Eracleous, & Mushotzky 1999; Vron-Cetty & Vron 1996; Ji et al. 2000; Baum et al. 1997; de Koff et al. 2000; Bai & Lee 2001; Zirbel & Baum 1995). CGCG097-073 is a spiral galaxy in A1367 that shows strong and extended H emission, indicating vigorous star formation activity (Moss, Whittle, & Pesce 1998). KUG1258+287 is an HI rich spiral galaxy in Coma with relatively low optical surface brightness in the Digital Sky Survey image and may be interacting with its close companion FOCA195 (Bravo-Alfaro et al. 2000). NGC4927 is another early-type Coma galaxy. NGC3884 is close to the boundary for a radio-excess galaxy, with . It is a Seyfert galaxy, with an extended LINER spectrum (Durret et al. 1993).
Thirteen of galaxies () show radio-excess, times higher than the detection rate in the YRC field sample. Of the radio-excess sources, are early-type galaxies. Of the and early-type galaxies in the Core and Ring region (in the luminosity-limited sample), and , respectively, are radio-excess sources. As discussed above, at least of the non-cD radio-excess sources host an AGN. The average for both late- and early-type observed Core galaxies is , a FIR-radio flux density ratio half that of the cluster average. The average in the Ring is , still a factor of times higher than the mean for the YRC field sample. These results suggest some variation in with radial distance.
4.3. -Radius Correlation
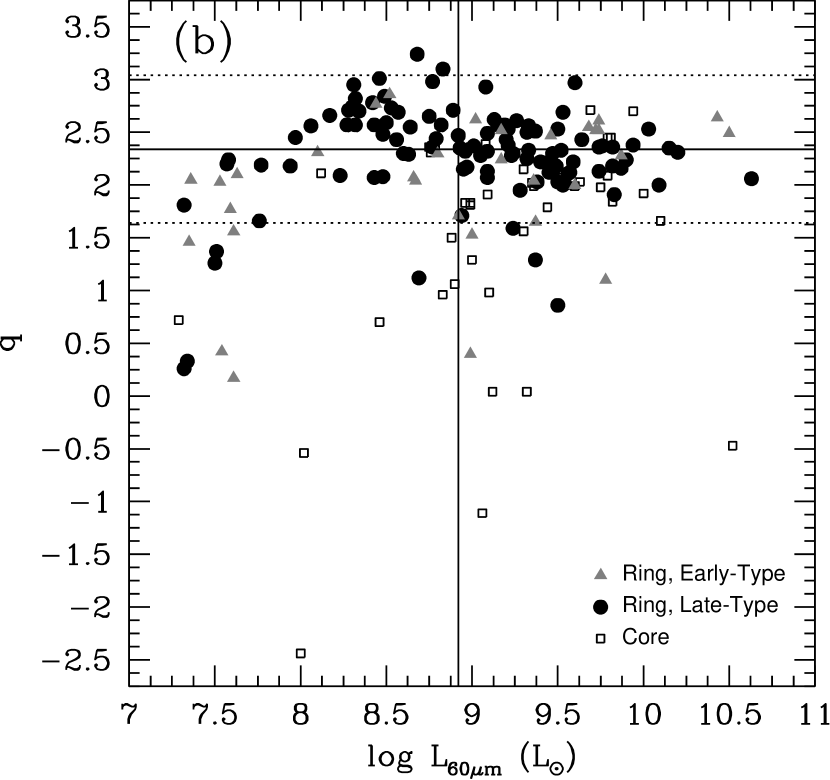
The distribution of galaxies as a function of their values is shown in Figure 5 (binned every 0.25 dex). Objects with negative values are included in the first bin. The distribution for Ring galaxies peaks near the mean value for the YRC field sample, whereas the peak for the Core galaxies lies almost a factor of lower. Both distributions drop off quickly for high values, and taper off more slowly for lower values, indicating a general bias toward lower values.

The deprojection analysis (Table 4) indicates that of the observed Core members could be Ring galaxies seen in projection. Assuming these contaminating sources have the same distribution as the Ring sources, then of the observed Core galaxies with are Ring members, and will be removed after deprojection and “added” to the Ring sample. If this statistical result reflects a real change in the population, then the average value of the Core galaxies drops from to , a factor of decrease from that of field galaxies (YRC).
Of the Ring galaxies, have . Similarly, of Core galaxies have . If we assume that all galaxies with are Core galaxies and all with are Ring galaxies, then “deprojecting” according to value indicates that and galaxies are in the Core and Ring regions, respectively. For comparison, deprojection based on the number counts yields and Core and Ring sources, respectively. If the above assumptions are made, then the value can be used to roughly discriminate between Core and Ring galaxies, and would be useful in situations where the density profile of cluster galaxies cannot be determined accurately. A more meaningful segregator may be observed with a larger sample of data and should also vary with core radius and cluster richness. A detailed investigation is necessary to establish the strength of, and variation in, the segregator.
According to Figure 4, of () observed Core galaxies have radio-excesses, and of these are early-type galaxies. Similarly, of () Ring galaxies have radio-excesses, and of these are early-type galaxies. The increase in frequency of radio-excess sources toward the center of clusters contributes to a radius-dependent distribution. There is significant scatter in the correlation between and , and the best fit relation is
where the 4 cD galaxies in our sample have been excluded for this analysis—all of which are classified as radio-excess sources based on our definitions—since these are not typical of cluster galaxies.
If all radio-excess sources are excluded, the correlation between and is shallower with a scatter of 0.28 dex, identical to the scatter in for YRC field galaxies. Consequently, the scatter does not reflect statistical noise, but is a systematic result of the radio-excess sources in our sample, most of which are AGNs. If the increased radio luminosity of elliptical galaxies stems from an increase in number density, then the correlation of equation (8) reflects the density-morphology relation as the early-type galaxies have a density distribution that peaks in the Core region.
Figure 6 shows the radio and FIR luminosity (computed from eq. [3]) for the luminosity-limited sample (excluding cD galaxies) as a function of radius. Formal fits to the correlations give and , giving , and indicates the general bias of radio luminous sources toward the Core region. We also note that the fraction of galaxies with increases from in the Core to in the Ring. FIR luminosity is constant with radius. The lack of FIR luminosity segregation has also been noted by Rengarajan, Karnik, & Iyengar (1997) for spiral cluster galaxies. We find the same to be true for early-type galaxies. Hence, values are lower in the Core than the Ring region due primarily to an increase in the radio luminosity, as opposed to a deficit in the FIR luminosity. Possible variations in the FIR luminosity-radius correlation between clusters are investigated in §6.4.2.


5. Radio and IR Cluster Luminosity Functions
Comparison of the cluster galaxy luminosity distribution with an appropriately chosen field sample should draw out distinctions between the cluster and field populations, and we can thereby investigate whether the rich ICM preferentially affects the faint or bright ends of the cluster galaxy population. We do this analysis by computing the cluster radio and IR luminosity functions (LFs) via the method (Schmidt 1968; Felten 1976)—i.e., number of sources per luminosity interval divided by the total volume equal to the number of clusters falling below the luminosity interval times the volume of one cluster. For simplicity, we have assumed the volume of a single cluster to be that of a sphere of radius Mpc. In practice, the sampled volume (and hence normalization of the LF) may be difficult to constrain due to a number of factors (e.g., projection effects, the adoption of a km sec-1 velocity cutoff, etc.). The deprojection results of §3 suggest that the assumption of a spherical volume is not unreasonable. Furthermore, our adopted velocity cutoff should only affect the normalization of the LF since all types of galaxies (e.g., Core, Ring, early-, and late-type) are found to uniformly populate the range of luminosities considered here. We are most interested in comparing the shapes of the cluster and field LFs and not the exact normalization. Finally, a joint analysis of the radio and IR LFs should mitigate some of the uncertainties introduced by sample selection and volume determination.
The LF is constructed by first computing the number of galaxies per luminosity interval, taken to be for between and . The cluster LF is compared to the best-fit Schechter (1976) LF for the low-luminosity YRC field population, normalized to the value of the LF in the luminosity bin containing the greatest number of sources (representative of galaxies).
5.1. IRAS m Cluster Luminosity Function
The cluster LF is well-described by the shape of the low-luminosity field LF (Figure 7; YRC) for , after renormalizing the field LF by a factor of . The break in the LF at is a result of the seven clusters not being uniformly distributed in redshift space, where the sampled volume increased by a factor of . For comparison, the LF computed for Virgo cluster galaxies is also shown in Figure 7. The paucity of IR and radio sources in the Virgo core (§6.4.2) indicates that the sampled volume for Virgo may be smaller than the one taken here, yet correcting for this does not fully account for the disparity between the cluster and field LFs at low luminosity. The bias of the cluster LF below the field LF may therefore be a result of incompleteness resulting from non-detections of low luminosity Virgo sources. Previous studies indicate for optically-selected Virgo galaxies (e.g., Ferguson & Sandage 1988). Assuming that the FIR emission from faint blue galaxies is correlated with their optical luminosity, the faint-end slope for the Virgo cluster LF in this study is inconsistent with the Ferguson & Sandage (1988) result. The divergent behavior of the low-luminosity end of the IR LF is discussed below (§5.3).

5.2. GHz Cluster Radio Luminosity Function
Figure 8 shows the cluster radio LF, constructed in the same way as the IR LF. The cluster radio LF is scattered around the field LF. Unlike the situation with the IR LF, the low-luminosity cluster radio sources appear to have a faint-end slope similar to that of the field. This can be easily explained by the increased contribution from radio-luminous Virgo sources with between and (e.g., Figure 3). There is an excess of cluster galaxies at the high luminosity end which is more pronounced than that seen in Figure 8, as there are 3 sources with that are not shown in the figure. The sources showing excess radio emission are seen more clearly in Figure 4, where the scatter of cluster galaxies is not symmetric about the scatter among YRC field galaxies. A similar excess is found in the radio LF for YRC galaxies, and after removing all sources within Mpc of the centers of known clusters within the limits of the YRC field sample, the field galaxies have a LF indistinguishable from the UGC sample LF of the Condon (1989) study. The excess observed in Figure 8, as well as the excesses observed for the IRAS 2 Jy sample (see Figure 8b in YRC) and the radio LF of UGC sample galaxies (Condon, Cotton, & Broderick 2002) all suggest that radio-luminous AGNs play a more significant role in the cluster environment than they do in the field.

If radio-excess is an indicator of AGN activity (see §6.3), then the excess observed in Figure 8 is predominantly due to the early-type radio galaxies, which account for of the radio-excess objects (cf. §4.2). To quantify this further, the radio LF for late-type galaxies only is computed and shown in Figure 8. While early-type galaxies contribute to the luminosity density for the entire luminosity range considered here, the difference between the LF for the late-type galaxies and the LF for the aggregate sample increases for , suggesting an increasing contribution of radio emission from early-type galaxies at high luminosities. The galaxies for which are early-type Core galaxies. Despite the uncertainty involved in normalizing the cluster LF, no amount of reasonable normalization can account for the excess of radio sources appearing for —this would require a factor of at least difference in the cluster and field LF normalizations, and the observed factor is .
5.3. Faint Cluster Sources
The disparity between the faint-end slope of the IR cluster galaxies and the YRC field galaxies may indicate that (1) we do not have a good constraint on the sampled volume for lower luminosity sources or (2) the cluster LF is truly flatter than the field LF at low luminosity. Explanation (1) can be illustrated by the observation that fainter sources in AWM7 are not detected as compared with A262 and A426, which just encompass AWM7 in redshift space (see Figure 1). The statistics of AWM7 sources are poor, and the sampled volume may be much smaller than the one taken here. Statement (2) might be true if the number counts of faint sources in clusters is lower than in the field due to the fainter and less massive sources accreting or merging with larger galaxies resulting in a top-heavy galaxy mass function.
The IR LF alone indicates a flattening of the faint-end slope when compared with the field. This flattening is unlikely due to NED selection since our flux cutoffs are low enough to include normal field galaxies where optical and IR selection are identical (e.g., Condon et al. 2002, YRC). The effect responsible for the flattening of the faint-end slope (i.e., selection effects, top-heavy galaxy mass function, etc.) of the IR LF should also effect the radio LF faint-end slope in the same manner, when we take into account the radio-luminous Virgo sources with between and . We do not currently have the means to ascertain the reason for such an effect, but merely suggest it for future study.
6. Discussion
6.1. Density-Morphology Relation
The density distribution computed from deprojected late-type Ring galaxies shows no trend with radius and is scattered around a mean of Mpc-3. The computed density of late-type galaxies within the Core is only Mpc-3, times under-dense than the composite cluster, and a factor of smaller than the density of early-type galaxies in the Core region ( Mpc-3). The overall surface density of ellipticals in the Ring region is Mpc-2, compared with a surface density of Mpc-2 in the Core region. These observations indicate that early-type galaxies are more strongly clustered in the Core than late-type galaxies. The bias of early-type galaxies and the analytic fit to the composite cluster density (§3) indicate that the high detection rate of ellipticals is not due to sample selection effects, but represents a true increase in density.
The density-morphology relation is well established for optically-selected cluster galaxies, but ours is a highly biased subset based on radio and FIR emission. A valid point of inquiry therefore is whether the increase in early-type galaxy density in the Core region is due to an underlying change in the density-morphology relation for radio- and FIR-selected cluster galaxies, or if it simply reflects the existing density-morphology relation for all cluster galaxies and a random, uniform appearance of radio sources among them. To answer this, we note that the exacting selection criteria used in this study makes it likely that the radio and FIR ellipticals in our sample are a subset of the optically-identified ellipticals. The total fraction of detected early-types (cD, elliptical, and S0) in both the flux- and luminosity-limited samples is , somewhat lower than the fraction typically found in “spiral-rich” clusters (). Consequently, the detection rate of early-type galaxies in our survey is consistent with a random population of radio sources tracing the underlying density-morphology relation for optical cluster galaxy samples. The distribution of late-type galaxies can be understood in a similar manner to that of the early-type galaxies. Optically-selected samples show a late-type fraction that decreases toward the central regions of clusters. The same correlation is found in our sample (see above). Our flux cutoff is low enough to include galaxies with star formation rates similar to those found in the field, and the selection is identical to the optical selection of late-type galaxies (Condon et al. 2002, YRC).
6.2. Mass Segregation in Clusters
Mass segregation among cluster galaxies may induce the observed correlations between radio and FIR luminosity and clustercentric radius as more massive galaxies may be more efficient IR and radio emitters. To investigate this possibility, -band fluxes for all candidate sources were obtained from the Two Micron All Sky Survey (2MASS), using -band luminosity as a proxy for mass. The -band luminosity to mass ratio is thought to be more universal than optical ratios, subject to lower extinction effects, and linked to older stars. The 2MASS survey data include accurate magnitudes for sources less than in extent.
The cluster A1060, a few sources in AWM7 and Virgo, and almost all sources in Coma were observed by 2MASS, but have either not been cataloged, or, as in the case of Virgo, have not been mosaiced to obtain accurate m fluxes. For example, spatially integrated m fluxes are not reported for unmosaiced Virgo cluster galaxies greater than in extent. These are some of the most massive galaxies in our sample. To assess possible mass segregation among Virgo galaxies, we have used the data obtained by Boselli et al. (1997), which includes magnitudes measured from Infrared Space Observatory (ISO) images of Virgo cluster galaxies. The data for Virgo are analyzed seperately from the remaining sample to preclude any systematic bias owing to differences in wavelength coverage and response between the 2MASS -band and the ISO -band filters.


For the sources with reported 2MASS -band magnitudes, the -band absolute luminosity has been computed and plotted against projected radial distance (Figure 9a). A formal fit shows only a very weak correlation with dex: a probability of a positive correlation between M(K) and . Separate analyses for early- and late-type galaxies find the correlation is even weaker: the corresponding errors in the slope of the correlations allow for constant M(K). The slight correlation for the composite cluster may be due to the central cD galaxies, as well as the Messier and Seyfert galaxies in Virgo with an extent of in diameter. The formal fit was redone excluding the two cD galaxies (NGC 708 and NGC 1275) for which -band data were available. Some galaxies with very small cluster offsets, small velocity differences, or unusually low value were left in the sample if their optical morphology indicated a non-cD galaxy. The resulting correlation is even weaker (Figure 9a), and the slope is statistically consistent with zero ( with dex). Eleven galaxies in our Virgo sample were imaged in the Boselli et al. (1997) study, including half of our detected Messier sources. Their absolute -band magnitudes are plotted in Figure 9b as a function of projected radial distance. As with the previous analysis, we find only a probability of a positive correlation between M(K) and , and the statistics are consistent with a flat slope.
Luminosity segregation in clusters has been studied extensively, leading to mass estimates by invoking some M/L ratio. The mass per galaxy can be obtained by normalizing the luminosity density by the number density. As an example, we consider the Virgo cluster. The luminosity density profile has an identical slope to the number density distribution in Virgo, except in the very central () region of the cluster, where the luminosity density is steeper than the number density (Schindler et al. 1999). Neglecting these central bright galaxies (most of which are Messier and Seyfert galaxies), the inferred average mass per galaxy is constant with radius. Again, this conclusion assumes some constant M/L ratio based on the average M/L ratio of early- and late-type galaxies in clusters. As another example, there is marginal evidence for segregation in the inner of the core radius of Coma, but no large-scale correlation is found (Zhao et al. 1991; Bahcall 1973 and references therein). Inclusion of Coma galaxies in Figure 9 should therefore not significantly affect our conclusion based on the clusters for which -band data were available. The absence of mass segregation for the time-averaged evolution of the composite cluster is important for our study since it indicates that radial variations in radio and FIR emission are not a result of gas-poor massive ellipticals dynamically sinking into the Core region.
6.3. Discerning AGN from the Normal Population
Determining the power source of cluster galaxies is crucial in order to correctly interpret the radio and FIR correlations discussed in previous sections. Our sample is small enough that a case-by-case analysis of the multiwavelength data for each galaxy can be carried out to determine which show evidence of AGN. We have searched the literature for each of the radio-excess sources, and we assign an AGN classification based on evidence of hard X-ray emission, radio jets, or broad optical emission lines consistent with an active nucleus. This resulted in AGN classifications. Miller & Owen (2001a) obtained high-resolution data for two of our remaining radio-excess sources (CGCG097-073 and KUG1258+287) and were classified as star forming galaxies based on their nuclear optical spectra.
The validity of using radio-excess as an indicator of AGN has been explored in previous studies (e.g., YRC; Yun et al. 2000; Condon & Broderick 1988). The exact AGN fraction among radio-excess sources in the Miller & Owen (2001a) sample is unclear as (1) they were unable to obtain spectroscopy for all of their sources, (2) their spectroscopy cannot distinguish a weak AGN system from a compact starburst dominated emission-line spectrum, and (3) they include galaxies in the AGN sample which show evidence of an old stellar population from the absorption-line spectrum (Miller & Owen 2001a). They test the effects of (2) by obtaining high-resolution () radio images of cluster galaxies in A1367 and A1656, and find that of the of detected galaxies, at least have a compact nucleus. Of the remaining , are known star forming galaxies whose nebular emission may overwhelm the emission associated with an AGN.
We have independently analyzed the data of Miller & Owen (2001a) and find that of the spectroscopically-confirmed star forming galaxies in their radio-selected sample, only show radio-excess, whereas of their spectroscopically-confirmed AGNs show radio excess. The overall frequency of AGN sources among their radio-excess galaxies is therefore . It is likely that the actual frequency of AGNs among the radio-excess galaxies is higher, since few optical spectra were collected for the most radio-luminous sources (). Miller & Owen (2001b) detect 4 FIR luminous () galaxies. Of these, one is an IR-excess galaxy with and the rest have nominal values. None of the IR-excess sources in our sample show evidence for AGN activity. The radio-excess sources in our sample include 4 AGN cD galaxies and 5 non-cD AGN sources. Hence, of the radio-excess sources in our sample, are AGN based on the presence of radio jets, X-ray emission, and/or optical emission lines. This fraction is a lower limit since some of the less well-studied radio-excess objects could also host an AGN. In summary, it appears that a significant fraction of radio-excess objects are associated with luminous AGN.
A segregation between IR luminous, normal, and radio-excess objects can be seen by examining the IRAS FIR–vs.–mid-IR color-color diagram (see YRC for a discussion). The comparison of the environment in radio-excess cluster objects to “normal” cluster galaxies can be investigated in the same way. In Figure 10, the large open and filled grey circles represent early- and late-type cluster galaxies with , respectively. The radio-excess sources are shown with large open and filled squares for late- and early-type galaxies, respectively. For comparison, the distribution for the IR-selected YRC field galaxies within Mpc is indicated by the small black points.
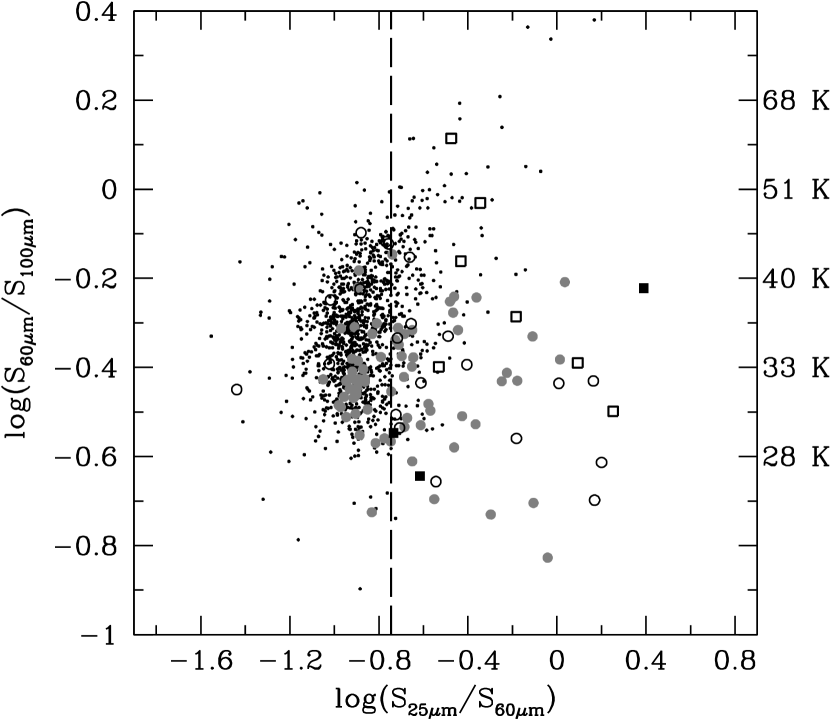
The aggregate sample of cluster galaxies in the luminosity-limited sample have , and the appropriately selected field galaxies have . For comparison, the mean FIR color in the cluster sample of Bicay & Giovanelli (1987) is , slightly lower, but still consistent with our result. The slight difference may be due to our selection of cluster galaxies based on FIR emission, biasing the sample to galaxies with warmer FIR color than seen in optically-selected galaxies.
All of the radio-excess sources which have detected m emission appear to the right of the proposed line indicating the lower boundary for IR Seyfert galaxies according to their colors (de Grijp et al. 1985). Sources detected at m will have higher ratios in general than those not detected at m. The absence of radio-excess sources to the left of the proposed indicator for IR Seyfert galaxies is not significant by itself. However, when taken in conjunction with the observation that most radio-excess galaxies in the field have warmer mid-IR colors than the normal population by dex (YRC), this suggests that radio-excess sources in the cluster also, on average, have warmer mid-IR colors, consistent with a model in which dust is heated in the circumnuclear region by an AGN. The early-type radio-excess objects (most of which are AGN) populate the same region in color-color space as the radio-excess field objects appearing to the right of the IR Seyfert line (YRC). In summary, radio-excess sources show mid-IR colors consistent with AGN, and this is supported by the case-by-case analysis. The segregation of values indicates that most of these radio-excess sources are in the Core region.
While radio-excess sources generally show mid-IR excesses, the opposite is not true. Namely, there are many late-type galaxies that do not have a radio-excess but which do show mid-IR-excess. This is not surprising since either a young or compact starburst or radio-quiet AGN could result in the observed mid-IR color (e.g., Efstathiou, Rowan-Robinson, & Siebenmorgen 2000). We can place an upper limit to the fraction of mid-IR excess cluster sources with of , with the field value being . A direct comparison of the two fractions is risky as there may be a number of selection effects we have not considered. If, in fact, a larger fraction of normal cluster galaxies exhibit mid-IR excess when compared with the field, it may indicate that many of the disk galaxies host young, dust-enshrouded starbursts. If so, this provides some marginal evidence for harassment-induced star formation activity (see §6.6).
6.4. FIR Emission Mechanisms
6.4.1 X-Ray Dust Heating
According to §6.2, the composite cluster shows no evidence of mass segregation based on the galaxies’ -band luminosity. If only the cirrus component of dust is stripped from a galaxy, then this will have an effect on the observed emission at , but the net impact on should be small. This argument is difficult to quantify since it requires a knowledge of the dust distribution within galaxies. However, dust is closely associated with molecular gas which can be accurately traced by millimeter CO transitions. Young et al. (1995) have shown that more than of the CO emission from late-type galaxies comes from the inner of the optical disk, and the same may also be true of FIR emission. Consequently, the mass-to-light ratio as traced by M(K)/L60μm should be insensitive to the effects of dust stripping. The presence of significant collisional heating should result in the more centrally located galaxies having lower M(K)/L60μm values. Figure 11 shows no correlation between M(K)/L60μm and radius indicating that collisional heating due to electrons is not a significant source of FIR emission.

The effects of collisional heating of dust by ICM electrons can be estimated by calculating the collisional heating rate. Following the analysis of Goudfrooij & de Jong (1995), the heating rate is given by
where is the electron temperature, is the dust grain radius, and is the radial electron density profile, assumed to follow a profile similar to equation (5). The dust temperature is obtained by equating the collisional heating rate to the cooling rate due to IR emission given by de Jong et al. (1990), yielding
where the opacity (Hildebrand 1983), is the grain density, and a dust emissivity proportional to has been assumed. Assuming a typical value of K, the temperature-radius curves for 6 of the 7 clusters (excluding Virgo) are shown in Figure 12a, for the values of , , and derived by Mohr, Mathiesen, & Evrard (1999) from the X-ray surface brightness profiles. The curves shown are those corresponding to cm and g cm-3. The temperature-radius relation is sensitive to the product of and , and Figure 12b shows the curves corresponding to different grain densities assuming the -model parameters derived in §3 for the composite cluster.


The effects of X-ray dust heating do appear to be significant in cD galaxies containing large amounts of hot X-ray gas associated with the ICM . In this case, the electron density is high enough that dust heating becomes important (e.g., Bregman, McNamara, & O’Connell 1990; Lester et al. 1995) and the emission is uncharacteristic of the localized FIR emission associated with active star formation. This can be seen in Figures 12a and 12b, where the dust temperature at the center of the cluster is K, higher than the average temperature derived for cluster galaxies using the FIR color alone.
Figure 11 indicates that collisional heating of dust grains in the sample galaxies has a negligible effect on the observed FIR emission, allowing us to place a loose constraint on the dust column density. For example, the mean FIR color temperature for the cluster galaxies is K (see Figure 10), indicating g cm-2. For the typical values of and in Figure 12b, the derived dust temperatures are not sufficient to account for the observed FIR color temperature, particularly in the Ring region, where falls below K. If we assume a limiting value of g cm-2, then the collisional heating rate is of the optical heating rate at Mpc and of the optical heating rate at Mpc. The lower limit of given above indicates that large dust grains are primarily responsible for the FIR emissivity.
6.4.2 Gas and Dust Stripping
Spiral galaxies in rich clusters show a marked HI gas deficiency when compared with isolated field spiral galaxies (Giovanelli & Haynes 1985; Cayette et al. 1990). The mechanisms used to explain stripping include ram pressure (Gunn & Gott 1972), turbulent viscosity (Nulsen 1982), tides during galaxy-galaxy interaction (e.g., Richstone 1975; Merrit 1983), or thermal evaporation (Cowie & Songaila 1977). More recent studies have suggested that the inner disk of molecular gas remains intact as it is more strongly bound to the galaxy (Kenney & Young 1986; Cayatte et al. 1994; Perea et al. 1997; Bicay & Giovanelli 1987). Contursi et al. (2001) have found that HI deficient galaxies in Coma and A1367 generally have comparable dust masses to HI-normal galaxies.
The FIR emission for cluster galaxies in our sample is independent of radial distance in agreement with that found in other cluster samples (e.g., Rengarajan, Karnik, & Iyengar 1997). The apparent flatness of the FIR luminosity-radius correlation does not address directly the question of the gas and dust content of the galaxies since a system with globally low gas content could have localized star formation producing the same levels of FIR emission as a gas-rich system with modest levels of global star formation. While higher resolution data can better address this question, optical (e.g, H), mm (e.g., CO), and radio (e.g., HI 21 cm) tracers indicate that galaxies have lower cold gas content toward the central regions of clusters. This trend, if it is exists in our sample, does not affect the observed FIR emission.
The flat FIR luminosity-radius correlation seen in Figure 6 suggests that changes in the environment within Mpc do not have a significant impact on the FIR emission. The cluster-to-cluster variation in the FIR luminosity–radius correlation is shown in Figure 13 for of the clusters. A262 and AWM7 have few detected sources above our luminosity cutoff, and any trend will be unclear given the few data points for these two clusters. For the remaining clusters, the FIR luminosity is relatively flat with radius.

The distinct lack of detected radio and FIR sources in the Virgo cluster core could be a result of severe FIR suppression (Figure 14a). This reduction in FIR luminosity is correlated with HI deficiency in the Virgo galaxies studied by Doyon & Joseph (1989)—many of which fall within our Core region—and who quote a factor of 3 decrease in star formation as a result. The recent H imaging study of Virgo spiral galaxies by Koopmann & Kenney (2002) indicates that almost all show evidence for truncated star formation. The FIR emission for Ring Virgo galaxies appears to weakly decrease with radius (Figure 14a), and may be expected if the diffuse cold dust component is stripped in the higher density regions of the cluster, leaving only the warm component to dominate the FIR luminosity. To test for this effect, we compute (FIR color) versus radius for the flux-limited sample of Virgo late-type galaxies (Figure 14b). Stripping of cold dust should yield warmer FIR colors toward the cluster center, but this is not seen in Figure 14b. We conclude that cold dust stripping, if it exists in the Virgo cluster, does not affect the FIR emission.


6.5. Radio Enhancement
The value is not affected by any increase or decrease in the star formation rate of a galaxy as the radio and FIR emission are directly proportional to this rate. Our observation of a -radius correlation and lack of FIR luminosity-radius correlation (§4.3) indicate that changes in star formation rates are not responsible for the increase in radio luminosity of sources toward the center of the composite cluster. Tidally-induced star formation is therefore not a dominant mechanism in increasing the radio emissivity of sources toward the center clusters.
While there are relatively few mechanisms that can only affect the observed FIR emission, radio enhancement with nominal FIR emissivity can occur in a number of ways, including ram-pressure and thermal magnetospheric compression, and elevated AGN activity. Each of these possibilities is discussed below.
6.5.1 Ram Pressure Magnetospheric Compression
Ram pressure magnetospheric compression can occur if a galaxy has sufficient velocity through the ICM causing the gas on the leading edge of the galaxy to be compressed. The magnetic field coupled to the gas will also be compressed, resulting in increased synchrotron emission. Alternatively, thermal compression occurs when the pressure of the ICM itself is enough to compress the magnetic field to the point where it may affect the observed synchrotron emission (see below).
The effects of ram pressure are assessed by computing the line-of-sight velocity deviation of each galaxy from the cluster velocity normalized by the cluster velocity dispersion:
referred to as the “relative velocity” of each galaxy (see Miller & Owen [2001a], eq. [3]). We have obtained the cluster velocity dispersion data for the Abell sources from Struble & Rood (1999). The velocity dispersion of AWM7 and Virgo were obtained from Koranyi et al. (1998) and Fadda et al. (1996), respectively. The velocity dispersion of AWM7 shows a weak radial profile, with km s-1 lower in the inner Mpc. Since our sample extends to Mpc, we adopt the dispersion velocity found for the outskirts of the cluster ( km s-1). A summary of the adopted cluster velocity dispersions is given in Table 1.
Figure 15 shows the distribution of values as a function of relative velocity for the cluster galaxies, with separate emphasis on early and late-type galaxies. The deficit of galaxies in the lower right-hand corner of Figure 15 is due to projection effects, since some of those galaxies with a large cluster velocity may have small line-of-sight velocity if the direction of motion is aligned perpendicular to the line-of-sight.

A significant contribution of ram pressure magnetospheric compression should manifest itself as an anti-correlation between the distribution and relative velocity. For early-type galaxies, we find a slope of (including radio AGNs). Excluding all early-type galaxies with radio-excess, the slope becomes zero. One might argue that excluding all radio-excess sources is not appropriate since some of the radio-excess in these galaxies may be due to ram pressure magnetospheric compression, particularly in light of the efficiency for ram pressure to increase synchrotron emission due to the dependence of the magnetic field. However, most of these sources do show evidence of powerful AGN activity and most are massive ellipticals with rather low relative velocity (Figure 15). Projection effects may also produce this effect, but it is unlikely that all radio-excess sources have velocities perpendicular to the line-of-sight. Therefore, the removal of these radio-excess sources is warranted given the apparently distinct source for radio-emission. Hence, there is no obvious trend indicating that increased velocity among elliptical galaxies results in increased radio emission.
One caveat is as follows. Low velocity ellipticals in dense environments will have a longer interaction time with neighboring galaxies. The result may be increased gas accumulation in the major component of the interaction, leading to an increase in the intensity and/or duration of star formation activity and/or result in elevated AGN activity. Our data suggest that tidally-induced star formation is not a major contributor to the enhancement of radio emission in most non-cD elliptical galaxies. Assuming this to be the case, it is unlikely that a longer interaction time is important in increasing values for low-velocity galaxies in the Core region. The low-density environment characteristic of late-type galaxies (cf. §3) in the Ring argues against the possibility of increased radio emission due to longer interaction time: the velocity dispersion generally flattens out for large radii, whereas the density falls off rather rapidly as a power law (cf. eq. [5]).
The late-type galaxies exhibit a weak correlation between and , similar to the findings of Miller & Owen (2001a). Other studies have indicated little correlation between projected velocity and projected radius. As an example, there is great scatter between velocity and radius in the Coma cluster with no obvious relation between the two (Biviano et al. 1995). The statistics of our sample are such that we cannot make a secure determination for individual clusters, and the lack of a strong - correlation does not rule out the possibility that some of the radio emission from the cluster galaxies is due to ram-pressure enhancement of the magnetic field.
There are clear cases where ram pressure enhancement has a noticeable effect on the synchrotron power (e.g., Cayette et al. 1990). However, the effect, even if present on a large scale, may be difficult to observe. In particular, Miller & Owen (2001a) suggest several possibilities for non-gaussian motions in clusters, including bulk flows in clusters and cluster cooling flows. Projection effects may also weaken such a correlation if it exists. These effects, compounded with a lack of knowledge of the spatial coordinates of a galaxy with respect to the core of the cluster, all serve to muddle any correlation between and .
6.5.2 Thermal Compression
The observed radio enhancement among star forming late-type galaxies could result from magnetic field compression due to the thermal pressure of the ICM. Miller & Owen (2001a) find that thermal pressure can account for most, if not all, of the pressure required to produce the observed radio enhancement in their sample. The effects of thermal compression can be quantified by computing the increasing in synchrotron power due to the compression of the magnetic field as a result of external pressure. Following the analysis of Miller & Owen (2001a), the gas density distribution will follow the profile of equation (5), and the thermal pressure is
where is the temperature of the gas and for a gas of pure hydrogen. The synchrotron power is directly proportional to the pressure on the gas which, in the cluster, can be thought of as the sum of two pressures:
Here, refers to the pressure due to the ambient magnetic field of the galaxy if it were not located in the cluster, refers to the thermal pressure provided by the ICM, and refers to the value of the magnetic field that would produce such a total pressure. The ratio of the synchrotron luminosity in the cluster () to that of the same galaxy in the field () can then be written as
The dashed curve in Figure 6b represents the expected value of as a function of radius, where we have made the following assumptions. First, similar to Miller & Owen (2001a), we have assumed the -model parameters for Coma as deduced by Mohr et al. (1999), as it is most representative of relaxed clusters ( Mpc, , g cm-3, and keV). Secondly, we have assumed that a typical field spiral galaxy has a magnetic field of G. For these values, the thermal pressure is dyn cm-2 at Mpc from the cluster center, approximately times that of the magnetic pressure associated with a G field. Equation (14) can be normalized by assuming that the mean radio luminosity at Mpc is W Hz-1, according to the best-fit correlation (solid line) shown in Figure 6b, and that this value is comparable to the luminosity of field galaxies.
For this analysis, the model of radio luminosity expected due to thermal compression is in general agreement with the observed data. However, the dashed curve in Figure 6 should only be considered as representative of the effects that thermal pressure has on the synchrotron power. In particular, the normalization of the curve is subject to a number of factors, including the assumed field for spiral galaxies and the assumed model parameters. The extrapolation of the best-fit curve between radio luminosity and radius for the cluster sample out to Mpc may also be inaccurate as we have no data that samples the field environment around the clusters. We also note that the intrinsic scatter in the data makes it difficult to determine if the underlying correlation is truly nonlinear, as expected for thermal pressure effects, or if it is linear, as it appears in Figure 6b. Note that the density used in equation (14) is a deprojected quantity. Therefore, the dashed curve in Figure 6b increasingly overestimates the radio luminosity for decreasing radius. Correcting for this effect will bring the dashed curve downward toward the solid line for small radii (e.g., within the Core region). In summary, we find that thermal compression could explain the relative change in the radio luminosities of cluster galaxies located within Mpc of cluster centers.
6.6. Delayed Harassment and Frequency of Radio-Excess Sources
A recent model of galaxy-galaxy interaction has been proposed by Lake, Katz, & Moore (1998). They carry out numerical simulations of disk galaxies in rich cluster environments and show that galaxy “harassment” by many galaxy-galaxy interactions can drive up to 90% of the gas into the inner pc. This gas infall can lead to radio enhancement by (1) fueling AGNs (see §6.5.3) and/or quasars in low-luminosity hosts (Lake, Katz, & Moore 1998), or (2) nuclear starburst activity (e.g., Fujita 1998). As discussed previously, we can rule out (2) being the sole mechanism in producing the correlations discussed in §4.3 since it only affects the star formation rate.
While harassment is dominant in only the densest cluster environments (e.g., cluster cores), the effects of harassment may also influence the Ring population as they may not fully materialize until some time has passed. If AGN activation is immediate due to gravitational, hydrodynamic, or magnetodynamic perturbation, then we should expect sources with lower values to have the largest relative velocity. Figure 15 suggests the opposite is true, but testing this would require disentangling projection effects (see §6.5.1).
We note that the Core crossing time is Gyr for a galaxy with a relative cluster velocity of km sec-1 (similar to the velocity dispersion), much longer than the disk crossing time of about Myr for a starburst. Consequently, simple delayed harassment is an unlikely cause for the observed correlation between and , as the induced activity should dissipate by the time galaxies enter the Ring region. A more complicated model of harassment (e.g., such as one that includes the presence of cluster substructure) may be needed to explain both the correlation between and and the wide-spread behavior of the mid-IR sources.
The radio-excess fraction among cluster galaxies is times higher than that among IR-selected field galaxies. The sources in the spectroscopically confirmed AGN sample of Miller & Owen (2001a) show a correlation between and similar to that of the star forming galaxies, suggesting that some of the radio emission in AGN sources is due to normal star formation in the disk of the galaxy (Roy et al. 1998; Baum et al. 1993). It is therefore plausible that the enhancement in radio emission due to thermal pressure is sufficient to increase the radio luminosity of AGN hosts such that they fall above the threshold to be considered a radio-excess object. In particular, the effects of thermal pressure result in a mean radio luminosity that is 4 times greater in the Core than in the Ring region, implying a reduction in value of dex. The radio-excess sources with may not have been observed as radio-excess sources if they were in the field, implying an observed radio-excess fraction of (excluding cD galaxies), which is still larger than, but consistent with, the radio-excess fraction found by YRC (). Note that despite the possible effects of radio enhancement via thermal compression in our sample, the large majority of the observed radio-excess sources () are AGNs.
7. Conclusions
We have studied the effects of the cluster environment on the star formation and AGN activity in cluster galaxies. To accomplish this, radio and FIR data were compiled for a luminosity-limited sample of 114 cluster galaxies in the most massive, nearby ( Mpc) X-ray clusters. The selection based on X-ray luminosity ensures that we are including only the most massive and dynamically-related clusters, and is a direct probe of the state of the intracluster gas. The seven clusters studied are A262, AWM7, A426, A1060, A1367, Virgo, and Coma. The main conclusions from this study are as follows:
1. The radio-FIR correlation for the luminosity-limited sample shows almost three times the scatter in the correlation for field galaxies. An examination of the logarithmic FIR-radio flux density ratio () reveals that this scatter is mainly due to radio-excess () sources, of which show evidence of AGN activity. Including these extreme sources, we find . The larger cluster sample of Miller & Owen (2001a) has , lower than our value, and is likely due to their selection based strictly on radio emission. Similar field samples show (YRC).
2. The radio-excess fraction in the Core region of the composite cluster ( Mpc; ) is larger than that found in the Ring region ( Mpc; ), which is in turn larger than that found in the field (), indicating a correlation with cluster position. We find a positive correlation between and (clustercentric distance), and this is a result of radio enhancement toward the center of clusters. The Miller & Owen (2001a) sample also indicates enhanced radio emission by a factor of among core galaxies.
3. We have computed the IR and radio cluster LFs. The excess of cluster sources above the field radio LF at high luminosity, as well as the excesses observed for the YRC sample and UGC sample all suggest that radio-luminous AGNs contribute more to the radio luminosity density in the cluster environment than they do in the field.
4. The radio and morphological distributions indicate that radio-luminous and early-type galaxies, respectively, are clustered in the Core region. We find no evidence that the increase in density is due to a change in the underlying density-morphology relation due to our radio and FIR selection criteria. Rather, we are tracing only a subset of optically-identified early-type galaxies. Consequently, the increase in early-type density in the Core region reflects the existing density-morphology relation for all cluster galaxies.
5. As more massive galaxies may be more efficient radio and IR emitters, we have investigated the possibility of mass segregation in our sample by compiling -band magnitudes for all candidate sources. Based on the analysis of the time-averaged evolution of the composite cluster, we find that massive galaxies are not preferentially clustered in the Core region. It is therefore likely that the radio-luminous elliptical galaxies were formed in the Core region.
6. An examination of the IRAS colors of the cluster population indicates that radio-excess sources have warmer mid-IR colors than the normal cluster and field populations, consistent with a model in which dust is heated in the circumnuclear region by an AGN. We have independently analyzed the Miller & Owen (2001a) radio-selected sample and find that the frequency of AGNs among their radio-excess sources is .
7. ICM electron-dust collisions do not play a significant role in heating the dust in most cluster galaxies. The flat FIR luminosity-radius relation suggests that environmental effects within the virial radii of clusters do not have a significant impact on the FIR emission, despite the factor of decrease in density from the center of the cluster to virial radius ( Mpc).
8. Among the mechanisms resulting in increased radio emission, we cannot rule out a contribution from ram pressure enhancement of synchrotron emission. We find that thermal compression of a galaxy’s ISM by the intracluster medium could also explain the relative enhancement in the radio luminosity of centrally-located galaxies compared with those at Mpc. Thermal compression may increase the synchrotron emission from the disk of a galaxy and push radio-luminous AGNs into the radio-excess regime. We argue based on a timescale argument that simple delayed harassment is an unlikely cause for the observed correlations, and a more complicated model including cluster substructure may be needed.
References
- Abell, Corwin, & Olowin (1989) Abell, G. O., Corwin, H. G., & Olowin, R. P. 1989, ApJS, 70, 1
- Anderson & Owen (1995) Anderson, V., & Owen, F. N. 1995, AJ, 109, 1582
- Bahcall (1973) Bahcall, N. A. 1973, ApJ, 183, 783
- Bahcall & Lubin (1994) Bahcall, N. A., & Lubin, L. M. 1994, ApJ, 426, 513
- Bai & Lee (2001) Bai, J. M., & Lee, M. G. 2001, ApJ, 548, 244
- Baum et al. (1993) Baum, S. A., O’Dea, C. P., Dallacassa, D., de Bruyn, A. G., & Pedlar, A. 1993, ApJ, 419, 553
- Baum et al. (1997) Baum, S. A., O’Dea, C. P., Giovannini, G., Cotton, W. B., de Koff, S., Feretti, L., Golombek, D., Lara, L., Macchetto, F. D., Miley, G. K., Sparks, W. B., Venturi, T., & Komissarov, S. S. 1997, ApJ, 483, 178
- Bell (2002) Bell, E. F. 2002, preprint (astro-ph/0212121)
- Bicay & Giovanelli (1987) Bicay, M. D., & Giovanelli, R. 1987, ApJ, 321, 645
- Binggeli, Sandage, & Tammann (1985) Binggeli, B., Sandage, A., & Tammann, G. A. 1985, AJ, 90, 1681
- Biviano et al. (1995) Biviano, A., Durret, F., Gerbal, D., Le Fvre, O., Lobo, C., Mazure, A., & Slezak, E. 1995, A&Ap, 297, 610
- Bonatto et al. (1996) Bonatto, C., Bica, E. Pastoriza, M. G., & Alloin, D. 1996, A&AS., 118, 89
- Boselli et al. (1997) Boselli, A., Tuffs, R. J., Gavazzi, G., Hippelein, H., & Pierini, D. 1997, A&AS, 121, 507
- Bravo-Alfaro (2000) Bravo-Alfaro, H., Cayatte, V., van Gorkom, J. H., & Balkowski, C. 2000, AJ, 119, 580
- Bregman, McNamara, & O’Connell (1990) Bregman, J. N., McNamara, B. R., & O’Connell, R. W. 1990, ApJ, 351, 406
- Cavaliere & Fusco-Femiano (1976) Cavaliere, A., & Fusco-Femiano, R. 1976, A&Ap, 49, 137
- Cayette et al. (1990) Cayette, V., van Gorkum, J. H., Balkowski, C., & Kotanyi, C. 1990, AJ, 100, 604
- Cayette et al. (1994) Cayette, V., Kotanyl, C., Balkowski, C., & van Gorkom, J. H. 1994, AJ, 107, 1003 & Davoust, E. 1999, A&Ap, 345, 81
- Colless & Dunn (1996) Colless, M., & Dunn, A. M. 1996, ApJ, 458, 435
- Condon (1987) Condon, J. J. 1987, ApJS, 65, 485
- Condon (1989) Condon, J. J. 1989, ApJ, 338, 13
- Condon (1992) Condon, J. J. 1992, ARA&A, 30, 575
- Condon, Anderson, & Helou (1991a) Condon, J. J., Anderson, M. L., & Helou, G. 1991, ApJ, 376, 95
- Condon & Broderick (1988) Condon, J. J., & Broderick, J. J. 1988, AJ, 96, 30
- Condon et al. (1998) Condon, J. J., Cotton, W. D., Greison, E. W., Yin, Q. F., Perley, R. A., et al. 1998, AJ, 115, 1693
- Condon, Cotton, & Broderick (2002) Condon, J. J., Cotton, W. D., & Broderick, J. J. 2002, AJ, 124, 675
- Conselice, Gallagher, & Wyse (2001) Conselice, C. J., Gallagher, J. S., Wyse, R. F. G. 2001, AJ, 122, 228
- Contursi et al. (2001) Contursi, A., Boselli, A., Gavazzi, G., Bertagna, E., Tuffs, R., & Lequeux, J. 2001, A&A, 365, 11
- Cotton & Condon (1998) Cotton, W. D., & Condon, J. J. 1998, in Observational Cosmology with the New Radio Surveys, ed. M. N. Bremer et al. (Dordrecht:Kluwer), 45
- Cowie & Songaila (1977) Cowie, L., & Songaila, A. 1977, Nature, 266, 501
- David, Jones, & Forman (1996) David, L. P., Jones, C., & Forman, W. 1996, ApJ, 473, 692
- de Grijp et al. (1985) de Grijp, M. H. K., Miley, G. K., Lub, J., & de Jong, T. 1985, Nature, 314, 240
- de Jong et al. (1990) de Jong, T., Norgaard-Nielson, H. U., Hansen, L., Jorgensen, H. E. 1990, A&A, 232, 317
- de Koff et al. (2000) de Koff, S., Best, P., Baum, S. A., Sparks, W., Röttgering, H., Miley, G., Golombek, D., Macchetto, F., & Martel, A. 2000, ApJS, 129, 33
- Donnelly et al. (1998) Donnelly, R. H., Markevitch, M., Forman, W., Jones, C., David, L. P., Churazov, E., & Gilfanov, M. 1998, ApJ, 500, 138
- Doyon & Joseph (1989) Doyon, R., & Joseph, R. D. 1989, MNRAS, 239, 347
- Dressler (1980) Dressler, A. 1980, ApJ, 236, 351
- Durret et al. (1993) Durret, F., Boisson, C., Petitjean, P., & Bergeron, J. 1993, A&AS, 98, 365
- Edge et al. (1990) Edge, A. C., Stewart, G. C., Fabian, A. C., & Arnaud, K. A. 1990, MNRAS, 245, 559
- Efstathiou et al. (2000) Efstathiou, A., Rowan-Robinson, M., & Siebenmorgen, R. 2000, MNRAS, 313, 734
- Ettori, Fabian, & White (1998) Ettori, S., Fabian, A. C., & White, D. A. 1998, MNRAS, 300, 837
- Fadda et al. (1996) Fadda, D., Girardi, M., Giuricin, Mardirossian, F., & Mezzetti, M. 1996, ApJ, 473, 670
- Felten (1976) Felten, J. E. 1976, ApJ, 207, 700
- Felten et al. (1966) Felten, J. E., Gould, R. J., Stein, W. A., & Woolf, N. J. 1966, ApJ, 146, 955
- Feretti & Giovannini (1987) Feretti, L., & Giovannini, G. 1987, A&Ap, 182, 15
- Ferguson & Sandage (1988) Ferguson, H. C., & Sandage, A. 1988, AJ, 96, 1520
- Fujita (1998) Fujita, Y. 1998, ApJ, 509, 587
- Gavazzi & Boselli (1999) Gavazzi, G., & Boselli, A. 1999, A&Ap, 343, 93
- Giovanelli & Haynes (1985) Giovanelli, R., & Haynes, M. P. 1985, ApJ, 292, 404
- Gomez et al. (2002) Gomez, P. L., Nichol, R. C., Miller, C. J., Balogh, M. L., Goto, T., Zabludoff, A. I., et al. 2002, preprint (astro-ph/0210193)
- Goudfrooij & de Jong (1995) Goudfrooij, P., & de Jong, T. 1995, A&A, 298, 784
- Gunn & Gott (1972) Gunn, J. E., & Gott, J. R. 1972, ApJ, 176, 1
- Helou et al. (1988) Helou, G., Khan, I. R., Malek, L., & Boehmer, L. 1988, ApJS, 68, 151
- Hildebrand (1983) Hildebrand, R. D. 1983, QJRAS, 24, 267
- Holtzman et al. (1992) Holtzman, J. A., Faber, S. M., Shaya, E. J., Lauer, T. R., Grothe, J., Hunder, D. A., Baum, W. A., Ewald, S. P., Hester, J. F., Light, R. M., Lynds, C. R., O’Neil, E. J. Jr., & Westphal, J. A. 1992, AJ, 103, 691
- Irwin, Stil, & Bridges (2001) Irwin, J. A., Stil, J. M., & Bridges, T. J. 2001, MNRAS, 328, 359
- Ji et al. (2000) Ji, L., Chen, Y., Huang, J. H., Gu, Q. S., & Lei, S. J. 2000, A&Ap, 355, 922
- Kenney & Young (1986) Kenney, J. D. P., & Young, J. S. 1986, ApJ, 301, L13
- Koopmann & Kenney (2002) Koopmann, R. A., & Kenney, J. D. P. 2002, preprint (astro-ph/0209547)
- Koranyi & Geller (2000) Koranyi, D. M., & Geller, M. J. 2000, AJ, 119, 44
- Koranyi et al. (1998) Koranyi, D. M., Geller, M. J., Mohr, J. J., & Wegner, G. 1998, AJ, 116, 2108
- Lake, Katz, & Moore (1998) Lake, G., Katz, N., & Moore, B. 1998, ApJ, 495, 152
- Lester et al. (1995) Lester, D. F., Zink, E. C., Doppmann, G. W., Gaffney, N. I., Harvey, P. M., & Smith, B. J. 1995, ApJ, 439, 185
- Lisenfeld, Volk, & Xu (1996) Lisenfeld, U., Volk, H. J., & Xu, C. 1996, A&Ap, 314, 745
- Merrit (1983) Merrit, D. 1983, ApJ, 264, 24
- Miller & Owen (2001) Miller, N. A., & Owen, F. N. 2001a, AJ, 121, 1903
- Miller & Owen (2001) Miller, N. A., & Owen, F. N. 2001b, ApJS, 134, 355
- Mohr, Mathiesen, & Evrard (1999) Mohr, J. J., Mathiesen, B., & Evrard, A. E. 1999, ApJ, 517, 627
- Moss & Whittle (1993) Moss, C., & Whittle, M. 1993, ApJ, 407, L17
- Moss, Whittle, & Pesce (1998) Moss, C., Whittle, M., & Pesce, J. E. 1998, 300, 205
- Neugebauer et al. (1984) Neugebauer, G., Habing, H. J., van Duinen, R., Aumann, H. H., Baud, B., et al. 1984, ApJ, 278, L1
- Neumann et al. (2001) Neumann, D. M., Arnaud, M., Gastaud, R., Aghanim, N., Lumb, D., Briel, U. G., Vestrand, W. T., Stewart, G. C., Molendi, S., & Mittaz, J. P. D. 2001, A&Ap, 365, L74
- Niklas, Klein, & Wielebinski (1995) Niklas, S., Klein, U., & Wielebinski, R. 1995, A&Ap, 293, 56
- Nulsen (1982) Nulsen, P. J. E. 1982, MNRAS, 198, 1007
- Owen, Ledlow, & Keel (1996) Owen, F. N., Ledlow, M. J., & Keel, W. C. 1996, AJ, 111, 530 548, 213
- Perea et al. (1997) Perea, J., Del Olmo, A., Verdes-Montenegro, L., & Yun, M. S. 1997, ApJ, 490, 166
- Price & Duric (1992) Price, R., & Duric, N. 1992, ApJ, 401, 81
- Rengarajan, Karnik, & Iyengar (1997) Rengarajan, T. N., Karnik, A. D., & Iyengar, K. V. K. 1997, MNRAS, 290, 1
- Rhee, Burns, & Kowalski (1994) Rhee, G., Burns, J. O., & Kowalski, M. P. 1994, AJ, 108, 1137
- Richstone (1975) Richstone, D. O. 1975, ApJ, 200, 535
- Richter (1989) Richter, O.-G. 1989, A&Ap Suppl. Ser., 77, 237
- Roy et al. (1998) Roy, A. L., Norris, R. P., Kesteven, M. J., Troup, E. R., & Reynolds, J. E. 1998, MNRAS, 301, 1019
- Sambruna, Eracleous, & Mushotzky (1999) Sambruna, R. M., Eracleous, M., & Mushotzky, R. F. 1999, ApJ, 526, 60
- Schechter (1976) Schechter, P. 1976, ApJ, 203, 297
- Schindler, Binggeli, & Böhringer (1999) Schindler, S., Binggeli, B., & Böhringer, H. 1999, A&Ap, 343, 420
- Schmidt (1968) Schmidt, M. 1968, ApJ, 151, 393
- Scodeggio & Gavazzi (1993) Scodeggio, M., & Gavazzi, G. 1993, ApJ, 409, 110
- Soifer et al. (1989) Soifer, B. T., Boehmer, L., Neugebauer, G., & Sanders, D. B. 1989, AJ, 98, 766
- Struble & Rood (1999) Struble, M. F., & Rood, H. J. 1999, ApJ, 125, 35
- Tamura et al. (2000) Tamura, T., Makishima, K., Fukazawa, Y., Ikebe, Y., & Xu, H. 2000, ApJ, 535, 602
- Vermeulen, Readhead, & Backer (1994) Vermeulen, R. C., Readhead, A. C. S., & Backer, D. C. 1994, ApJ, 430, 41
- Vron-Cetty & Vron (1996) Vron-Cetty, M. P., & Vron, P. 1996, ESO Scientific Report No. 17
- Young et al. (1995) Young, J. S., Xie, S., Tacconi, L., Knezek, P., Viscuso, P., Tacconi-Garman, L., Scoville, N. Z., et al. 1995, ApJS, 98, 219
- Yun et al. (2000) Yun, M. S., Carilli, C. L., Kawabe, R., Tutui, Y., Kohno, K., & Ohta, K. 2000, ApJ, 528, 171
- Yun, Reddy, & Condon (2001) Yun, M. S., Reddy, N. A., & Condon, J. J. 2001, ApJ, 554, 803 (YRC)
- Zhao et al. (1991) Zhao, J. L., Huang, S. N., Pan, R. S., & He, Y. P. 1991, in Chinese Astronomy and Astrophysics, 15:Sep, 260
- Zirbel & Baum (1995) Zirbel, E. L., & Baum, S. A. 1995, ApJ, 448, 521