A search for disks around massive young stellar objects
Abstract
We present subarcsecond observations at 2.7 and 1.4 mm of a sample of massive young stellar objects made with the BIMA millimetre array. For most sources the continuum emission on the smallest scales at 2.7 mm is dominated by free-free emission from the stellar wind or jet. Strong emission at 1.4 mm shows the presence of significant dust associated with Cep A and GL 490 but our resolution is not sufficient to resolve any structure. The 2.7-mm emission from GL 490 is resolved but it is not clear whether we are seeing a single circumstellar disk or a secondary companion, although near-infrared data support the disk hypothesis. Estimates of the dust mass yield values of 1–4 M⊙ within radii of 150 to 1000 AU.
Univ of Maryland, Dept of Astronomy, College Park, MD 20742, USA
Univ of Leeds, Dept of Physics and Astronomy, Leeds, LS2 9JT, UK
Univ of Maryland, Dept of Astronomy, College Park, MD 20742, USA
Max Planck Institut für Radioastronomie, Auf dem Hügel 69, Bonn D-53121, Germany
1. Introduction
The existence of circumstellar disks around low-mass protostars is now well-established (Mundy, Looney & Welch 2000). However, the situation for their massive counterparts remains unclear. Indirect observational evidence for circumstellar disks around massive young stellar objects (YSOs) comes from the presence of bipolar outflows, polarization patterns and the presence of ionized winds extending in an equatorial direction (Hoare 2002). In one case, a model of the 7-mm emission shows that the data are consistent with a circumstellar disk with a diameter of 130 AU (Shepherd, Claussen & Kurtz 2001). Molecular emission line signatures of rotation have mostly been confined to larger and therefore non-circumstellar scales (e.g. Zhang, Hunter, & Sridharan 1998).
The question of whether or not circumstellar disks are present around massive stars is key in current theoretical debate. One important question is whether high-mass star formation is simply a scaled-up version of low-mass star formation where accretion onto the central star occurs via a disk. Direct observation of disks around massive YSOs is key to testing the theories for how massive stars form. It is therefore important to determine the circumstellar mass distribution around luminous YSOs.
2. Observations
We have used the Berkeley-Illinois-Maryland Association (BIMA: see Welch et al. 1996) millimetre array to observe a sample of 8 massive young stellar objects: GL 490, Cep A, NGC7538-IRS1, NGC7538-IRS9, G35.20.7N, GGD27-IRS, W75N and GL 2591. The observations were made in continuum bands at 2.7 mm (107 GHz) for all sources (except GGD27-IRS which was observed at 95 GHz) and 1.4 mm (216 GHz) for GL 490, Cep A and NGC7538-IRS1 only. Data were conventionally calibrated using a nearby phase calibrator, while fast-switching was employed in the more extended configurations (see Looney, Mundy & Welch 2000). In three sources (Cep A, NGC7538-IRS1 and G35.20.7N), the 107-GHz methanol maser was sufficiently strong to apply a self-calibration solution (the 95-GHz methanol maser was used for GGD27-IRS). The configurations used were A and B (at 2.7 mm) and B and C (at 1.4 mm), yielding an angular resolution varying from 0.3 arcsec (for Cep A, GL 490 and NGC7538-IRS1) to approximately 1 arcsec at 2.7 mm, which translates to a radius of 105 to 350 AU at the distance to our nearest source (Cep A). At 1.4 mm the angular resolution was 1.5–2.0 arcsec. The typical sensitivity was 3–8 mJy bm-1 at 2.7 mm, rising to 20–30 mJy bm-1 at 1.4 mm.
3. Results
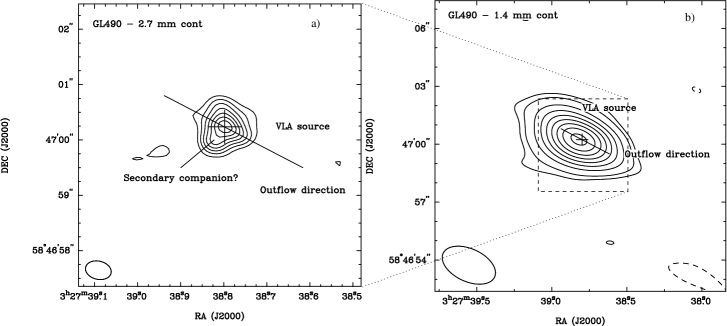
3.1. GL 490
Figure 1 shows the 2.7-mm and 1.4-mm continuum emission towards GL 490. The 2.7-mm emission arises from an elongated structure with dimensions 0.70.5 arcsec2, corresponding to 700500 AU2 at a distance of 1 kpc. The emission peaks on the position of the VLA source with an extension 0.3-arcsec to the south-east. It is not clear whether this represents part of a circumstellar disk around GL 490 or if it marks the location of a secondary companion. However, we note that the high-resolution -band speckle-interferometry image of Hoare, Glindemann & Richichi (1996) shows no evidence for multiplicity reinforcing the disk interpretation. The position angle of the 2.7-mm emission is in good agreement with the larger structures observed by Mundy & Adelman (1988) and more recently by Schreyer et al. (2002).
An image made using only the longest baselines yields a weak point source centred on the VLA position. The flux of this source is in good agreement with the predicted flux of the wind contribution at 2.7 mm indicating that the flux is dominated by the ionized wind on scales of 0.1 arcsec (100 AU) or less.
On the other hand, the 1.4-mm emission is dominated by dust, although our resolution is not high enough to resolve any structure. The image shown in Fig. 1b is consistent with a point source within the 2.41.1 arcsec2 beam.
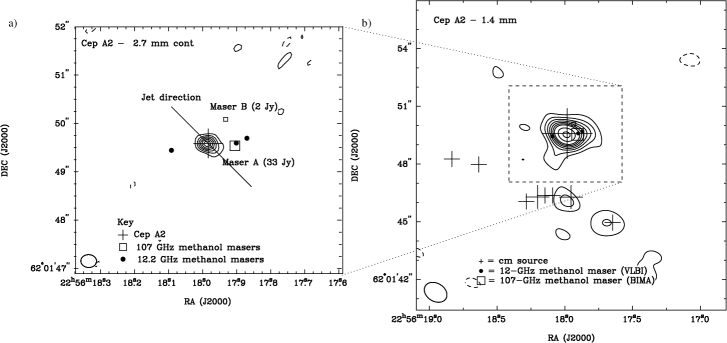
3.2. Cep A
Cep A2 is the well-known radio-jet source in the Cep A region. The 2.7-mm continuum shown in Figure 2a is slightly elongated along the direction of the jet with FWHM dimensions of 0.450.28 arcsec2 corresponding to 315200 AU2 at a distance of 700 pc. The emission at a resolution of 0.3 arcsec remains dominated by the ionized jet although images made using the more compact configurations reveal the presence of dust emission from the envelope. At 1.4 mm (Fig. 2b) the emission is dominated by Cep A2 although there appears to be some extended emission which encompasses the methanol masers to the west of Cep A2 with a further extension to the SE. This extended emission may represent the remnant flattened core from which Cep A2 formed. A Gaussian fit to the dust emission yields a slightly extended source with deconvolved dimensions of 0.80.5 arcsec2 (560350 AU2). Weak dust emission is also detected from two of the Cep A3 group of sources (3b and 3c: Garay et al. 1996).
While the water masers mostly cluster around Cep A2 itself, the methanol masers show no clear association with any particular source. Our BIMA observations clearly resolve the two 107-GHz maser spots of Mehringer et al. (1997) separate from Cep A2. The stronger maser coincides with one of the 12.2 GHz methanol masers, both spatially and spectrally.
3.3. Other sources
NGC7538-IRS1 is barely resolved at 2.7 mm: the ‘south spherical’ source of Gaume al. (1995) is discernible. The presence of this source complicates the spectrum making it difficult to disentangle the contributions from the dust and the ionized gas.
The strong 95-GHz methanol maser is detected towards GGD 27-IRS and resolved to be a single maser spot 9.2 arcsec north-north-east of the jet source. This position places the maser along the axis of the jet and it may arise in one of the jet shocks. The flux of GGD 27 is somewhat uncertain but is probably 50 mJy.
Not all of our mapped sources had strong compact emission at 2.7 mm. NGC7538-IRS9 and G35.20.7N were only weakly detected at the highest resolutions, and GL 2591 was not detected at all to a 3- sensitivity limit of 20 mJy in a 1-arcsec beam at 2.7 mm.
4. Analysis: dust emission around massive YSOs
Figure 3 plots the spectral energy distribution from radio through to millimetre wavelengths for four of our sources. Radio measurements were taken from the literature while the 2.7 and 1.4-mm points (filled squares) are from our data. The radio spectral index has been used to predict the contribution from the ionized wind at millimetre wavelengths and is shown by the straight lines in Fig. 3. In each case it is clear that dust emission has been detected even at 2.7 mm.

Accurate mass estimates require detailed modelling, but here we present simple estimates of the total mass assuming that the dust emission is optically thin and is at a uniform temperature of 75 K (see, e.g., Mundy & Adelmann 1988). We take the dust emissivity to be the same as that used by Looney et al. (2000) for low-mass sources. Note that the mass estimates roughly scale linearly (but inversely) with temperature. In all cases the mass estimate is of order 1–4 M⊙ within a region 1 arcsec in diameter (see Table 1).
While it would be a nice result to be able to claim that we have detected disks around these massive YSOs, in practice our resolution and sensitivity are not high enough to determine whether the emission comes from flattened disk-like structures or from a larger-scale envelope. At 2.7 mm images of both GL 490 and Cep A2 made with just the very longest baselines of the A configuration show unresolved sources (0.2 arcsec FWHM) which are consistent with emission from the ionized stellar wind. For GL 490 the wind contribution of 25 mJy allows us to place an upper limit on the mass within a radius of 0.15′′ (or 150 AU) of 0.5 M⊙ (assuming the same dust properties as Table 1). In order to separate the dust emission on scales smaller than 0.2 arcsec, high-resolution observations at 1.4-mm (or shorter wavelengths) are required. Even then, discovery of a disk can not be claimed until a kinematic signature is observed. We are currently examining our line data but so far have not detected a clear rotation signature.
| Source | Flux (Jy) | Mass (M⊙) | Notes | ||
|---|---|---|---|---|---|
| 2.7 mm | 1.4 mm | 2.7 mm | 1.4 mm | ||
| GL 490 | 0.12 | 1.0 | 2.5 | 2.6 | |
| GGD27-IRS1 | 0.04 | – | 2.6 | – | |
| G35.20.7N | 0.02 | – | 1.8 | – | |
| GL 2591 | 0.02 | – | 0.4 | – | 1′′ beam |
| Cep A2 | 0.05 | 1.1 | 0.5 | 1.4 | |
| NGC7538-IRS1 | 0.87 | 2.6 | 143 | 54 | |
| NGC7538-IRS9 | 0.03 | – | 4.1 | – | |
5. Conclusions: the search for disks goes on
We have presented results from a search for dusty disks around a sample of massive YSOs. We have found that while dust is clearly present around these sources, the dust emission at 2.7 mm is too weak to separate from the free-free emission from the ionized wind. Our observations at 1.4-mm do not have sufficient resolution to probe the geometry, but do show that several solar masses of dusty material exist on scales of a 1000 to 2000 AU from the central source. The exception is GL 490 which we clearly resolve into an elongated structure with dimensions 0.70.5 arcsec2, or 700500 AU2. Although it is not possible for us to determine unambiguously whether this structure represents a circumstellar disk or if we are beginning to resolve a binary system, we note that the near-infrared speckle imaging of Hoare et al. (1996) revealed no evidence for multiplicity towards GL 490.
Future observations at 2.7 mm will need significantly higher sensitivity and resolution. A more promising approach is to employ observations at 1.4 mm or shorter wavelengths where the wind contribution will be negligible. In this respect the completion of CARMA (http://www.mmarray.org/) at its high-altitude site will mark the beginning of a new era in the search for disks around massive YSOs.
Acknowledgments
BIMA is funded by NSF grant AST-9981289.
References
Garay, G.M., Ramírez, S., Rodríguez, L.F., Curiel, S., Torrelles, J.M. 1996, ApJ, 459, 193
Gaume, R.A., Goss, W.M., Dickel, H.R., Wilson, T.L., Johnston, K.J. 1995, ApJ, 438, 776
Hoare, M.G. 2002, in ASP Conf. Ser. Vol. 267, The Earliest Stages of Massive Star Birth, ed P.A. Crowther (San Francisco: ASP), 137
Hoare, M.G., Glindemann, A., Richichi, A. 1996, in The Role of Dust in the Formation of Stars, ESO Proc, ed H.U. Käufl & R. Siebenmorgen (Berlin: Springer-Verlag), 35
Looney, L.W., Mundy, L.G., Welch, W.J. 2000, ApJ, 529, 477
Mehringer, D.M., Zhou, S., Dickel, H.R. 1997, ApJ, 475, L57
Mundy, L.G., Adelman, G. 1988, ApJ, 329, 907
Mundy, L.G., Looney, L.W., Welch, W.J. 2000, in Protostars and Planets IV, ed V.G. Mannings, A.P. Boss & S.S. Russell (Tucson: University of Arizona Press), 355
Schreyer, K., Henning, T., van der Tak, F.F.S., Boonman, A.M.S., van Dishoeck, E.F. 2002, A&A, 394, 561
Shepherd, D.S., Claussen, M.J., Kurtz, S.E. 2001, Science, 292, 1513
Welch, W.J., et al. 1996, PASP, 108, 93
Zhang, Q., Hunter, T.R., Sridharan, T.K. 1998, ApJ, 505, L151