THE FLUCTUATING INTERGALACTIC RADIATION FIELD AT REDSHIFTS Z = 2.3 – 2.9 FROM HE II AND H I ABSORPTION TOWARD HE 2347-4342
Abstract
We provide an in-depth analysis of the He II and H I absorption in the intergalactic medium (IGM) at redshifts = 2.3–2.9 toward HE 2347-4342, using spectra from the Far Ultraviolet Spectroscopic Explorer (FUSE) and the Ultraviolet-Visual Echelle Spectrograph (UVES) on the VLT telescope. Following up on our earlier study (Kriss et al. 2001, Science, 293, 1112), we focus here on two major topics: (1) small-scale variability () in the ratio N(He II)/N(H I); and (2) an observed correlation of high- absorbers (soft radiation fields) with voids in the (H I) Ly distribution. These effects may reflect fluctuations in the ionizing sources on scales of 1 Mpc, together with radiative transfer through a filamentary IGM whose opacity variations control the penetration of 1-5 ryd radiation over 30–40 Mpc distances. Owing to photon statistics and backgrounds, we can measure optical depths over the ranges and , and reliably determine values of over the range 0.1 to 460. Values are consistent with models of photoionization by quasars with observed spectral indices . Values may require additional contributions from starburst galaxies, heavily filtered quasar radiation, or density variations. Regions with may indicate the presence of local hard sources. We find that is higher in “void” regions, where H I is weak or undetected and 80% of the path length has . These voids may be ionized by local soft sources (dwarf starbursts) or by QSO radiation softened by escape from the AGN cores or transfer through the “cosmic web”. The apparent differences in ionizing spectra may help to explain the 1.45 Gyr lag between the reionization epochs of H I () and He II ().
1 INTRODUCTION
In the last decade, studies of the intergalactic medium (IGM) have been enhanced by high-resolution spectra of the Ly absorption lines of H I and He II. This pioneering work includes spectrographic studies of H I with the Keck telescope (Hu et al. 1995) and VLT (Kim, Cristiani, & D’Odorico 2001) and of He II by the Hubble Space Telescope (HST) (Jakobsen et al. 1994; Hogan, Anderson, & Rugers 1997; Heap et al. 2000; Smette et al. 2002) and the Hopkins Ultraviolet Telescope (HUT) (Davidsen, Kriss, & Zheng 1996). With FUSE111This work is based on FUSE data obtained for the Guaranteed Time Team by the NASA-CNES-CSA FUSE mission operated by the Johns Hopkins University under NASA contract NAS5-32985. Observations with the NASA/ESA Hubble Space telescope were supported by the Space Telescope Science Institute, operated by AURA under NASA contract NAS5-26555. The VLT/UVES observations were obtained at the Paranal Observatory of the European Southern Observatory for program No.166.A-0106(A). we are now able to obtain moderate-resolution spectra of He II absorption (Kriss et al. 2001, hereafter denoted KS01). Taken as a whole, these studies confirm the general theoretical picture (Cen et al. 1994; Zhang et al. 1995; Miralda-Escudé et al. 1996; Davé et al. 2001) of the IGM as a fluctuating distribution of baryons, organized by the gravitational forces of dark matter and photoionized by high-redshift quasars and starburst galaxies (Haardt & Madau 1996; Fardal, Giroux, & Shull 1998, hereafter denoted FGS98; Madau, Haardt, & Rees 1999).
Studies of absorption in the H I and He II Ly lines at 1215.670 Å and 303.782 Å respectively, are particularly important for understanding the transition of the high-redshift IGM from a neutral to ionized medium. In practice, the He II absorption becomes detectable in the far ultraviolet at redshifts with FUSE, and at with HST. The “reionization” epochs appear to occur at for H I (Becker et al. 2001; Djorgovski et al. 2001; Fan et al. 2002) and at in He II (Reimers et al. 1997; KS01; Smette et al. 2002).
The He II Ly absorption is generally much stronger than H I Ly, by a factor denoted by the parameter N(He II)/N(H I), predicted theoretically (FGS98) to be 50–100 for photoionization by quasar backgrounds. For optically thin lines, we can write . The greater strength of He II arises because it is harder to photoionize than H I, owing to lower fluxes and cross sections at its ionizing threshold ( eV), and because He III recombines 5-6 times faster than H II. Variations in can therefore be used to diagnose the sources and fluctuations of the metagalactic ionizing spectrum in both the continua of H I (1 ryd) and He II (4 ryd). The He II absorption is also a good diagnostic of absorption from low-density regions (“voids”) in the IGM. Because and , He II can be tracked into much lower density regions than H I. In principle, He II absorption can be used to probe hotter, collisionally ionized gas at K, produced by shock-heating (Cen & Ostriker 1999; Davé et al. 2001).
In our first paper (KS01), we analyzed FUSE observations of the fluctuating He II absorption toward the bright (V = 16.1) quasar HE 2347-4342 at redshift (Reimers et al. 1997; Smette et al. 2002). This object was discovered in the Hamburg/ESO survey for bright QSOs (Reimers, Köhler, & Wisotzki 1996) and is one of the brightest targets for FUV studies of He II, with specific flux erg cm-2 s-1 Å-1 at 1180 Å. The FUSE data include 376 ksec of observations between 1000–1187 Å, taken at orbital night with a resolving power . Using the H I Ly data from Keck/HIRES, we analyzed both He II and H I Ly forests over the interval . About 50% of the He II features had H I counterparts with column densities N cm-2. The He II to H I column density ratio ranged from 1–1000, with an average .
KS01 highlighted two major new results from the FUSE (He II) data: (1) the epoch of He II reionization appears to occur in this sightline at ; (2) the range in the He II/H I ratio () suggests that the ionizing background is highly variable throughout the IGM. Recent HST observations (Telfer et al. 2002) show a broad distribution in QSO spectral indices, from . Over the observed redshift interval, , the IGM toward HE 2347-4342 is “translucent” in He II, with optical depths fluctuating between and . Above , the IGM becomes relatively opaque in He II, except for three narrow transmission windows around 1160 Å () and 1175 Å () noted previously (Smette et al. 2002; KS01). Below , the general trend is that the IGM becomes more transparent, with , slowly decreasing at lower redshift.
Except for the high-opacity regions (), the observed He II optical depths and He II/H I ratios are in reasonable agreement with models of IGM photoionization by a QSO-type power-law spectrum, , with (Zheng et al. 1997; Telfer et al. 2002). Models of the He II/H I ratios in the IGM produced by QSO sources, filtered and reprocessed by the IGM, have been presented by FGS98 and Madau, Haardt, & Rees (1999). The high values () suggest additional contributions from softer ionizing sources (starburst galaxies) or heavily-filtered quasar radiation.
In this second paper on HE 2347-4342, we provide an in-depth analysis and scientific discussion of these same FUSE He II data, in combination with new optical H I data taken with the VLT/UVES spectrograph (D’Odorico et al. 2000). We describe here the characterization and subtraction of the background in the LiF (1000–1187 Å) channels of FUSE. An independent analysis of both the LiF and SiC channels (920–1000 Å) is described in a separate paper (Zheng et al. 2003). We compare FUSE and HST/STIS data over the common interval from 1150–1187 Å. We then analyze the He II and H I Ly absorbers, characterize their distributions in redshift and column density, and derive optical depths, and . The observed absorption ratios, , can be used to understand the photoionizing spectra of the sources of the metagalactic radiation. We also explore the nature of the “void He II absorption”, for which He II is an especially good probe. Finally, we address some of the open issues about the high- IGM, including the He II reionization epoch, the ionization history of the IGM, and the range of ionizing spectra in the gaseous voids and filaments.
The remainder of this paper is organized as follows. In § 2, we give details of our new FUSE data extraction and background subtraction. With the VLT data, we then derive the relevant parameters that characterize the two Ly forests (, , ). In § 3 we discuss the scientific implications of these observations for the IGM and its ionization state at , just after the apparent He II reionization epoch. We conclude in § 4 with a summary of the highlights of this new work and suggestions for future studies of He II with FUSE and HST.
2 DATA ANALYSIS
2.1 Provenance of the data
As described in KS01, HE 2347-4342 was observed with FUSE in two separate campaigns. The first observation, from 17 to 27 August 2000, comprised 351,672 s, 192,610 s during orbital night. The second campaign, running from 11 to 21 October 2000, accumulated 249,717 s, with 183,630 s during orbital night. For each observing campaign, HE 2347-4342 was centered in the apertures. To maintain optical alignment of the four channels during these campaigns, FUSE was offset every other day to the nearby UV-bright star WD2331-475 to perform routine adjustments to the mirror positions. FUSE has an effective resolution (Moos et al. 2000), which corresponds to a wavelength resolution element Å at 1000 Å. To avoid uncertainties in the effective spectrograph resolution and because the resolution element is highly oversampled, we bin our data to at least 0.05 Å. This is approximately the minimum linewidth of the H I features we examine.
We chose to neglect the wavelength range provided by the FUSE SiC detectors for two reasons. First, the SiC channels have a throughput that is 3 times less than that of the LiF channels ( Å). Second, the higher effective area SiC channels (1a and 1b) appear near the bottom edge of the detectors, so that it is impossible to obtain a background spectrum based on unilluminated regions that bracket the spectrum. Recently, Zheng et al. (2003) have succeeded in extracting a useful spectrum from the SiC channels by performing careful burst removal, pulse-height screening, and background modeling.
HE 2347-4342 was observed during four nights (October 7-9 and October 19, 2000) using the UVES installed at the second VLT Unit Telescope (Kueyen). Twelve exposures were made in the dichroic mode using standard settings for central wavelengths of 3460/4370 Å in the blue and 5800/8600 Å in the red. The integration time for each wavelength range was 6 60 min. With a slit width of 1 arcsec, the resulting spectral resolution is about 44,000. The raw frames were reduced at Quality Control Garching, using the UVES pipeline data reduction software (Ballester et al. 2000). Finally, the individual vacuum-barycentric corrected spectra were coadded, resulting in an effective S/N ratio of roughly 100 per 0.05 Å bin. When compared to the FUSE He II data, the H I spectrum is resampled to the same redshift vector and bin size; these sizes vary in our analysis from 0.05 to 0.2 Å (see § 2.3).
2.2 Data Calibration and Background Subtraction
The faint flux levels of our target present unusual challenges to the instrumental calibration of FUSE. We can simply apply stock flux corrections and wavelength solutions to our data with high confidence that these solutions are stable in time and insensitive to the source flux. However, the detector background correction that is usually applied to FUSE data by the CALFUSE pipeline (up to the latest version 2.2.1 as of August 2002) is insufficient to model correctly the spatial variations in the background for a source flux at erg cm-2 s-1 Å-1. In our 376 ksec of data, we collected roughly 5 - 20 source counts per 0.0067 Å column in the extracted source spectrum, spread over 50 - 100 rows in the 2D detector image. This faint source level distributed over a large detector area leaves 1-2 source + background counts per element in the illuminated regions of the detector image. This small source flux makes the background subtraction an unusually crucial piece of the overall calibration.
At the faint flux levels presented by HE 2347-4342, an accurate extraction of a background-subtracted, calibrated source spectrum from the two-dimensional recorded data required customized processing. We began our analysis with time-tagged photon lists representing all the data. We use only the nighttime data to avoid difficult problems related to scattered airglow light on the detectors. Up to the background subtraction, our analysis used the standard CALFUSE pipeline (v2.2.1) to process the photon lists, screen for and remove detector bursts, and create a 2D detector image. We applied the default CALFUSE day/night screening and truncated the range of detector pulse heights from channels 4 - 16 to minimize backgrounds. The resulting detector image has 16,384 “columns” (the direction) and 1024 “rows” (the direction). These elements represent the digital quantization of the analog positions of photons striking the photocathode in the FUSE microchannel plate detectors (Sahnow et al. 2000). In this analysis, we avoid the term “pixels” because FUSE quantizes an analog quantity instead of using literal “pixels” as in CCDs. At this step, we depart from the CALFUSE procedure to produce a customized background subtraction with the scheme described below.
Prior to constructing background vectors, for each channel/segment pair (LiF1a, LiF1b, LiF2a, LiF2b), we added all the columns by summing in . This summation reveals the positions of the source-illuminated regions, including residual airglow lines present during orbital night. It establishes the height of the rectangular extraction windows and the limits of the unilluminated background regions (see Table 1). We derive an -dependent background correction by taking unilluminated regions of the detector, above and below the illuminated source plus background region, and extracting a 1D background spectrum as a function of . This scheme gives us detailed information about the large spatial variations in the background, but requires averaging over the variations in that may occur beneath the illuminated portion.
To construct the 1D background spectrum for an extraction window
of height elements, we randomly drew elements (at each )
from the background windows and summed over the number of elements
in the extraction window. This sampling is done 300 times, and the
final background spectrum is the average of the 300 trials at each
position. For example, for LiF1a we randomly drew 80 bins from the 150
bins in the three available background windows. This sampling is done
300 times and the final background and uncertainty are drawn from the
average and 1 variation in the distribution of samples. The final
background vector approximates the number of background counts collected
in each row over the height of the extraction window. The random sampling
accounts for fluctuations with and assigns an error bar to
the background subtraction, which is propagated through our analysis. The
final calibration steps apply the CALFUSE wavelength and flux solutions.
For the FUSE data, we adopt the continuum determined from STIS/G140L data by KS01, adjusted to account for the contributions (at the 5% level) of an intervening Lyman-limit system at with N(H I) cm-2. This LL system makes a 5% contribution to the absorption at 1100 Å. The extrapolation gives close agreement in He II transmission in the region (1157–1180 Å) where our data and the STIS results (Smette et al. 2002) overlap. The full recovery of He II to this continuum in transmission windows near 1000 Å gives us confidence that this extrapolation is acceptable at these wavelengths.
The observations reported here push the limits of FUSE’s design capabilities and exceed the limitations of the CALFUSE automatic data-reduction software. Our custom reduction was made as simple and accurate as possible, with careful attention to systematic errors and stability of the background subtraction. It appears that the differences between the KS01 reduction and the current work are comparable to the differences between overlapping segments in our new extraction, which suggests that possible systematic errors associated with our background subtraction method and choice of extraction windows are well controlled. Furthermore, the differences between the October 2000 and August 2000 data and between LiF1 and LiF2 are consistent within statistical errors, and are not sensitive to the choices made in constructing the background spectrum. Table 2 shows the mean He II transmission over several wavelength bands, the results of a cross-check with earlier studies by STIS (Smette et al. 2002) and FUSE (KS01).
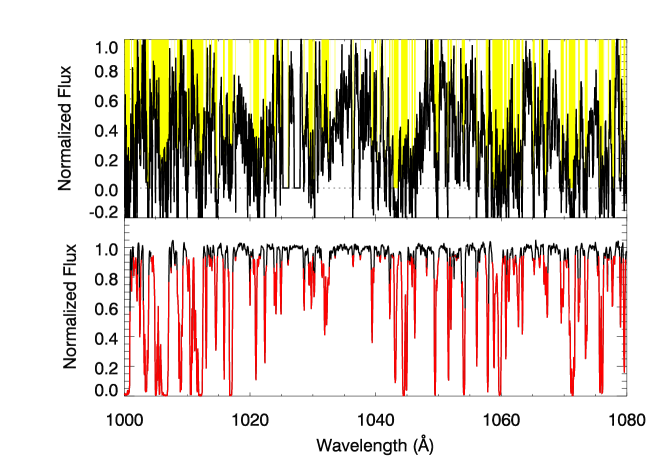
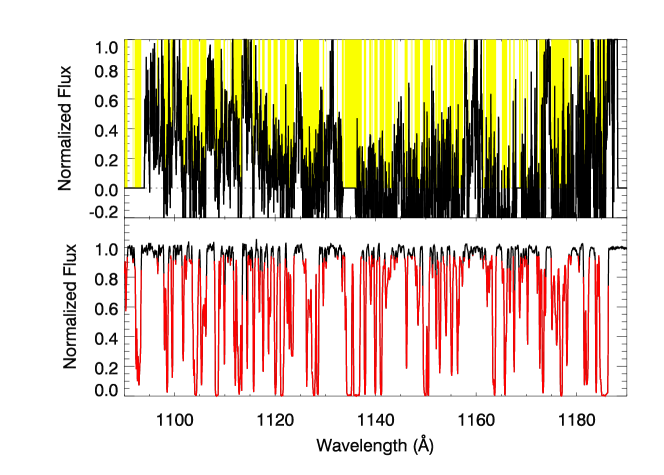
Figure 1 shows an overlay of the FUSE (He II) data with the VLT/UVES (H I) data. The H I wavelength scale has been divided by a factor of 4.00178 (the ratio of He II and H I rydberg constants is not precisely 4.0) to align the H I and He II absorbers. One clearly sees the much larger He II absorption () predicted by theory. Other notable features include the transmission windows around 1132 Å, 1160 Å, and 1175 Å, in close proximity to regions of high He II opacity. We also note the frequent voids in H I absorption.
Figure 2 shows the broad-band transmission in the He II Ly forest from 1000–1180 Å. As noted by KS01, this shows the expected increase in broadband transmission towards shorter wavelengths. However, on a fine-grained scale, Å, the He II opacity shows substantial variations. In our analysis, we use various bin sizes to explore the dependence of H I and He II opacity on resolution. The smallest bin size we use is 0.05 Å, or , which corresponds to the resolution element of FUSE.
2.3 The He II/H I Ratio ()
As defined, expresses the ratio of He II to H I column densities and can be used to infer properties of the ionizing radiation field. Owing to photon statistics and backgrounds, we believe that we can measure optical depths over the ranges in the FUSE data and with the VLT/UVES. These values correspond to 10% uncertainties (FUSE) and 2% uncertainties (VLT/UVES) in measuring the optical depths of either strong or weak lines. In this paper, unlike KS01, we do not make the assumption that He II absorption occurs in distinct lines. Instead of finding N(He II)/N(H I) from the column density ratio, we use the observed opacities per resolution element to define (the extra factor of 4 arises from bandwidth). As a consequence of these ranges for measuring optical depths, we can reliably determine values of between approximately 0.1 and 460.
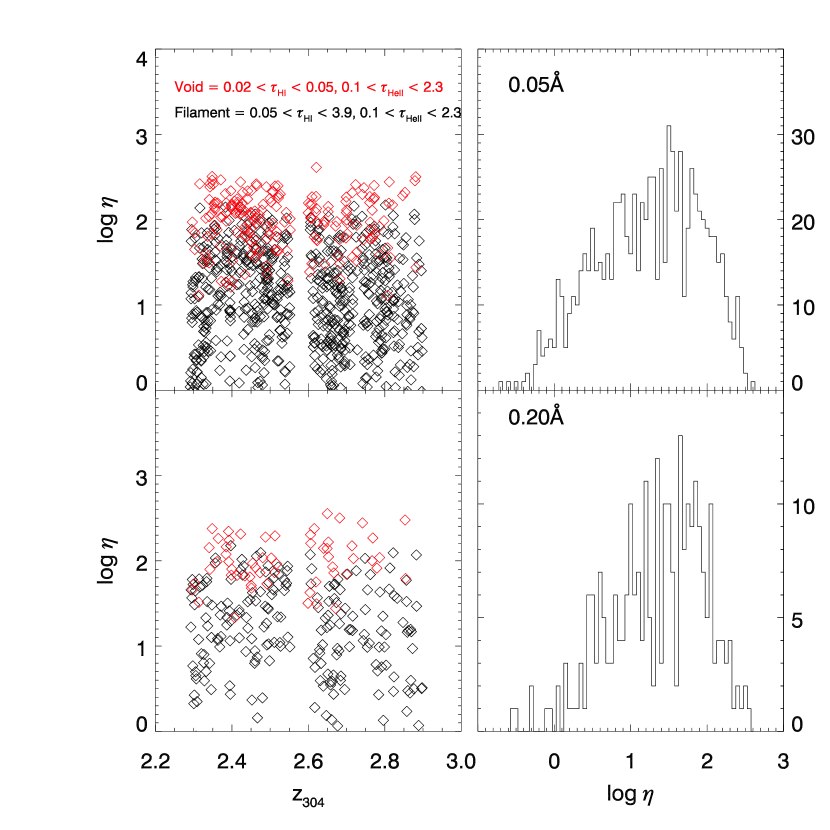
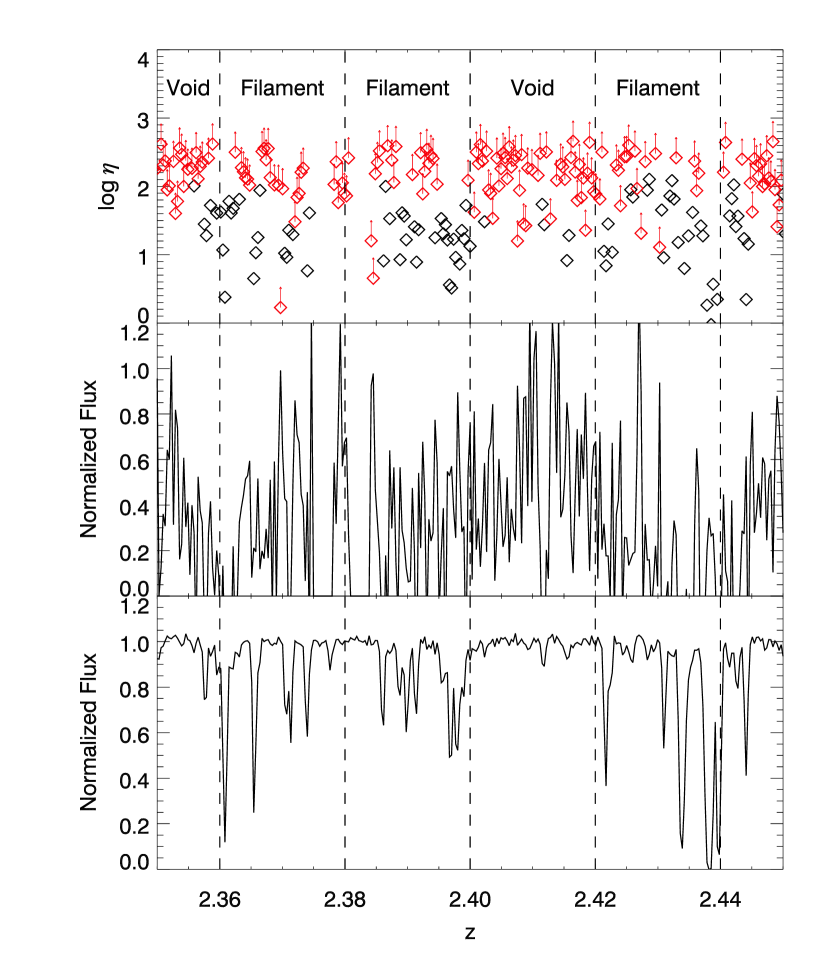
Figure 3 shows the observed distribution of with redshift, from , for two different wavelength bin sizes (0.05 Å and 0.20 Å). We also distinguish the absorbers in“voids” () from those in the H I “filaments” (stronger absorbers with ). Note that is systematically higher in the voids. Binning the data from 0.05 Å to 0.20 Å reduces the number of points in the low () and high () ends of the range, but it does not change the overall distribution.
In practice, we must censor the data to avoid unphysical values of . First, we exclude points with . We also excise points within 1 of either the zero level or the continuum, on the grounds that they are indistinguishable statistically from 0 and 1, respectively. Thus, the distributions shown below represent only a subset of the complete dataset. With these criteria for censorship, we find . If the FUSE points within 1 of zero are used to provide lower limits on the He II optical depth, and thus lower limits on , a Kaplan-Meier survival statistics calculation implies . However, this neglects the upper limits available for .
The uncensored mean value, , is in good agreement with theoretical predictions (FGS98) for an ionizing background produced by QSOs with mean spectral index (Zheng et al. 1997; Telfer et al. 2002). The wide range in , as well as the small-scale variations in redshift, were attributed in KS01 to the possible contributions of hard and soft sources to the ionizing background. However, this assertion deserves further scrutiny with a physical model of such sources and their spatial frequency.
In photoionization equilibrium, the He II/H I ratio can be expressed (FGS98) as:
| (1) |
Here, , , , and are the case-A recombination rate coefficients and photoionization rates for H I and He II, and and are the specific intensities of the radiation field at the H I (912 Å) and He II (228 Å) edges. The parameters and are the local spectral indices of the ionizing background at 1 and 4 ryd, respectively, which provide minor corrections to the photoionization rates. We adopt case-A hydrogenic recombination rates to H I and He II, appropriate for the Ly forest absorbers with very low neutral fractions. Over the temperature range K, we approximate and , where . We also assume that () and that H and He are predominantly fully ionized ().
The metagalactic ionizing background, , can be modeled (Shull et al. 1999) from the intrinsic spectra of the ionizing sources (spectral index ) filtered through the IGM. Cosmological radiative transfer softens the spectrum and produces a steeper effective index, . For example, one can write the ratio of specific intensities at 1 and 4 ryd as , where for (see Fig. 10 of FGS98). From equation (1), we then find for and .
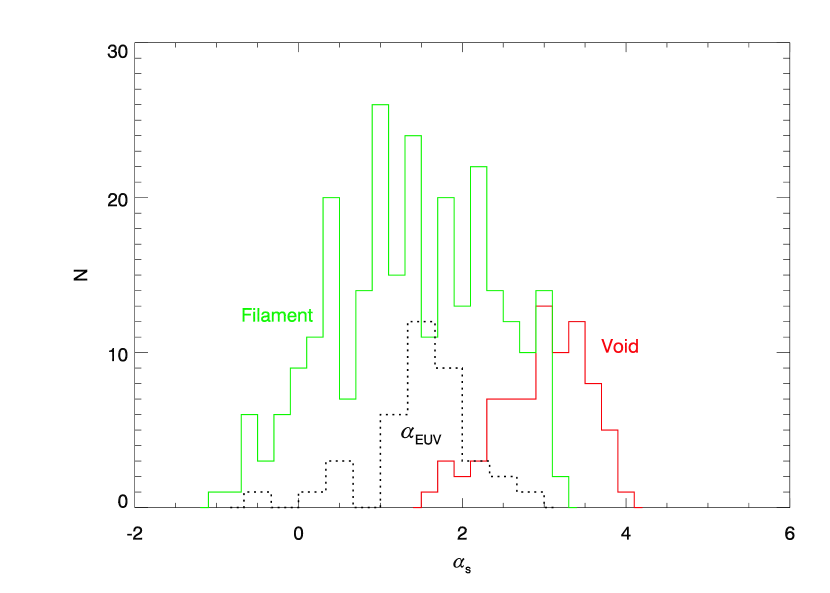
Figure 4 shows the observed range in ionizing spectral indices, , of radio-quiet QSOs from the HST spectral survey (Telfer et al. 2002). This survey favors blue quasars with fairly clean lines of sight. This might bias the mean of the distribution to be bluer, and select against ones with very red . However, both radio-loud and radio-quiet samples show the same broad distribution of spectral indices. The upper curves in Fig. 4 show the spectral indices, , required to reproduce the observed values of , using equation (1). We use bin-by-bin data for optical depths and convert them to the required , assuming and . In this approximation, , and from equation (1). It is also possible that some He II/H I variations could be produced by hot shocked gas ( K), for which ranges from 10–500 in pure collisional ionization equilibrium (Sutherland & Dopita 1993).
We note that the range of (Fig. 4) is considerably larger than that of , suggesting additional spectral softening. The absorbers in voids have higher spectral indices () than those in filaments (), suggesting that the void absorbers may experience an ionizing radiation field softer than that of the “bare QSOs”. However, since has fine-grained variation over , it may be inappropriate to use a mean metagalactic radiation field for all absorbers in the IGM. The ratio, , must fluctuate due to “local effects”, and the observed wide range of QSO spectral indices is proposed to account for most of these variations. This poses a paradox: the space density of AGN at is too sparse (mean distance of 30 Mpc between QSOs) to produce the observed -fluctuations ( or Mpc at ). We return to this issue in § 2.4.
2.4 Statistics and Distribution of He II/H I Ratios
In this subsection, we explore the variations of in greater detail, using an analysis of their correlations with voids and filaments in the Ly forest. The large number of points is unexpected, as it implies that there is a substantial volume in the universe where the extragalactic radiation background has a very hard spectrum. With a series of Monte Carlo calculations, we now explore the degree to which the high fraction of these points is due to bias in the points chosen to calculate . We begin with the H I spectrum and generate a new set of flux points based on the uncertainties given in that spectrum. We then convert this new set of flux points into an H I optical depth, . With the assumption that the underlying value of is actually a constant , we then generate a corresponding set of He II optical depths, convert these optical depths into a set of flux points, and vary these points according to the uncertainty vector in our FUSE spectrum. We analyze this simulated spectrum in the same way as outlined for the observed spectrum, excising points with , and within 1 of zero or the continuum. Finally, we calculate a new set of values for .
After performing a set of 1000 simulations, we arrive at the following conclusions: (1) For any assumed values of , there is a trend to produce a simulated set of points with ; (2) Nevertheless, even for a value of chosen so that is the observed censored value (specifically, and as in § 2.3), the fraction of low- flux points in the data is larger than that in the simulations. In the data, 55% of all points have , and 30% of all points have . The mean fractions of such points in the simulations are 27% and 14%, respectively. No simulation had as many low- points as the data.
Figure 3 indicates another check of the reality of the low points. We have made the same observational cuts in for the points in the upper left and lower left plots. In the lower left panel, where the bin size is quadrupled and the S/N approximately doubled, the distribution in is much less likely to be affected by statistical fluctuations in the measured flux. The persistence of numerous low- points is reassuring to the interpretation that these points are real. As we will show, we believe the fine-scaled variations are statistically significant and arise from a combination of intrinsic variation in AGN spectral indices, coupled with radiative transfer effects in a non-uniform IGM.
Although our analysis assumes that all absorption in the VLT spectrum is due to H I, and that all absorption in the FUSE spectrum is due to He II, both spectra are subject to metal-line contamination. Songaila (1998) identified metal-line systems (C IV and Si IV) at and , as well as metal lines connected with a Lyman-limit (LL) system (Reimers et al. 1997; Smette et al. 2002). The LL system has hydrogen continuum optical depth at , corresponding to N(H I) = cm-2 and can be seen in Figure 1 as the two saturated H I absorbers labeled on the He II scale at 1135 and 1136 Å (the corresponding He II lines fall within a detector gap, and so are not visible). In addition, the lack of a proximity effect in the He II Ly spectrum toward HE 2347-4342 implies a column density N(He II) = cm-2 at (Reimers et al. 1997; Smette et al. 2002) [see § 3], which has highly ionized metal lines associated with it. Smette et al. (2002) report components with log N(C IV) = 12.8 and 12.1 as well as log N(O VI) = 13.6 associated with this absorption system. In general, for a range of assumed properties of this gas, the possible corresponding transitions are likely to be quite weak in the FUSE or VLT spectra.
There also is the possibility that metal lines (C IV, Si III) associated with lower redshift Ly absorbers may be present in portions of the VLT spectra. This is unlikely to impact our statistical conclusions strongly. At higher redshift, on average, for N(H I) cm-2. This would imply an equivalent width of only 1.2 mÅ for N(H I) cm-2, and much less for the more common lower column density absorbers. Finally, there is an unknown amount of H2 Lyman and Werner band absorption ( Å). This is a sightline with relatively low extinction, so that heavy Galactic H2 contamination is unlikely. We have explored the extent to which metal-line contamination would bias our statistical results. Simulating the effects of contamination, we randomize 10% and 20% of the opacity bins and reanalyze the data. In 100 realizations of each process, we have found that our statistical conclusions are robust.
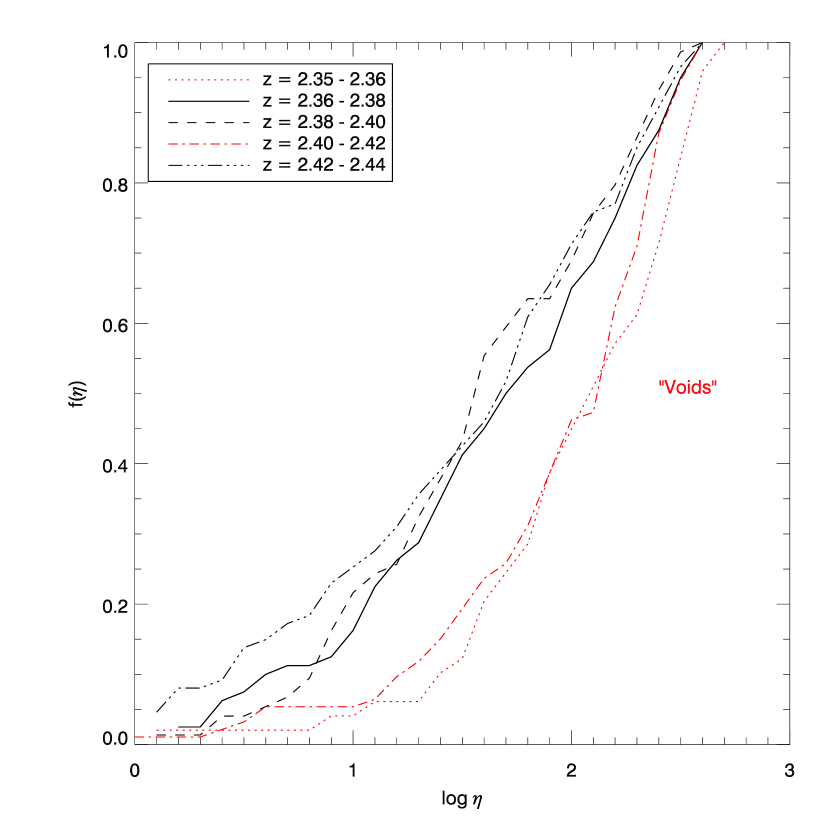
Next, we have examined the distribution of , both in regions of high H I opacity (denoted “filaments”) and in low-opacity regions (denoted “voids”). Figure 5 shows the cumulative distributions of in five different regions, two voids and three filaments, all in the redshift range . One can immediately see that the voids contain many more absorbers with large values of (soft ionizing sources) than the filaments. This effect was also noted in Figure 4. The radiation field in the voids could be dominated by starburst galaxies, whose massive stars lack the strong He II continua of QSOs. Alternatively, the AGN radiation reaching the voids may have been more strongly filtered by passage through dense filaments in the “cosmic web”.
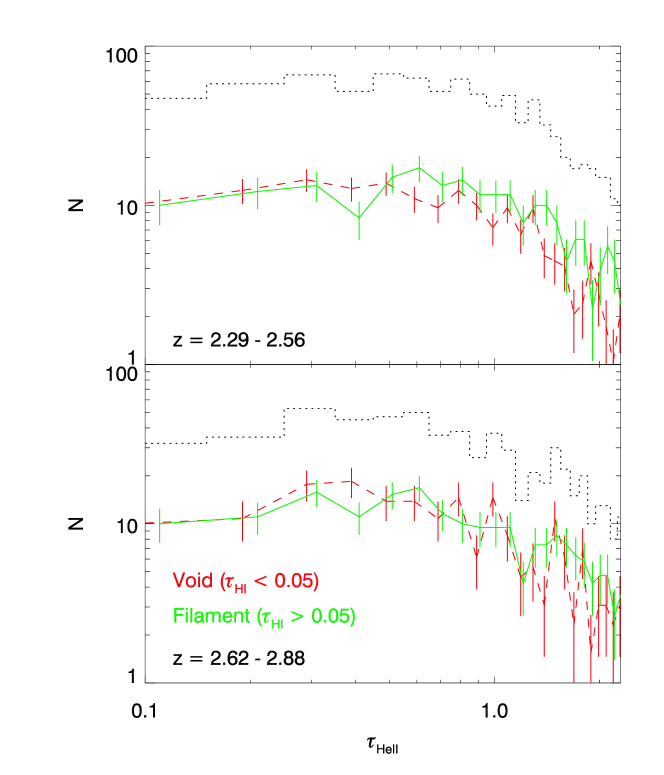
Figure 6 shows the distribution of optical depths, , in two redshift intervals. In each panel, we show distributions for “voids” () and “filaments” () in the H I Ly forest. The flat distributions in this logarithmic plot between are consistent with , steepening at . This distribution is somewhat flatter than the corresponding H I column density distribution, , with for (Kim et al. 2001).
Figure 7 shows a closeup of one of the “void” regions () in which the He II transmission is unusually large, again with many high- absorbers suggestive of local soft sources. However, the difficulty with this simple explanation is that the expected high space density of (dwarf starburst) galaxy sources should produce a uniform ionizing background, not the observed fluctuating field of values. An alternative interpretation is that the hard-spectrum QSOs might preferentially be located in the overdense regions associated with H I filaments. In this case, the filament absorbers would see a harder spectrum (lower , lower ) than the voids. Ultimately, these speculations need to be confirmed by cosmological radiative transfer calculations in an inhomogeneous IGM.
3 DISCUSSION
In this paper, we have used FUSE (He II) and VLT/UVES (H I) data to analyze the fluctuating intergalactic absorption between toward the high-redshift QSO HE 2347-4342. This interval appears to span the He II reionization epoch at , which is considerably lower than that, , estimated for hydrogen reionization. For a standard WMAP cosmology (Spergel et al. 2003), with km s-1 Mpc-1, , and , the interval of time between these redshifts corresponds to Gyr.
As in KS01, we confirm the slow reduction of at lower redshifts, , in good agreement with theoretical expectations (FGS98) of an IGM photoionized by QSOs. The He II “reionization epoch” in this one sightline is characterized by several regions of high optical depth between , separated by narrow transmission windows at and 2.87. Clearly, FUSE and/or HST studies of additional sightlines are needed to understand the cosmic variance in these results.
Our major findings on IGM structure and sources of ionizing intergalactic radiation are:
-
1.
We see fine-grained variations in He II/H I ratios () on scales , corresponding to physical lengths Mpc at .
-
2.
The -variations appear to reflect “local radiation effects” from QSOs whose spectral indices range from . A few regions with could lie close to hard ionizing sources.
-
3.
The He II/H I ratio appears to be larger in voids in the H I Ly forest () compared to filaments. In these voids, up to 80% of the pathlength has .
These results suggest that, if both He II and H I are photoionized, the metagalactic radiation field is highly variable and strongly affected by local sources. In principle, the -fluctuations could arise solely from variations in IGM opacity. But, in view of the broad observed range in AGN spectral indices, , it seems probable that the fluctuations arise from spatial variations in the ionizing fluxes (“local effects”). Moreover, observations of the Ly absorbers at (Kim et al. 2001) suggest a low spatial frequency of strong absorbers that dominate the opacity at the H I or He II ionization edges. Optical depths unity in these continua correspond to H I column densities cm-2 and cm-2, respectively. Such systems are too rare in the Ly forest at to produce the fine-grained variations over .
However, the simple explanation that QSO emissivity variations translate into fluctuations in needs a more firm physical basis. The variable-index QSOs at must produce spatial variations in the radiation field over Mpc-scales (), whereas the co-moving space density of bright () QSOs at is Mpc-3, which corresponds to mean physical separation, Mpc. As discussed by Giroux, Fardal, & Shull (1995), the “proximity spheres” for bright QSOs are 1 Mpc at 1 ryd but as high as 35 Mpc at 4 ryd. At these distances, the QSOs’s local radiation field matches the metagalactic background and can create detectable changes in the H I and He II line opacity. In the case of HE 2347-4342, Smette et al. (2002) noted the absence of any observed proximity effect in He II absorbers near . They estimated that a column density N(He II) cm-2 was required to absorb the QSO’s ionizing radiation at 4 ryd. Thus, the QSO radiation field in the He II continuum may be strongly affected by absorption from both the galactic nucleus and the IGM.
If a significant fraction of AGN exhibit He II intrinsic absorption, then the ratio of fluxes at 1 and 4 ryd can be larger than implied by the range in (Telfer et al. 2002), which is only fitted between 1200 and 500 Å. Moreover, if this intrinsic absorption partially obscures the nuclear continuum in only some directions, other QSOs off the sightline could create regions of hard and soft ionizing radiation. These AGN could produce fine-grained variations in , owing to their own patchy absorption. This idea was proposed for a “helium-reionizing quasar” 3.2 Mpc off the sightline to Q0302-003 (Jakobsen et al. 2003).
We now can characterize the difficulty with the simple explanation of attributing fluctuations in to variable QSO spectral indices. The FUSE/VLT data suggest that the local radiation field varies on 1 Mpc scales, whereas bright QSOs are 30 Mpc apart, on average. However, their proximity spheres extend to 1 Mpc at 1 ryd, and to 35 Mpc at 4 ryd. The observed fluctuations in are produced by the combination of the wide range in source emissivities and AGN/IGM opacities at 1 and 4 ryd. The non-uniformity of the metagalactic background, , needs to be confirmed by numerical simulations that carefully treat the radiative transfer (absorption, filtering, reprocessing) of ionizing radiation through the cosmic web and include the range of QSO spectral indices. In standard models of the ionizing background (FGS98; Madau et al. 1999), the radiation field at a given point is produced by many ionizing sources within a sphere of radius , the comoving attenuation length for “optical depth unity” in the continuum. Fluctuations in the ionizing background are then set by statistics of sources within that sphere.
Fardal & Shull (1993) estimated that QSOs lie within this “attenuation sphere” at for a standard QSO luminosity function (Boyle et al. 1991). From these large numbers, one naively expects the H I ionizing background to be fairly uniform. However, these estimates differ at 1 ryd and 4 ryd. FGS98 found that, at , the H I and He II continuum opacity gradients, are 2.5 (H I) and 10 (He II). Therefore, the spheres of optical depth unity extend over (H I physical length Mpc) and (He II physical length Mpc).
These results predict much larger intensity fluctuations in the He II continuum than in the H I continuum, both because the He II attenuation sphere is smaller, and because the flat-spectrum QSOs () are rarer than the the steep-spectrum QSOs (), an effect seen clearly in Figure 4 and in Telfer et al. (2002). In numerical hydrodynamic simulations, the IGM is distributed non-uniformly in filaments, and the spherical approximations break down. The propagation of 1 ryd and 4 ryd radiation differ considerably, owing to the frequency dependence of the opacity. More sophisticated models should be able to confirm our hypothesis that the observed -fluctuations are the result of non-uniformities in opacity, coupled with the observed range in QSO spectral indices.
4 SUMMARY OF SCIENTIFIC IMPLICATIONS
This paper continued the study of the He II/H I absorption toward HE 2347-4342, using both FUSE and VLT spectra to derive values of ranging from 0.1 to 460. The combination of He II and H I absorption data allows us to probe the metagalactic ionizing spectrum and its sources. The large observed fluctuations in the H I and He II Ly absorption, and the wide range (0.1–460) in the ratio N(He II)/N(H I) suggest a wide range of ionizing sources and filtering of the ionizing spectra by a filamentary IGM. The fine-grained variations in indicate that the ionizing background is far from uniform, probably due to variations in both source emissivity (spectral index) and opacity fluctuations. A recent HST survey (Telfer et al. 2002) of QSO ionizing spectra suggests that most of the observed variations () can be understood through the wide range in QSO spectral indices ().
The most significant scientific results of our study are:
-
•
The observed fine-scaled () variations in , on physical scales Mpc are much smaller than typical distances between AGN or Lyman-limit absorbers.
-
•
The wide range in (from 0.1–460) implies a broad distribution of effective ionizing spectral index, , ranging between and 4 (). This range exceeds the observed range of AGN spectral indices, suggesting additional spectral softening due to radiative transfer through the AGN and a filamentary cosmic web.
-
•
An observed systematic correlation of higher (softer radiation fields) for absorbers in voids in the H I distribution ().
-
•
An inferred distribution in He II line optical depth, N( between .
We conclude with a discussion of future needs and challenges. The data on HE 2347-4342 () provide important evidence on the epoch of He II reionization (), and on the spectral variations and spatial distribution of ionizing sources. Nevertheless, one always worries whether cosmic variance might produce differences along other sightlines. It would be valuable to obtain He II absorption data along several other FUSE or HST sightlines, over the critical redshift range . At least one other sightline (HS 1700+6416 at ) has just been observed with FUSE, and the results look promising.
One of the major theoretical challenges is to understand why the He II reionization epoch () occurs much later than the H I reionization epoch (). Did He II experience “double re-ionization”, after an initial ionization epoch at by Pop III, low-metallicity stars (Venkatesan, Tumlinson, & Shull 2003)? Vestiges of this effect might still be visible in low-density voids, although much of the effect will be washed out by the rapid increase in QSO fluxes at . The observed high that we find in the voids would seem to rule out local hard spectra and relic ionization from early metal-free star formation.
Our finding that varies on small (1 Mpc) distance scales poses a quandary for the nature of the ionizing sources. Although it is tempting to conclude (KS01) that the wide range of AGN spectral indices can explain much of the He II/H I variation (), one still must confirm, through numerical simulations of ionizing sources embedded in the cosmic web, that these -variations actually occur naturally.
Another intriguing result from our study is that is systematically larger in voids (), compared to filaments of H I Ly absorbers. Does a higher really imply a softer ionizing radiation field, characteristic perhaps of starburst galaxies? Can we therefore use He II absorbers to probe the distribution of gas in voids?
If the variations can be explained by local fluctuations in the ionizing radiation field, enhanced by radiation transfer through the IGM, there may be additional signatures that take place around the epoch of He II recombination, . It is still not certain that the effect is entirely the result of variable-index QSOs; soft spectra can also arise from starburst galaxies. Deep imaging of these fields at might detect the actual sources of ionizing radiation. At , an galaxy (, with 21 Gpc luminosity distance) would have magnitude . One would need to search angular scales out to from the sightline (1 Mpc offset at ). One might also hope to obtain additional physical information on the ionization state of these H I and He II absorbers by looking for the corresponding C IV, Si IV, and O VI absorption in the NUV and optical.
| Segment | Extraction Window | Background Windows |
|---|---|---|
| LiF1a | 530 - 609 | 450 - 499, 720 - 769, 860 - 909 |
| LiF1b | 470 - 607 | 300 - 449, 650 - 799 |
| LiF2a | 660 - 709 | 600 - 659 |
| LiF2b | 690 - 729 | 600 - 636, 734 - 770 |
| Band (Å) | Kriss et al. (2001) | Smette et al. (2002) | This work |
|---|---|---|---|
| 1157.75-1158.25 | 0.69 0.06 | 0.78 0.09 | 0.80 0.07 |
| 1159.0-1161.0 | 0.68 0.03 | 0.64 0.04 | 0.63 0.04 |
| 1161.5-1168.3 | 0.02 0.02 | 0.06 0.02 | 0.04 0.02 |
| 1174.0-1175.0 | 1.03 0.06 | 0.93 0.04 | 0.94 0.06 |
| 1175.1-1179.3 | 0.07 0.03 | 0.02 0.02 | 0.00 0.03 |
References
- (1)
- (2) Ballester, P., Modigliani, A., Boitquin et al. 2000, The Messenger 101, 31
- (3)
- (4) Becker, R. H., et al. 2001, AJ, 122, 2850
- (5)
- (6) Boyle, B. J., Jones, L. R., Shanks, T., Mariano, B., Zitelli, V., & Zamorani, G. 1991, in the Space Distribution of Quasars, ed. D. Crampton (Provo: Brigham Young), 191
- (7)
- (8) Cen, R., & Ostriker, J. P. 1999, ApJ, 519, L109
- (9)
- (10) Cen, R., Miralda-Escudé, J., Ostriker, J. P., & Rauch, M. 1994, ApJ, 437, L9
- (11)
- (12) Davé, R., et al. 2001, ApJ, 552, 473
- (13)
- (14) Davidsen, A., F., Kriss, G. A., & Zheng, W. 1996, Nature, 380, 47
- (15)
- (16) D’Odorico, S., Cristiani, S., Dekker, H., Hill, V., Kaufer, A., Kim, T-S., & Primas, F. 2000, SPIE, Vol. 4005, 121
- (17)
- (18) Djorgovski, S. G., Castro, S., Stern, D., & Mahabal, A. A. 2001, ApJ, 560, L5
- (19)
- (20) Fan, X., Narayanan, V. K., Strauss, M. A., White, R. L., Becker, R. H., Pentericci, L., & Rix, H.-W. 2002, AJ, 123, 1247
- (21)
- (22) Fardal, M. A., & Shull, J. M. 1993, ApJ, 415, 524
- (23)
- (24) Fardal, M. A., Giroux, M. L., & Shull, J. M. 1998, AJ, 115, 2206
- (25)
- (26) Giroux, M. L., Fardal, M. & Shull, J. M. 1995, ApJ, 451, 477
- (27)
- (28) Haardt, F., & Madau, P. 1996, ApJ, 461, 20
- (29)
- (30) Heap, S. R., et al. 2000, ApJ, 534, 69
- (31)
- (32) Hogan, C. J., Anderson, S. F., & Rugers, M. H. 1997, AJ, 113, 1495
- (33)
- (34) Hu, E. M., Kim, T.-S., Cowie, L. L., Songaila, A., & Rauch, M. 1995, AJ, 110, 1526
- (35)
- (36) Jakobsen, P., Boksenberg, A., Deharveng, J. M., Greenfield, P., Jedrzewski, R., & Paresce, F. 1994, Nature, 370, 35
- (37)
- (38) Jakobsen, P., Jansen, R. A., Wagner, S., & Reimers, D. 2003, A&A, 397, 891
- (39)
- (40) Kim, T.-S., Cristiani, S., & D’Odorico, S. 2001, A&A, 373, 757
- (41)
- (42) Kriss, G. A., Shull, J. M., et al. 2001, Science, 293, 1112 (KS01)
- (43)
- (44) Madau, P., Haardt, F., & Rees, M. J. 1999, ApJ, 514, 648
- (45)
- (46) Miralda-Escudé, J., Cen, R., Ostriker, J. P., & Rauch, M. 1996, ApJ, 471, 582
- (47)
- (48) Moos, H. W., et al. 2000, ApJ, 538, L1
- (49)
- (50) Reimers, D., Kohler, S., Wisotzki, L., Groote, D., Rodriguez-Pascual, P., & Wamsteker, W. 1997, A&A, 327, 890
- (51)
- (52) Reimers, D., Kohler, T., & Wisotzki, L. 1996, A&S, 115, 235
- (53)
- (54) Sahnow, D. J., et al. 2000, ApJ, 538, L7
- (55)
- (56) Shull, J. M., Roberts, D., Giroux, M. L., Penton, S., & Fardal, M. 1999, AJ, 118, 1450
- (57)
- (58) Smette, A., Heap, S. R., Williger, G. M., Tripp, T. M., Jenkins, E. B., & Songaila, A. 2002, ApJ, 564, 542
- (59)
- (60) Songaila, A. 1998, AJ, 115, 2184
- (61)
- (62) Spergel, D. N., et al. 2003, ApJS, 148, 175
- (63)
- (64) Sutherland, R. S., & Dopita, M. A. 1993, ApJS, 88, 253
- (65)
- (66) Telfer, R. C., Zheng, W., Kriss, G. A., & Davidsen, A. F. 2002, ApJ, 565, 773
- (67)
- (68) Venkatesan, A., Tumlinson, J. & Shull, J. M. 2003, ApJ, 584, 621
- (69)
- (70) Zhang, Y., Anninos, P., & Norman, M. L. 1995, ApJ, 453, L57
- (71)
- (72) Zheng, W., Kriss, G. A., Telfer, R. C., Grimes, J. P., & Davidsen, A. F. 1997, ApJ, 475, 469
- (73)
- (74) Zheng, W., Kriss, G. A., et al. 2003, ApJ, in press
- (75)