Halos around edge-on disk galaxies in the SDSS
Abstract
We present a statistical analysis of halo emission for a sample of 1047 edge-on disk galaxies imaged in five bands by the Sloan Digital Sky Survey (SDSS). Stacking the homogeneously rescaled images of the galaxies, we can measure surface brightnesses as deep as . The results strongly support the almost ubiquitous presence of stellar halos around disk galaxies, whose spatial distribution is well described by a power-law , in a moderately flattened spheroid (). The colour estimates in and , although uncertain, give a clear indication for extremely red stellar populations, hinting at old ages and/or non-negligible metal enrichment. These results support the idea of halos being assembled via early merging of satellite galaxies.
keywords:
galaxies: halos, galaxies: structure, galaxies: photometry, galaxies: spiral1 Introduction
The most commonly accepted paradigm for the formation of structure in the
universe, ranging from galaxies to clusters and superclusters of
galaxies, predicts that they are assembled via the hierarchical clustering of
dark matter (DM) halos, in the framework of the so called CDM cosmology.
Although these models have been very successful in describing large scale
structure and much recent progress has been made in understanding
the processes behind the assembly of individual galaxies through
numerical simulations (e.g. Navarro & White 1994; Sommer-Larsen, Gelato & Vedel 1999;
Navarro & Steinmetz 2000; Scannapieco & Tissera 2003),
semi-analytic modelling (e.g. Kauffmann, White & Guiderdoni, 1993; Baugh, Cole & Frenk, 1996; Somerville & Primack, 1999),
and their combination (e.g. Kauffmann, Nusser & Steinmetz 1997; Kauffmann et al. 1999; Benson et al. 2000; Springel et al. 2001),
much work is still needed.
The study of the stellar halos of disk galaxies, such as our own Milky Way (MW), can give
a substantial contribution in this field. From many studies
(for a review see e.g. Majewski, 1993), it is known
that the MW halo is populated by old, metal-poor stars, whose origin is debated.
They may have formed in the early stages of the dissipational collapse of the gas in the
proto-galactic DM halo. Alternatively they may have been accreted through
the stripping of stars from satellite
galaxies. Evidence that this process plays an important role in building up
the stellar population of the
halo, has come from the Sagittarius dSph (Ibata, Gilmore & Irwin, 1994),
a low-latitude halo stream found in the Sloan Digital Sky Survey (hereafter SDSS, Yanny et al., 2003; Ibata et al., 2003),
the ongoing disruption process of the Palomar 5 globular cluster (Odenkirchen et al., 2002),
and the detection of streams in local high velocity stars (Helmi et al., 1999).
How much of the halo light and mass must be ascribed to this kind of interactions and
how common they were in the past is still unclear.
In order to answer these questions in a more general context, the extension of
the observations to a statistical sample of external galaxies is required.
Unfortunately the surface brightness contributed by a stellar halo similar to
the one in the MW is typically 7 to 10 magnitudes fainter than the central
parts of the other galactic components (disk, bulge) and than the sky.
At present day, observations of the halo are available only for a handful
nearby galaxies and provide varying results.
Recent work by Ferguson et al. (2002) has demonstrated the
presence of substructure in the moderately metal-enriched stellar halo of M31, that
is likely to be the relic of the disruption of one or more small companion galaxy.
The search for halos in more distant galaxies, for which stars belonging to different
components cannot be resolved, has been focused on edge-on disks, because
of the much lower contamination of the halo by the projected
disk stars. Problems with flat fielding, scattered light from other background and
foreground sources, and extended PSF wings make it extremely difficult to
obtain reliable photometry down to 29-30 , as required
in order to characterise galactic halos. After the first detection of halo
around NGC 5907 claimed by Sackett et al. (1994), many controversial results have followed.
The latest and deepest observations of this galaxy (see e.g. Zheng et al., 1999)
strongly support the extraplanar emission being instead a ring which results from tidal disruption
of a satellite galaxy.
In the most complete study so far, (but see Sec. 5 for a
more exhaustive review of recent results in the literature), the deep observations
of a sample of 47 edge-on galaxies, by Dalcanton & Bernstein (2002),
provide evidence for the ubiquitous presence of red envelopes around disk galaxies, which
the authors attribute to an old, moderately metal-enriched, thick disk structure.
In this paper we present the results from the statistical study of halo
emission from a sample of more than 1000 edge-on disk galaxies imaged by the
Sloan Digital Sky Survey (SDSS, York et al., 2000). The SDSS is imaging about a
quarter of the sky in the , , , , and bands, with 54 sec drift scan exposures
at the dedicated 2.5 m Apache Point Observatory telescope
(Fukugita et al., 1996; Gunn et al., 1998; Hogg et al., 2001; Smith et al., 2002; Pier et al., 2003), reaching
at for a single pixel.
In order to reach a surface brightness as low as ,
we adopt a stacking technique, in which we combine the images
of all the galaxies. First, the images must be geometrically transformed in order to
make the galaxies superposable. Other external sources must then be masked.
Finally, the count statistics of each pixel is considered and a suitable estimator
is chosen to represent the distribution. In this way it is possible
not only to increase the by a factor , but also
to remove statistically the major sources of contamination for
deep photometry of individual objects, namely foreground and background sources,
inhomogeneities in the flat field and light scattered inside the camera.
The paper is organised as follows: the sample is described in Sec. 2;
in Sec. 3 we describe the image processing and the stacking
procedure. The results are analysed in Sec. 4, paying
particular attention to the noise properties of the resulting images and to the
possible sources of error and of bias. A discussion, including a comprehensive
comparison with previous results in the literature and the possible implications
for galaxy formation, is given in Sec. 5.
A summary and the conclusions of this work are reported in Sec. 6.
2 The Sample
As of April 2002 the SDSS has covered square degrees both in 5-band
imaging and spectroscopy. Blanton et al. (2002) have selected a sample of
galaxies from the Main Galaxy Sample (Strauss et al., 2002), also known as
‘Large-Scale Structure Sample 10’ (LSS10), including all sources with average surface
brightness within
the Petrosian111Petrosian (1976) defines the Petrosian radius as the
radius at which the surface brightness equals a given fraction of the average surface
brightness inside that radius. The Petrosian flux (and hence the magnitude) is defined
as the flux inside a certain number of Petrosian radii. See Stoughton et al. (2002) for the full
description of the procedure adopted in the SDSS data reduction and the actual parameters.
radius in band , that have been successfully
targeted by the spectroscopic observations
(see Blanton et al., 2003, for details about the ‘tiling’ algorithm).
We refer the reader to
Blanton et al. (2002) for the details of the sample and the regions of the sky
covered.
For the purposes of this work we selected a subsample of edge-on galaxies from
the LSS10 requiring the following conditions to be satisfied:
-
•
Petrosian magnitude () successfully measured at least in the three most sensitive SDSS pass-bands, namely the , , and band;
-
•
;
-
•
isophotal semi-major axis222the SDSS reduction pipeline PHOTO (Lupton et al., 2001) provides an elliptical fit of the 25.0 isophote parametrised by the semi-axes a and b arcsec in band;
-
•
isophotal axis ratio in , and band.
Images of the 1221 selected galaxies were inspected by eye in order to prune from the sample objects that are unsuitable for stacking. First of all we discarded a few percent of the galaxies whose axis ratios had been clearly underestimated due to some failure in the SDSS PHOTO reduction pipeline. Galaxies showing evidence of interaction with nearby companions, warps or other irregularities were rejected. The absence of nearby bright sources contaminating the background was required as well. The resulting sample is composed of 1047 galaxies, ranging from to -band absolute Petrosian magnitude, in units of . The redshift distribution of the sample peaks at with a standard deviation of 0.035. Typical physical dimensions range from to kpc (Petrosian radius in the band), with a median value of 7.4 kpc .

A summary of the sample properties is reported in Fig. 1. Eye inspection of the single galaxies confirms that our sample is dominated by late-type disk galaxies, with at most a few per cents of Sb-c or Sb. Most of the galaxies appear to be almost bulge-free and the the remainder have quite small ‘classical’ bulges.
3 The image stacking
3.1 The image pre-processing
The raw SDSS imaging data is available as 2048x1489 pixel2 (13.5x9.8 arcmin2) bias subtracted and flat-fielded ‘corrected frames’. Using SExtractor v2.2.2 (Bertin & Arnouts, 1996) we accurately determined the centre and the position angle of the major axis for each galaxy. From the segmentation image output by SExtractor we obtain a mask for all the sources in each field detected with S/N. The background level for each galaxy was determined as the mode of the pixel count distribution in an annulus with inner radius and outer radius (where is the isophotal major semi-axis at 25.0 in -band). This background was then subtracted from each image.
3.2 Photometric scale-lengths
The main hypothesis underlying the stacking technique as a reliable
statistical tool to investigate halo properties is an assumed
self-similarity of the disk galaxies, or at least of their diffuse component.
There must exist a ‘characteristic’ scale-length, such that
after rescaling, all galaxies can be superposed.
The validity of this assumption will be discussed in more detail
in Sec. 4.2.
Since the surface brightness distribution of edge-on disks is affected strongly
by dust extinction, we chose the band (Å)
as the reference pass-band in order to characterise the scale-length of our
sample. This choice represents the best trade-off between the need for a high
sensitivity and the desire to limit the effects of dust333The band is in fact the red-most one, but its
sensitivity is about a factor 2-3 lower than the band..
Many different scale-lengths can be defined from photometric analysis.
We consider the following four scale-lengths:
- •
-
•
the effective or half light radius
-
•
the exponential scale-length
-
•
an isophotal radius obtained from the one-dimensional light profile along the major axis
, and have been determined using dedicated software
developed in the IRAF environment. In order to evaluate the two former
parameters, we derive
a surface brightness profile from circular aperture photometry extending out
to 1.5 isophotal ( mag arcsec-2) radii. is then obtained
as the radius enclosing 50 per cent of the total flux, while the exponential scale
radius is derived
from the least squares fit to the surface brightness profile between
and (i.e. the radius enclosing 90 per cent
of the flux).
The basic motivation for analysing an one-dimensional brightness profile,
derived by collapsing the image of the galaxy along the minor axis, is to have
an estimate of the brightness which is as much as possible independent of the
inclination. The surface brightness enhancement is, in fact, important and severely
dependent on the inclination, when the edge-on condition is approached. Assuming
low or negligible extinction, the quantity ,
where is the flux enclosed within the projected distance from the
minor axis of the galaxy, is independent both of the inclination and of the
distance of the galaxy. As reference level for determining we chose
, which corresponds roughly to
a surface brightness of
for a typical edge-on galaxy.
All four scale-lengths are quite strongly correlated, as expected for self-similar
exponential profiles. The typical scatter around the 1:1 relation between
pairs of corresponding scale-lengths is per cent.
3.3 The image transformation and stacking
For each of the four scale-lengths considered, the median value in the sample, rounded to an integer number of pixels444The pixel scale of the SDSS CCDs is , has been taken as reference for the rescaling, as given in Table 1.
| arcsec | pix | arcsec | pix | arcsec | pix | arcsec | pix |
|---|---|---|---|---|---|---|---|
| 10.07 | 25 | 4.74 | 12 | 3.76 | 10 | 15.50 | 40 |
All galaxy images have been geometrically transformed using the drizzle re-sampling technique (as implemented in the IRAF geotran task) in order to correctly propagate the original noise properties. Each image has been translated to the galaxy centre, rotated according to the measured position angle of the major axis, and expanded or contracted according to the ratio between the reference scale length and the corresponding measured one. The same transformation has been applied to the corresponding mask, and a ‘grow radius’ of 10 pixels (in the original image size) around each masked pixel has been adopted in order to mask the extended PSF wings of the brightest sources. Since each image has a different photometric calibration and the measured surface brightness of a galaxy is differently affected by Galactic attenuation, depending on its location in the sky, an intensity rescaling is needed as well. The transformation from the original pixel intensity to the rescaled one is given by the following formula:
where and are the flux calibration zero points of the image and of
reference, respectively, is the airmass correction, and is
the attenuation due to our Galaxy, as given by Schlegel, Finkbeiner & Davis (1998). All the quantities
are expressed in magnitudes.
The combination of the transformed and rescaled images has been performed using
the imcombine IRAF procedure. First of all, the masked pixels are rejected. The
median of the count distribution of the remaining pixels is then calculated in order
to obtain the median image. An average image is calculated as well, after
clipping the 16 per cent percentile tails of the count distribution of the unmasked
pixels. Adopting the standard approximation for the mode of a distribution
we calculate the mode image.
The resulting images extend much beyond
the detected emission from the galaxies and allow us
to determine the properties of the background in great detail.
A careful comparison between the three
statistical combinations shows that, despite of the conservative masking
method adopted, the diffuse luminosity of sources other than the considered
galaxies can result in significant skewness in the pixel count distribution
and in a systematic increase of the sky surface brightness up to
in i-band in the outermost regions of the
average frame with respect to the innermost ones, in which contaminating
sources are avoided by selection. This systematic effect in the background
is almost completely removed in the mode image. In the following, therefore, we
will always refer to that one as the resulting stacked image.
For each stacked image the residual background level is determined as the count mode
in an annulus of 130 pixel inner radius, 96 pixel thick, and subtracted.
In Fig. 2 we present the images for the four most sensitive
pass-bands (, , , ), obtained by stacking the images rescaled according
to the galaxy exponential scale length. For the band the
signal-to-noise is
not sufficient to say anything about the presence and the characteristics of
halo emission, therefore we will neglect this band in the following analysis and discussion.
Rescaling according to the other scale-lengths does not change the resulting
images significantly, as we will demonstrate more quantitatively later on,
and therefore they are not shown here.
Intensity levels in Fig. 2 are coded in square-root transformation
grey scale, suitably adjusted to show the maximum extension of the low surface
brightness envelope. We superpose isophotal contours in two magnitude ranges:
black contours, corresponding to the faintest isophotes, are obtained adopting
a boxcar smoothing scale of pixel, whereas the white, brightest ones, have been
calculated with a pixel smoothing scale. The represented isophotal levels are
given in the figure caption.
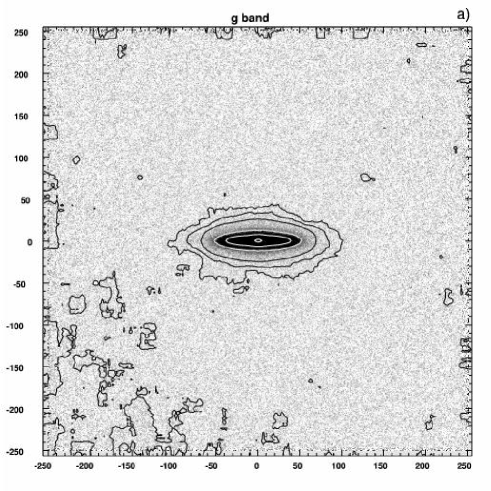
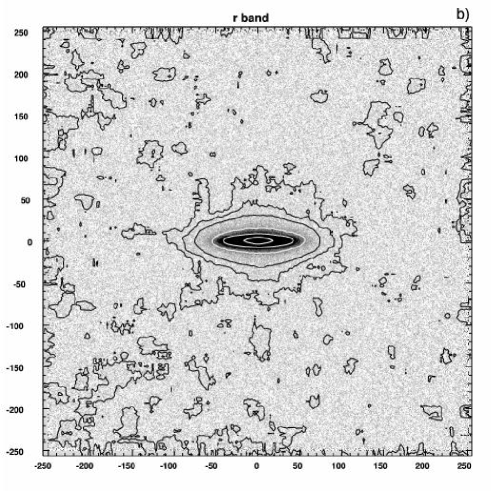
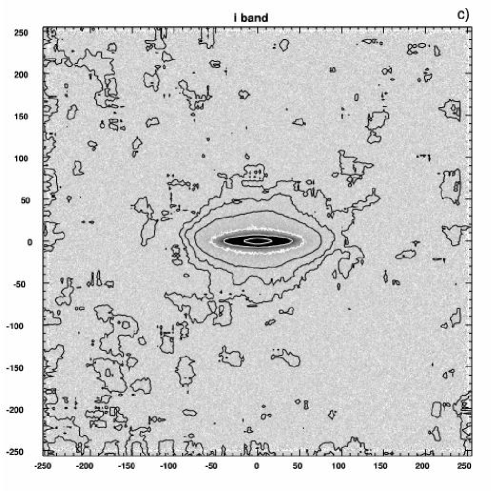
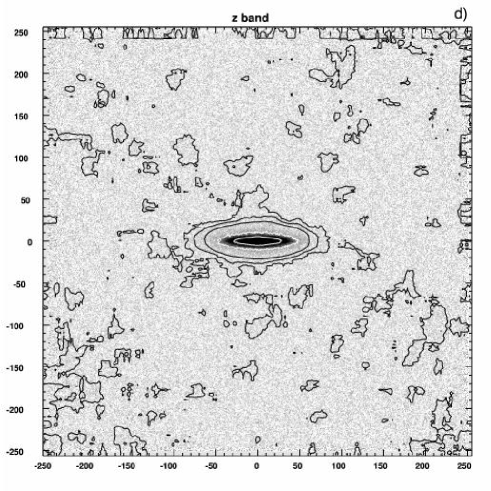
The images and the superposed isophotes show very clearly the presence of a diffuse luminous envelope around the disk, in all four considered bands. This halo (whatever physical meaning we give to this word) is particularly evident and round in the and the bands, whereas it is significantly flattened in the and bands (but the lower sensitivity in the latter band does not allow us to say much).
4 The analysis
In this section we present the results of an analysis of the stacked images in the , , , and pass-bands. We mainly concentrate on the stacking of the complete sample (1047 galaxies), because of the resulting higher sensitivity, but we also consider the stacking of three subsample of bright, intermediate and low luminosity flat galaxies (Sec. 4.5), in order to better understand the possible dependence of the observed halo properties on total luminosity. After analysing the background properties of the stacked images in order to assess our detection limits (Sec. 4.1), the photometric properties are investigated by means of radial sector-averaged surface brightness profiles (Sec. 4.2), and compared to different models of luminosity distributions, namely thin+thick disks and disk+halo (Sec. 4.3). The average halo colours are presented in Sec. 4.4. Unless otherwise specified, we will always use the stacking of the images rescaled according to the exponential disk scale-length. We devote an entire paragraph in Sec. 4.2 to demonstrate that the adopted scale-length is not critical in determining the characteristics of the observed halos.
4.1 The background noise properties
Since our photometric measurements are performed by integrating the flux over different image areas, as will be explained in Sec. 4.2, it is crucial to determine the noise properties on different scales. The presence of large-scale fluctuations is already obvious from a superficial inspection of the contour plots in Fig. 2. We restrict the analysis of the noise to the annulus (130 pixel inner radius and 96 pixel thickness) on which the sky level has been computed, and we consider the rms of the intensity after re-binning the image by different linear factors, ranging from 1 to 50. The dependence of the on the scale-length is well described by a power law of the form
| (1) |
where is the noise on one-pixel scale, and , thus indicating that the noise has significant large scale structure in excess to what is expected in the case of pure Gaussian noise (for which ).
4.2 The surface brightness profiles
The most obvious way to investigate the properties of the approximately round, low surface brightness structures emerging in Fig. 2 is to extract surface brightness (SB) profiles, averaging the flux in large wedges at different position angles. First of all, we divide the image in four circular sectors of aperture, centred at , , and position angles (PAs). Each of these sectors is in turn radially divided into a number of coronae, geometrically spaced such that the outer radius of the th corona is given by , with . Finally, we estimate the mean SB as a function of the radius for (i.e. along the disk) and PA (i.e. perpendicular to the disk) averaging the SB in pairs of corresponding coronae in the two symmetric sectors at and and at and PA, respectively. In each of the four graphs of Fig. 3 we show the SB profiles for the , , , and images respectively, in linear scale (upper left panel) and logarithmic scale (upper right panel): open circles represent the PA profile, filled triangles the PA.


The shaded areas represent the level of the rms background fluctuations at the
scale length corresponding to the area of the coronae in which the SB is averaged, as
calculated in the previous section. Thus the detection limits for the SB
profiles can be assessed as for the , and band
and as for the band.
In order to evaluate the errors on the SB we must consider contributions from 1) the background fluctuations and 2) the intrinsic scatter in the average signal from a galaxy. The first one is just provided by the background rms as evaluated in the previous section using Eq. 1, with given by the square root of the area of the corona over which the signal is integrated. The estimation of the intrinsic scatter contribution is much more cumbersome, since the shape of the statistical distribution of the pixel counts in the coronae is not known a priori and the light distribution of the galaxy itself is likely to give a major contribution to the rms of the count statistics. In order to remove it, for each pixel we consider the deviation from the average intensity of the corresponding pixels in the four image quadrants, which are symmetric with respect to the x and y axes, and express the intrinsic rms as:
| (2) |
where is the pixel intensity, is the number of pixels per corona per quadrant, and is the average intensity over the index. In the absence of any large scale background fluctuation the error on the average intensity is just obtained dividing the (2) by . Adding the contribution of the large scale fluctuations, we can write the error as:
| (3) |
where is given by Eq.1 with given by the square
root of the area of the corona, and the factor 2 comes in from having averaged two coronae.
Such an error estimate has been proved to be consistent with the scatter of the average
intensity in the corresponding coronae in the four quadrants.
In the lower panels of each graph in Fig. 3 we plot the axial
ratio of the isophotes as a function of the radius (semi-major axis).
This is calculated as follows.
We assign a number of SB levels and determine the radius at which such SB’s
are reached at different PAs , by interpolating the SB profiles extracted from
6 wedges per quadrant. Assuming is well represented by an ellipse with
the major axis along the x direction, we derive the best fitting semi-axes and
by means of a standard least squares algorithm.
As it is apparent from the straight-line behaviour of the open circles in the linear-scale
plots of Fig. 3, the profile of the wedges centred on the disk show an
exponential decrease of the SB with radius, as it is typical for disks. Perpendicular to the
disk, instead, the rapid initial decrease of the SB becomes shallower as we go further away
from the centre of the galaxy. The trend is well approximated by a power-law with index
, as the straight-line behaviour of the triangles in the log-scale plots points out.
This is in general true for the four bands analysed. However, the relative intensity at the
same radial distance along the disk and perpendicular to it is different in different
bands, reflecting a possible dependence of the flattening of the diffuse halo on the band
and, in turn, this points to colours gradients in the halo itself.
As already noted from the isophotal contours in Fig. 2, the halo is prominent
in the and the band, reaching a SB comparable to that of the disk at
and making the isophotal shape significantly rounder
(). In the band the halo has very little extension (the surface brightness
drops below beyond ), thus leaving the isophotes
extremely flattened. For the band the measurements are inconclusive: there is
some hint of a shallowing of the slope of the profile, but the drops below 1
already at at the level of .
In Fig. 3, for pix, we also show as dashed lines the ‘pure disk’
profiles
obtained subtracting the profile from the profile,
after stretching the former by a factor to take the flattening of the halo
into account (see Sect. 4.3 for details on the 0.6 factor).
There is evidence that the ‘pure’ disk slope steepens beyond
in the and bands, consistent with studies of individual disks in the literature
(see e.g. van der Kruit, 2001; Kregel, van der Kruit & de Grijs, 2002, and references therein), whilst
the results are unclear in the and bands.
In order to rule out scattered light and the extended wings of the point spread
function (PSF) as major contributors
to the observed halos, we have performed the same stacking procedure on the images of stars
taken from the same frames as the galaxies to generate effective PSF’s in each band.
In each frame we identify a star 1) whose central brightness differs by less than
from the central SB of the galaxy and 2) which is distant from
other contaminating sources, as requested
for the galaxy selection. Then, sources other than the star are masked, the frame is re-centred
on the star and the same geometrical transformations as applied to the galaxy are performed.
The radial profile of the PSF can be reproduced by a Gaussian core plus exponential wings over
a large extension.
Fig. 4 shows the analytic fit to the measured PSF’s in the four bands, expressed as the
difference of magnitude with respect to the central surface brightness. The decline in the core
is very sharp, within 5 pixel, and the exponential wings
contribute less than of the central surface brightness at radii larger than 20 pixels.
We will analyse the effects of the PSF on the measured profiles in the next section, by convolving
with different models for the light distributions.

The characteristics of the observed halo profiles show little or no dependence on the scale-length adopted for rescaling the images of the galaxies. In Fig. 5 we plot the SB profile in the PA wedge in the four bands, using different symbols for the different rescalings: open circles for , filled triangles for , open squares for and filled circles for . The coordinate of each point is exactly rescaled in order to match the sample median values of the four scale-lengths considered. As in Fig. 3, the shaded areas represent the sky rms. The error-bars are calculated as explained before.


The agreement between the different rescalings is extremely good: almost all points are consistent within the error-bars, with a handful of exceptions for the rescaling. Even for these, the deviation is less than 3 . Thus we conclude that there is no systematic dependence of the average halo properties on the profile shape of the disk as described by variations in relative scale-lengths.
4.3 Modelling the halo
In this section we investigate the structural properties of the detected emission by means of
simple models of the light distribution. In particular, we consider the possible contribution
from a thick disk component, with an exponential vertical light density distribution, and from
a (moderately) flattened power-law halo. Making predictions from models of this kind
is non-trivial and must take into account that the observed emission results from a
double convolution of the ‘true’ average light density distribution of the galaxies with 1) the
distribution of inclinations and 2) the effective PSF, as computed above.
The models are calculated as follows. First we assume a particular 3-dimensional
distribution of light. We produce a set of 1000 Monte Carlo realizations of the projected surface
brightness, uniformly varying the inclination angle of the disk between 0 and 15 degrees (roughly
corresponding to a projected axial ratio between 0 and 0.25 for an infinitely thin disk,
as required by the sample selection criterion for the galaxies). The 1000 realizations are then
averaged and convolved with the analytic PSF computed in the previous section, separately for each
band.
We do not expect to reproduce the stacked images near the nucleus nor at small distances from
the disk plane, because we do not model dust extinction. Thus we compare our
models to the observations by means of vertical-cut profiles, that allow us to exclude these
‘forbidden’ regions. In each cut, whose width is chosen to be proportional to the distance
from the minor axis of the image, we average the flux coming from the four quadrants.
In the thin+thick disk model the 3-dimensional light density of each individual galaxy is assumed to be given by:
| (4) |
where is the normalisation factor, is the flux ratio of the thick over the thin disk,
is the exponential scale-length of the radial SB distribution, and are the
exponential vertical scale-lengths of the thin and thick disks respectively. We fix
pixels, and pixel. No disk truncation is adopted.
The realizations cover
a logarithmic spaced grid of four by four values in the parameter space
( ranging from to pixels, from 0.01 to 0.4). The
normalisation is left as a free parameter and fitted by minimising the .
We find that the thin+thick disk models fail to reproduce the observed SB distribution of the
observed halos, since they predict a sharp exponential cut-off
of the SB along the coordinate, which is inconsistent with the observed power-law profile.

In the disk+halo models, we assume a halo component with a generalised Hubble density distribution as introduced by Elson, Fall & Freeman (1987), modified to allow the iso-density surface to be oblate spheroids:
| (5) |
where is the flattening parameter, is the softening parameter or core radius555 The core radius is introduced only for mathematical convenience, to avoid the central divergence of a pure power law., and is the power-law index of the projected SB. The disk component is modelled by a double exponential distribution in and , without any truncation:
| (6) |
with and representing the exponential scale lengths in and respectively.
We fix pixel and pixels, and realize a grid of models in the
parameter space, covering the following ranges: ,
, . The total (disk+halo) normalisation and the normalisation
of the halo relative to the disk for each model on the grid have been fitted by minimising
the .
The best fitting models for the , , and band are represented in Fig. 6. For
each band we plot the vertical SB profiles at four different distances from the centre
of the galaxy, as obtained in the vertical cuts described above, offset by
one from the other. Even if the are extremely high, thus
demonstrating that the adopted models cannot reproduce in the details the complexity of the
galaxy structure, the general agreement with the measured points is satisfactory and we are
successful in reproducing the trend of the profiles.
Besides the total model profiles (heavy lines), we plot also the exponential disk components alone
(light lines): while dominating at small height, they give negligible contribution at
pixels ().
The best fitting model parameters are reported in the panels of Fig. 6. The disk
scale-height is quite well constrained to . The power-law slope ()
is steeper in band (2.50), and increasingly shallower in and (2.00) and band (1.50), while
the halo shapes get increasingly rounder from in , to 0.60 in and , and 0.70 in
z band. This is in good agreement with the previous analysis on the images themselves
and on the radial profiles.
The surface brightness of the halo component at along the minor axis is
25.84, 25.82, 25.03 and 25.26 in the , , and band respectively.
We can estimate the amount of halo light coming from outside the
isophote as per cent
of the total galaxy light.
The models derived above allow us to quantify the pollution of the outer envelope by scattered
light and PSF wings. We note that, at pix, the PSF-convolved disk component
contributes per cent of the total surface brightness66620 per cent in the , 33 per cent in the and
the , and 40 per cent in the band. This contribution decreases
very rapidly at larger distances, and becomes negligible at pix in all the bands.
We conclude that scattered light from the disk
contributes much less than 30 per cent of the total (disk+halo) measured light beyond 20 pixel.
4.4 The halo colours
Based on the SB profiles presented in Sec. 4.2, we derive the colour profiles in
the two -aperture sectors including the disk and perpendicular to it. We concentrate
on the and colours, excluding colours involving the band, because of its lower sensitivity.
In Fig. 7 the dots represent the colours measured perpendicular to the
disk, with the error-bars derived from the errors on the SB profiles; for comparison,
with the dotted lines we plot the
colour profiles for the disk. This has a blueing gradient toward the outer parts, which
is particularly evident for , but it is still clearly apparent in . Disk colours
(, ) are consistent with typical star-forming galaxies,
once we allow for significant dust extinction, as expected for edge-on conditions.
The increasing presence of dust near the galaxy centre and age and metallicity gradients
in the disk can also easily explain the observed gradients.
Beyond there is evidence for colours getting redder, possibly indicating
that the halo is overtaking the disk. This is consistent with the steepening of the
profiles of the ‘pure disk’, shown as dashed lines in Fig. 3.
The profile perpendicular to the disk is extremely noisy: no clear trend can be established
and the measurements are definitely unreliable beyond 20 pixels. The halo in these bands is roughly
as red as the inner parts of the disk.
The colour shows instead a clear reddening toward the outskirts of the galaxy, reaching
extremely red colours , about 0.4 mag redder than the disk.
We derive the best estimate of the halo colours using the mean colour around 20 pixels
and consider the uncertainties given both by the error bars and by the scatter of the
points around an ‘ideal’, smooth profile:

These results are not corrected for the effects of the PSF. Based on the analysis in
the previous section, we estimate that the SB at pixel is polluted by scattered light
from the inner parts by up to per cent. However, this contribution is very similar in all the
bands (20 per cent in the , 33 per cent in the and the bands) and can redden the real halo colours
by some hundredths up to 0.2 mag (worse case for ). It is worth stressing
that this assessment has large uncertainties, due to the very simplistic nature of
the models here adopted and to their extreme sensitivity to the fitting parameters (e.g.,
changing the vertical scale-length of the disk affects very slightly the goodness of the
fit, but can significantly change the disk and scattered light contributions to
the colours at 20 pixels).
The robustness and the significance of the estimates given above,
will be discussed in detail in Sec.5.
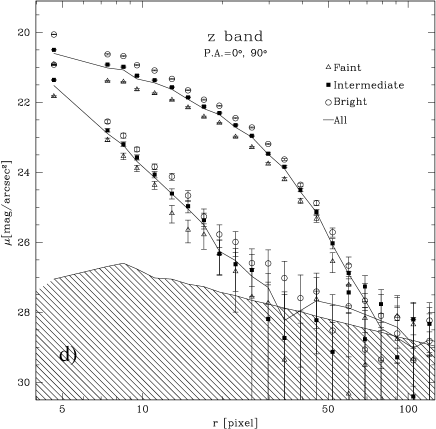
4.5 Dependence on the total galaxy luminosity
In order to understand the dependence of the halo features on the galaxy luminosity, we analyse the stacked images (exponential scale-length rescaling) for three luminosity bins in the band, namely the ‘bright’ (), the ‘intermediate’ () and the ‘faint’ one ). The profiles at and PA (obtained as in Sec. 4.2) are plotted in Fig. 8: open triangles for the ‘faint’ bin, filled squares for the ‘intermediate’, and open circles for the ‘bright’. The solid lines running through the points are the profiles as obtained from the complete sample. We notice that the halo SB is correlated with the luminosity of the galaxy, with the less luminous ones having also fainter halos. A similar correlation with the total luminosity holds for the disk SB as well, indicating that the relative brightness of the halo with respect to the disk is roughly constant. This luminosity dependence is barely observable in the band, but becomes increasingly evident at longer wavelengths, with an average offset of between the ‘bright’ and the ‘faint’ profile in the band. This also implies that the halos of the bright galaxies are redder than the faint ones by some in both and colours.


5 Discussion
The analysis performed in the previous section provides strong evidences for the generalised
presence of a diffuse, low-surface brightness stellar component around disk galaxies. By stacking
more than 1000 images, we are able to extract reliable photometry at SB level as faint as
in the , and band and
in the band.
It is worth stressing that the statistical estimator adopted in this work to compute the combined
images is extremely robust. The evaluation of the for each pixel in the composite image
as , with the calculated over the count distribution
after rejecting the 16 per cent percentile tails and the masked pixels, is effective in removing outliers and
spurious contributions from other sources, and in correcting for the skewness of the distribution,
while reducing the noise of the standard estimation.
The isophotal contours superposed to the images in Fig. 2 show the
presence of luminous halos whose shape is clearly rounder than the highly flattened central
disk. The shape of the effective PSF, obtained from the stacking of 1000 stars selected from
the same frames and with similar criteria as the galaxies, after applying the same geometrical
transformations, is not consistent with scattered light and extended PSF wings giving
a major contribution to the light detected in the halo.
Comparisons with the light distribution expected from simple thin+thick disk models, in which we
have accounted for the whole range of galaxy inclinations and for the effective PSF, demonstrate
that no exponential vertical disk component can yield the observed power-law shape of the
SB profiles at in any of the four considered bands. Adding a moderately flattened
(), power-law ( or ) halo component to a simple exponential disk, it is
possible to reproduce the basic features in the observed profiles quite well.
It could be argued, that the emission we detect in the outer regions is produced by small bulges.
However, MacArthur, Courteau & Holtzman (2003) have shown that the bulges of disk-dominated
galaxies, like the ones in our sample, are in general well represented by exponential laws
with ( and
being the exponential scale-length of the bulge and of the disk respectively).
Assuming an upper limit of for the central surface brightness
of the bulge, this implies that bulges contribute no more than
beyond 20 pixels. The light we have measured is thus not a simple outward extension of the small
bulges often seen in late-type galaxies.
We have shown in Fig. 5 that the results obtained are independent
of the scale-length adopted for rescaling the galaxies: this is a strong indication for the absence
of any significant dependence of halo characteristics on the detailed shape of the disk SB profile, even
if it does not necessarily imply complete homology of the disks in our sample.
These results are consistent with some known features of the Milky Way halo. Confirming
previous results by Harris (1976), Zinn (1985) derived a halo stellar density
declining as from the distribution of the globular clusters.
Similar results were obtained from the
RR Lyrae distribution by Saha (1985), , by Preston, Shectman & Beers (1991),
, and by Ivezić et al. (2000), . The spatial distribution of Blue Horizontal Branch (BHB)
stars (Preston et al. 1991; Kinman, Suntzeff & Kraft 1994) is in good good agreement with those estimates,
yielding at height above the
disk plane. The SB provided by the MW halo stars is expected to be roughly of the order of
at in V band
(Binney & Merrifield, 1998, par. 10.5), consistently with our measurements in band.
The analysis by Hartwick (1987) and by Preston et al. (1991),
considering RR Lyrae and BHB stars, provides an estimate for moderate flattening of the
spheroidal halo , which is also consistent with the findings in this work.
Comparisons with analogous studies of external galaxies are in general difficult.
Although its
small distance makes M31 the easiest target for observing of the halo population
of a disk galaxy, the prominence of its bulge makes it hard to disentangle the density
distribution of the halo so that it is perhaps more appropriate to talk about a generic spheroid.
Pritchet & van den Bergh (1994) measured the SB of M31 spheroid to and
concluded that it can be modelled either by a de Vaucouleurs law or,
in its outer parts, by a power-law , which
is much steeper than what we find. However, the globular cluster distribution
follows (Racine, 1991) and there is evidence for a shallower
power-law index in the outer parts of the halo from more recent observations
(Irwin, private communication).
Recent observations of the red giant stars of the nearby, late-type spiral
M33 (Ferguson et al. 2003, in preparation), seem to exclude the presence
of a spheroidal component around this galaxy, but its nearly face-on aspect
makes it difficult to draw firm conclusions.
Results from more distant galaxies are even more uncertain, because of the overwhelming
difficulties in going
deeper than . After the first claim by Sackett et al. (1994)
of the detection of halo emission from NGC5907, many discrepant measurements have
been made by different groups
in bands from the optical to the NIR (see e.g. Barnaby & Thronson, 1994; Lequeux et al., 1996; Rudy et al., 1997; James & Casali, 1998; Lequeux et al., 1998). The latest observations by Zheng et al. (1999) with intermediate-band
filters, and by Yost et al. (2000) in optical and NIR, together with the RGB
star counts derived by Zepf et al. (2000) from NICMOS observations, seem to rule
out the presence of a halo,
favouring instead a luminous ring produced by the tidal disruption of a dwarf companion.
However, despite the non-detection of any diffuse component in the Scd galaxy NGC 4244
by Fry et al. (1999), probably because of the low sensitivity of their observations
(), many studies during
the last years support the idea of a luminous envelope (thick disk or
halo) surrounding many of disk galaxies. Morrison et al. (1997) detected
thick disk emission from NGC 891; Abe et al. (1999) have measured and light
excesses with respect to an exponential disk model in the Scd galaxy
IC 5249; Wu et al. (2002) have observed NGC 4565 at Å obtaining good
accuracy photometry as faint as and found
a halo component with power-law . Similar
results are found by Rauscher et al. (1998) in the NIR K band for ESO 240-G11 (power-law
halo ). After observing a sample of 47 extremely flat
galaxies in , and down to extremely faint SB, Dalcanton & Bernstein (2002)
have claimed the ubiquitous presence of red stellar envelopes around
disk galaxies. It is not clear whether these envelopes extend to a spheroidal
halo or are just thick disks, as the authors claim, because
their detection limits are just at the surface brightness where we start
to see our power-law halo component unambiguously
In order to establish the origins of these stellar populations, very precise colour
measurements are needed. Due to the enormous observational difficulties, reliable
colour measurements of the halos around disks are very scarce: excluding the MW,
M31 and M33 for which colour-magnitude diagrams of halo stars and globular clusters
can be obtained, the only optical colours
available to now are the ones derived by Lequeux et al. (1998) for NGC 5907.
Beside these, Dalcanton & Bernstein (2002) have measured and for
the thick disks in their sample.
The colours we derived in Sec. 4.4 are, in fact, very uncertain,
both because of the intrinsic error of the measurements and because of the
practical impossibility to avoid contributions from the disk component. The analysis
in Sec. 4.4 showed that scattered light from the disk component
is likely to affect the colours by a few hundredths of a mag, but colour excesses up to
0.2 mag cannot be ruled out.
If we trust these results (, ), we
find that halos are made of stars which are only
marginally () consistent with old, moderately metal-poor stellar populations.

In Fig. 9 we compare the stacked halo , colours with
different data taken from the literature777Photometric transformations
between different standards are taken from Smith et al. (2002)..
Our point (open circle with error bars) is almost inconsistent with the colours
of the MW
globular clusters (filled circles, from Harris, 1996), being much redder in ,
and as red as the metal-rich tail of the globular cluster distribution in .
We have highlighted 47 Tucanae in the plot (starred dot), because its integrated
colours are very similar to M31’s halo. Its is about the
same as our measurements.
We note that is also consistent with the blue end of the elliptical sequence
as derived from the SDSS at the median redshift of the sample
(filled square, Bernardi et al., 2003),
and from the observations in Virgo and Coma
by Gavazzi et al. in B and V, as given in GOLDMiNe (Gavazzi et al., 2003), whose
interquartile range is represented by the back-shaded area.
Reasonable agreement is found with the optical colours derived by
Dalcanton & Bernstein (2002) for their thick disks (whose range is represented
by the shaded area in Fig. 9).
Reconciling the measured colour with any known stellar population is
almost impossible, even if we allow for an extreme 0.1 mag reddening caused
by the PSF, as discussed in Sec. 4.4.
It is however interesting to note that the colours derived for
NGC 5907 by Lequeux et al. (1998) are consistent with ours, but nonetheless
troublesome. We exclude significant dust reddening for two
reasons. First, the unusually red colour in our data is , despite the
fact that dust mostly affects optical/blue bands. Second, in the profile
there is quite strong evidence for a red gradient toward the outer parts,
whereas it is known that the dust is concentrated in a thin layer in the disk.
Thus we conclude that
there is evidence for the halos being made of extremely red stellar
populations. This is likely to be primarily due to an old age, but other
effects, such as high metallicity or ‘exotic’ low-mass dominated IMF,
would be required in order to explain the unusually high .
Our red colours seem to exclude the possibility that the majority
of the halos we observe around disk galaxies are made of metal-poor
stars, or that they result from the integrated light of
globular cluster populations.
The correlation between the disk and halo SB suggests
a link between the two components.
On the other hand, the high latitude extension of the emission
rules out ‘disk heating’ as an effective formation mechanism.
An accretion (or ‘cannibalism’) scenario, in which the halo is built up by
capture and disruption of spheroidal satellites, presents
many advantages in explaining the observations. In this scenario dwarf spheroidal
galaxies, made of old, metal enriched stars, are tidally disrupted by the
gravitational field of the central galaxy and their stars are spread to fill
the phase space almost isotropically in a few dynamical times. Thus both the
spheroidal shapes and the extremely red colours of the halos could be explained,
at least qualitatively. As already mentioned, recent observations in the halo
of MW and M31, of the Sagittarius stream in the MW,
and of the ring in the halo of NGC 5907
support the idea that this mechanism has been working till very
recent times and is not uncommon among the disk galaxies.
Our analysis in different luminosity bins shows that the
halo luminosity, at least on average, is proportional to disk luminosity.
Prominent halos are in the more luminous galaxies. The decrease of the
average surface brightness at lower luminosity affects mostly the redder
pass-bands and is reflection of the well known correlation of disk
surface brightness with disk luminosity in the red bands (see e.g. Shen et al., 2003).
The light we see does not appear to be a straightforward extension of the bulge,
since the power-law shapes of
the profiles, irrespective of luminosity, are not consistent
with classical de Vaucouleurs or exponential bulges. We can interpret the
halo-disk luminosity relation we find here in the hierarchical picture, in which
more luminous galaxies sit in more massive DM halos, with a larger number
of merging sub-halos contributing to the stellar halo luminosity.
However, deeper and more detailed observations, along with more reliable
theoretical predictions for the number, stellar mass and metal content of the
accreted satellites, are needed in order to confirm this hypothesis.
6 Summary and conclusions
By stacking a large number () of edge-on disk galaxies imaged in the SDSS
we have been able to detect a diffuse, spheroidal, low-surface brightness
component around the disk. This detection is significant
in the , , and bands, and cannot be ascribed to any obvious
instrumental artifact (e.g. scattered light or PSF). Given the statistical estimator
we adopt for combining the images, our result indicates that a substantial
fraction of the stacked galaxies must share the observed halo characteristics,
even if we cannot exclude the possibility that a number of disk galaxies actually have
no halo at all.
The halo can be described by a power-law projected density profile
, with nearly irrespective of the band.
The colour measurements provide inconclusive and troublesome results, but there is
a clear indication for extremely red colours. is consistent
with old, moderately metal-poor stellar populations, such as the more metal-rich
MW’s globular clusters, 47 Tucanae, the halo of M31 and the most metal-poor
ellipticals. is (at ) 0.2 mag redder than the reddest known stellar populations
in globular clusters and elliptical galaxies
and it is difficult to reconcile with any theoretical models, even allowing for
ad hoc modified IMF’s dominated by low-mass stars and high metallicity.
The data also suggest a correlation between the luminosity of the halo and the
total luminosity of the galaxy.
The results presented in this work are far from being conclusive, but nevertheless
they are consistent with the idea that a large fraction of disk galaxies
are surrounded by a luminous halo. The colours, although affected
by large uncertainties, hint at old, but not particularly metal-poor stellar
populations, thus supporting a scenario in which the halos are mostly contributed
by stars stripped from accreted or merged companions, in which the chemical
evolution was already advanced.
Deeper, individual observations of a large sample of nearby galaxies will
be required, however, in order to assess the validity of this scenario by
quantifying not only the average halo, but also the whole distribution
of individual halo parameters.
We wish to thank the referees James Lequeux and Francoise Combes for
helpful advice.
S.Z. wishes to thank Annette Ferguson, Stéphane Charlot, Amina Helmi
and Tim McKay for the useful discussions.
Funding for the creation and distribution of the SDSS Archive has been provided
by the Alfred P. Sloan Foundation, the Participating Institutions, the National
Aeronautics and Space Administration, the National Science Foundation, the U.S.
Department of Energy, the Japanese Monbukagakusho, and the Max Planck Society.
The SDSS Web site is http://www.sdss.org/.
The SDSS is managed by the Astrophysical Research Consortium (ARC) for the
Participating Institutions. The Participating Institutions are The University
of Chicago, Fermilab, the Institute for Advanced Study, the Japan Participation
Group, The Johns Hopkins University, Los Alamos National Laboratory, the
Max-Planck-Institute for Astronomy (MPIA), the Max-Planck-Institute for Astrophysics (MPA),
New Mexico State University, University of Pittsburgh, Princeton University,
the United States Naval Observatory, and the University of Washington.
References
- Abazajian et al. (2003) Abazajian K., et al. 2003, preprint(astro-ph/0305492)
- Abe et al. (1999) Abe F., et al. 1999, AJ, 118, 261
- Barnaby & Thronson (1994) Barnaby D., Thronson H. A., 1994, AJ, 107, 1717
- Baugh et al. (1996) Baugh C. M., Cole S., Frenk C. S., 1996, MNRAS, 283, 1361
- Benson et al. (2000) Benson A. J., Baugh C. M., Cole S., Frenk C. S., Lacey C. G., 2000, MNRAS, 316, 107
- Bernardi et al. (2003) Bernardi M., et al. 2003, AJ, 125, 1882
- Bertin & Arnouts (1996) Bertin E., Arnouts S., 1996, A&AS, 117, 393
- Binney & Merrifield (1998) Binney J., Merrifield M., 1998, Galactic astronomy. Princeton University Press, Princeton, NJ
- Blanton et al. (2002) Blanton M. R., et al. 2002, preprint(astro-ph/0210215)
- Blanton et al. (2003) Blanton M. R., Lin H., Lupton R. H., Maley F. M., Young N., Zehavi I., Loveday J., 2003, AJ, 125, 2276
- Dalcanton & Bernstein (2002) Dalcanton J. J., Bernstein R. A., 2002, AJ, 124, 1328
- Elson et al. (1987) Elson R. A. W., Fall S. M., Freeman K. C., 1987, ApJ, 323, 54
- Ferguson et al. (2002) Ferguson A. M. N., Irwin M. J., Ibata R. A., Lewis G. F., Tanvir N. R., 2002, AJ, 124, 1452
- Fry et al. (1999) Fry A. M., Morrison H. L., Harding P., Boroson T. A., 1999, AJ, 118, 1209
- Fukugita et al. (1996) Fukugita M., Ichikawa T., Gunn J. E., Doi M., Shimasaku K., Schneider D. P., 1996, AJ, 111, 1748
- Gavazzi et al. (2003) Gavazzi G., Boselli A., Donati A., Franzetti P., Scodeggio M., 2003, A&A, 400, 451
- Gunn et al. (1998) Gunn J. E., et al. 1998, AJ, 116, 3040
- Harris (1976) Harris W. E., 1976, AJ, 81, 1095
- Harris (1996) Harris W. E., 1996, AJ, 112, 1487
- Hartwick (1987) Hartwick F. D. A., 1987, in NATO ASIC Proc. 207: The Galaxy The structure of the Galactic halo. pp 281–290
- Helmi et al. (1999) Helmi A., White S. D. M., de Zeeuw P. T., Zhao H., 1999, Nature, 402, 53
- Hogg et al. (2001) Hogg D. W., Finkbeiner D. P., Schlegel D. J., Gunn J. E., 2001, AJ, 122, 2129
- Ibata et al. (1994) Ibata R. A., Gilmore G., Irwin M. J., 1994, Nature, 370, 194
- Ibata et al. (2003) Ibata R. A., Irwin M. J., Lewis G. F., Ferguson A. M. N., Tanvir N., 2003, MNRAS, 340, L21
- Ivezić et al. (2000) Ivezić Ž., et al. 2000, AJ, 120, 963
- James & Casali (1998) James P. A., Casali M. M., 1998, MNRAS, 301, 280
- Kauffmann et al. (1999) Kauffmann G., Colberg J. M., Diaferio A., White S. D. M., 1999, MNRAS, 303, 188
- Kauffmann et al. (1997) Kauffmann G., Nusser A., Steinmetz M., 1997, MNRAS, 286, 795
- Kauffmann et al. (1993) Kauffmann G., White S. D. M., Guiderdoni B., 1993, MNRAS, 264, 201
- Kinman et al. (1994) Kinman T. D., Suntzeff N. B., Kraft R. P., 1994, AJ, 108, 1722
- Kregel et al. (2002) Kregel M., van der Kruit P. C., de Grijs R., 2002, MNRAS, 334, 646
- Lequeux et al. (1998) Lequeux J., Combes F., Dantel-Fort M., Cuillandre J.-C., Fort B., Mellier Y., 1998, A&A, 334, L9
- Lequeux et al. (1996) Lequeux J., Fort B., Dantel-Fort M., Cuillandre J.-C., Mellier Y., 1996, A&A, 312, L1
- Lupton et al. (2001) Lupton R. H., Gunn J. E., Ivezić Z., Knapp G. R., Kent S., Yasuda N., 2001, in ASP Conf. Ser. 238: Astronomical Data Analysis Software and Systems X The SDSS Imaging Pipelines. pp 269–+
- MacArthur et al. (2003) MacArthur L. A., Courteau S., Holtzman J. A., 2003, ApJ, 582, 689
- Majewski (1993) Majewski S. R., 1993, ARA&A, 31, 575
- Morrison et al. (1997) Morrison H. L., Miller E. D., Harding P., Stinebring D. R., Boroson T. A., 1997, AJ, 113, 2061
- Navarro & Steinmetz (2000) Navarro J. F., Steinmetz M., 2000, ApJ, 538, 477
- Navarro & White (1994) Navarro J. F., White S. D. M., 1994, MNRAS, 267, 401
- Odenkirchen et al. (2002) Odenkirchen M., Grebel E. K., Dehnen W., Rix H., Cudworth K. M., 2002, AJ, 124, 1497
- Petrosian (1976) Petrosian V., 1976, ApJ, 209, L1
- Pier et al. (2003) Pier J. R., Munn J. A., Hindsley R. B., Hennessy G. S., Kent S. M., Lupton R. H., Ivezić Ž., 2003, AJ, 125, 1559
- Preston et al. (1991) Preston G. W., Shectman S. A., Beers T. C., 1991, ApJ, 375, 121
- Pritchet & van den Bergh (1994) Pritchet C. J., van den Bergh S., 1994, AJ, 107, 1730
- Racine (1991) Racine R., 1991, AJ, 101, 865
- Rauscher et al. (1998) Rauscher B. J., Lloyd J. P., Barnaby D., Harper D. A., Hereld M., Loewenstein R. F., Severson S. A., Mrozek F., 1998, ApJ, 506, 116
- Rudy et al. (1997) Rudy R. J., Woodward C. E., Hodge T., Fairfield S. W., Harker D. E., 1997, Nature, 387, 159
- Sackett et al. (1994) Sackett P. D., Morrison H. L., Harding P., Boroson T. A., 1994, Nature, 370, 441
- Saha (1985) Saha A., 1985, ApJ, 289, 310
- Scannapieco & Tissera (2003) Scannapieco C., Tissera P. B., 2003, MNRAS, 338, 880
- Schlegel et al. (1998) Schlegel D. J., Finkbeiner D. P., Davis M., 1998, ApJ, 500, 525
- Shen et al. (2003) Shen S., Mo H. J., White S. D. M., Blanton M. R., Kauffmann G., Voges W., Brinkmann J., Csabai I., 2003, preprint(astro-ph/0301527)
- Smith et al. (2002) Smith J. A., et al. 2002, AJ, 123, 2121
- Sommer-Larsen et al. (1999) Sommer-Larsen J., Gelato S., Vedel H., 1999, ApJ, 519, 501
- Somerville & Primack (1999) Somerville R. S., Primack J. R., 1999, MNRAS, 310, 1087
- Springel et al. (2001) Springel V., White S. D. M., Tormen G., Kauffmann G., 2001, MNRAS, 328, 726
- Stoughton et al. (2002) Stoughton C., et al. 2002, AJ, 123, 485
- Strauss et al. (2002) Strauss M. A., et al. 2002, AJ, 124, 1810
- van der Kruit (2001) van der Kruit P. C., 2001, in ASP Conf. Ser. 230: Galaxy Disks and Disk Galaxies Truncations in Stellar Disks. pp 119–126
- Wu et al. (2002) Wu H., et al. 2002, AJ, 123, 1364
- Yanny et al. (2003) Yanny B., Newberg H. J., Grebel E. K., Kent S., Odenkirchen M., Rockosi C. M., Schlegel D., Subbarao M., Brinkmann J., Fukugita M., Ivezic Z., Lamb D. Q., Schneider D. P., York D. G., 2003, ApJ, 588, 824
- York et al. (2000) York D. G., et al. 2000, AJ, 120, 1579
- Yost et al. (2000) Yost S. A., Bock J. J., Kawada M., Lange A. E., Matsumoto T., Uemizu K., Watabe T., Wada T., 2000, ApJ, 535, 644
- Zepf et al. (2000) Zepf S. E., Liu M. C., Marleau F. R., Sackett P. D., Graham J. R., 2000, AJ, 119, 1701
- Zheng et al. (1999) Zheng Z., et al. 1999, AJ, 117, 2757
- Zinn (1985) Zinn R., 1985, ApJ, 293, 424