11email: demers@astro.umontreal.ca 11email: bruno@astro.rug.nl 22institutetext: INAF, Osservatorio Astronomico di Roma Viale del Parco Mellini 84, I-00136 Roma, Italia
22email: battinel@oarhp1.rm.astro.it
Carbon star survey in the Local Group. VII. NGC 3109 a galaxy without a stellar halo
We present a CFH12K wide field survey of the carbon star population in and around NGC 3109. Carbon stars, the brightest members of the intermediate-age population, were found nearly exclusively in and near the disk of NGC 3109, ruling out the existence of an extensive intermediate-age halo like the one found in NGC 6822. Over 400 carbon stars identified have , confirming the nearly universality of mean magnitude of C star populations in Local Group galaxies. Star counts over the field reveal that NGC 3109 is a truncated disk shaped galaxy without an extensive stellar halo. The minor axis star counts reach the foreground density between 4′ and 5′, a distance that can be explained by an inclined disk rather than a spheroidal halo. We calculate a global C/M ratio of 1.75 0.20, a value expected for such a metal poor galaxy.
Key Words.:
Galaxies, individual NGC 3109, stellar population, structure1 Introduction
Halos of galaxies may result from gravitational collapse (Eggen et al. 1962), early in their life, or from the accretion of small fragments (Searle & Zinn 1978). The halo building by accretion should be a continuous process leading to halo populations of different ages and metallicities. Recently, dwarf galaxies have been found to have halos of old stars (Lee 1993; Minniti & Zijlstra 1997; Minniti et al. 1999); or stars older than 1.5 Gyr ( Aparicio & Tikhonov 2000; Aparicio et al. 2000). In this regard, our recent CFH12K observations of NGC 6822 (Letarte et al. 2002) represent a major breakthrough. We detected numerous carbon stars (C stars) in the halo of this Magellanic-type galaxy implying the presence of an intermediate-age population extending at least three times the optical radius. Albert et al. (2000) have also identified C stars at large radii in IC 1613. Do all Magellanic type galaxies have an intermediate-age population in their halo? Is there something special about NGC 6822?
To try to answer these questions we follow two approaches: 1) We are investigating the kinematical properties of C stars in NGC 6822 from radial velocity follow-up observations already acquired; 2) We look at other dwarf galaxies similar or dissimilar to NGC 6822 to search for intermediate-age halos. In this regard, the natural comparison to NGC 6822 is NGC 3109, a galaxy of the same morphological type. In both galaxies, de Blok & Walter (2000) and Barnes & de Blok (2001) have recently mapped extensive HI envelopes.
NGC 3109, a Magellanic dwarf on the outskirts of the Local Group, is a spectacular object seen through a large telescope. With a diameter of nearly 30′, NGC 3109 is one of the largest and brightest galaxy of the southern hemisphere. Well resolved into stars, it has been classified Sm IV by Sandage & Tammann (1981). A prime focus CTIO 4 m photo of this galaxy can be found in Demers et al. (1985). This galaxy, first believed to be irregular because of the lack of an obvious nucleus, is actually a disk galaxy and could possibly be a small spiral (Demers et al. 1985).
During the last decade several photometric investigations of small areas in NGC 3109 have been published. We now have a fairly good estimate of the distance of this galaxy: Musella et al. (1997) derive from 24 Cepheids while Minniti et al. (1999) obtain from the I magnitude of the tip of the red giant branch (TRGB). More recently, Méndez et al. (2002) re-determined distances to out-lying members of the Local Group using the TRGB method. For NGC 3109 they quote . We adopt, for our investigation, the weighted mean of these three estimates . The colour excess and the amount of Galactic extinction toward NGC 3109 are small. Schlegel et al. (1998) obtain E(B–V) = 0.04, from the COBE and IRAS maps at 100 m. This corresponds to E(R–I) = 0.03 and AI = 0.054 using the reddening ratios of Rieke & Lebofsky (1985). This low reddening is consistent with the colour of the ridge of bright stars, seen in Figure 1.
The photometric study of a region, centered on NGC 3109, by Minniti et al. (1999) revealed that this galaxy possesses a Population II halo extending to 4.5′ (1.8 kpc) above and below the plane of the galaxy. These authors determined, from the position of the red giant branch on the CMD, that the metallicity of that population is [Fe/H] = –1.8 0.2. They also noted the presence of red asymptotic giant branch stars (AGB), presumably C stars, in the main body of the galaxy. This metallicity estimate roughly confirms the abundance of –1.6 0.2 determined in the same way by Lee (1993). Méndez et al. (2002) obtained [Fe/H] = –1.69 0.06 also from the colour of the red giant branch. We adopt, for our discussion, the weighted mean value of [Fe/H] = –1.7.
2 Observations
The results presented here are based on observations obtained, in Service Queue observing mode in March 2002, with the CFH12K camera installed at the prime focus of the 3.66 m Canada-France-Hawaii Telescope. The camera consists in a 12 pixel mosaic covering a field of , each pixel corresponding to 0.206 arcsec. Images were obtained through Mould I and R filters and narrowband CN and TiO filters, centered at 808.6 nm and 768.9 nm, respectively. A summary of the acquired data is presented in Table 1. The total exposure time on NGC 3109 was 6 hours, under excellent seeing.
The data distributed by the CFHT have been detrended. This means that the images have already been corrected with the master darks, biases, and flats. Fringes have been removed on I exposures under 60 seconds and large scale structures such as the “Skyring” effect have been removed when relevant. This pre-analysis produces 12 CCD images, of a given mosaic, with the same zero point and magnitude scale.
We carefully combine images taken with the same filter, making sure that the final FWHM was similar to the average FWHM given in Table 1. The photometric reductions were done by fitting model point-spread functions (PSFs) using DAOPHOT-II/ALLSTAR series of programs (Stetson 1987, 1994). Instrumental magnitudes are calibrated using equations provided by the CFHT QSO team. The equations for R and I magnitudes are:
where Xr and Xi are the airmasses of the R and I exposures. For the instrumental magnitudes r and i, obtained with DAOPHOT, and for the given exposure times, and correspond to:
By subtracting the above R and I equations and using the appropriate airmasses we obtain:

3 Results
The colour-magnitude diagram (CMD) of the whole CFH12K field is presented in Figure 1. 38600 stars, with (R–I) colours with photometric errors less than 0.1 mag. are plotted. Since our observations were acquired to survey the C star population, they reach only 1.5 mag below the tip of the red giant branch. This limit is quite sufficient to detect all the C stars that can be resolved.
The C stars are selected from the colour-colour diagram where we plot their (CN–TiO) index versus their (R–I) color. Throughout this series of papers we have selected as an adoption criterion, stars with , where . In general this is not a magnitude cutoff criterion, but depends on the quality of the (CN–TiO) index whose errors are always the largest. Experience has shown that these narrow filters require exposures three to four times longer than I exposures. As shown in Table 1 the CN and TiO exposures are 3.78 times longer than I. Some 24000 stars satisfy this criterion. They are plotted on the colour-colour diagram presented in Figure 2. The zero point of the (CN–TiO) index is set according to the procedure outlined by Brewer et al. (1995). We set the mean of (CN–TiO) = 0.0 for all blue stars since hot stars are expected to have a featureless spectra in the CN and TiO regions. We thus define a blue star, as in Letarte et al. (2002), i.e. as a star in the colour range . This of course requires an estimate of the local colour excess which is adopted in the Introduction. We define C and M stars as stars with (R–I)0 0.90: C stars have (CN–TiO) 0.3, while (CN–TiO) 0.0 for M stars. The C star branch obviously extends to bluer colours. These C stars have fainter magnitudes (Demers & Battinelli 2002) than those inside the box. The limit (R–I)0 = 0.90 corresponds to spectral type M0. From this diagram we count, in the box, 446 C stars.
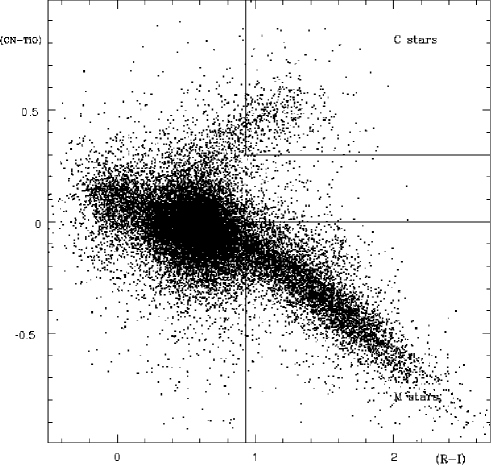
Contrary to similar diagrams of other Local Group galaxies, already published by us, the NGC 3109 colour-colour diagram shows substantially more scatter. We see many points where one does not expect to see any, for example, below the central concentration on the blue side of the M box. This aspect of the diagram is explained by the poor quality of the photometry of the (CN – TiO) index. Indeed, 57% of the stars lying in the “forbidden” regions of the colour-colour diagram have (CN–TiO) photometric errors larger than 0.075 while such fraction is only 7% among the identified C stars. We conclude from this scatter that the CN and TiO exposures should have been somewhat longer.
We list, in Table 2, the J2000.0 coordinates of the C stars identified along with their magnitude and colours. The 446 C stars are identified, by large dots, in the mosaic of the field in Figure 3. From this figure, it is obvious that NGC 3109 does not possess an extended intermediate-age halo, like the one seen around NGC 6822 by Letarte et al. (2002). Thirty of the 446 C star candidates (7%) have photometric errors, for their (CN–TiO) index larger than 0.075. They are represented, on Fig. 3, by the open squares. We believe that these stars are probably not genuine C stars. They could be eliminated from our list by tightening up our error criterion but we prefer to keep the selection criterion at 0.125 to be coherent with other papers of the series.
-
a
Complete Table 2 is available in electronic form at the CDS via anonymous ftp to cdsarc.u-strasbg.fr (130.79.128.5) or via http://cdsweb.u-strasbg.fr/cgi-bin/qcat?J/A+A. A portion is shown here for guidance regarding its form and content. Units of right ascensions are hours, minutes and seconds, and units of declination are degrees, arcminutes and arcseconds.

4 Discussion
4.1 The photometric properties of C stars
The I magnitude distribution of the C stars is displayed in Figure 4. The shaded areas corresponds to the 30 stars with extreme (CN–TiO) errors. The three faintest stars of our sample are among this subset but the other ones are found at any magnitudes. Over a third of the stars in this subset have (CN–TiO) 0.3, very near the border of the C star box.
The mean I magnitude for the 446 stars is = 20.93, while for the 416 C stars of better photometric quality = 20.91, corresponding to a mean absolute magnitude of = –4.71 a value, within the uncertainty of the distances, identical to the mean found for C stars in NGC 6822 (Letarte et al. 2002) and IC 1613 (Albert, et al. 2000). Their mean colour is = 1.17.

Figure 5 presents a comparison of the of C star population of various galaxies. The majority of the data points are taken from our own investigations, with the exception of the two Magellanic Clouds where we use the DENIS data, for the SMC and data from Costa & Frogel (1996) for the LMC. In both cases we select only stars in our predefined colour range. For the DENIS data we adopt the near infrared colour limits of 1.4 J–K 2.0 which is equivalent to our R–I limits (Demers, et al. 2002). The error bars reflect the uncertainties in distance determinations. For Local Group galaxies this is usually 0.1 mag. Since the publication of our results for SgrDIG, (Demers & Battinelli 2002), a new distance estimate by Momany et al. (2002) brings the galaxy 0.1 mag closer. This is a galaxy, with 16 C stars, that deviates most from the mean. Galaxies with few ( 40) C stars are identified by open circles. The larger galaxies with hundreds of C stars are represented by solid squares. Galaxies with numerous C stars show very little dispersion in the . This suggests that C stars could eventually be found to be useful standard candles. If indeed the of C stars is observationally found to be independent of the metallicity of the parent galaxy, this approach would be more interesting than the TRGB technique which requires an estimate of the metallicity. Furthermore, contrary to Cepheids, C stars require observations at just one epoch. Our ongoing investigation should establish the range of galactic properties where C stars could be used as distance indicators. Of particular interest in this respect is the dichotomy between dwarf elliptical galaxies with no recent star formation and dwarf irregulars with recent star formation. Extreme cases could then be IC 10, as an example of a starburst galaxy, and NGC 147 with NGC 185 as dwarf ellipticals big enough to contain several hundred C stars. The twin satellites of M31 have recently been surveyed by Nowotny et al. (2003) who found the of the C star population to be substantially fainter than Fig. 5 would suggest. Our recent investigation of NGC 147 (Battinelli & Demers 2003) does not support their findings.

4.2 The structure of NGC 3109
Our wide field mosaic of NGC 3109, reaching M, can be used to determine the scale length of the major or minor axis and to study the distribution of the intermediate-age population. From the surface photometry of NGC 3109, Jobin & Carignan (1990) established several of its properties: The inclination of the disk from I photometry is taken to be and the position angle of the disk to be . To facilitate our analysis, we assume that the position angle of the disk of NGC 3109 is exactly 90 degrees thus is aligned East - West.
4.2.1 The major axis profile
We determine the scale length of the disk by counting stars along the major axis, using bins of 1501600 pixels, each having 2.719 arcmin2. The width in the north-south direction corresponds approximately to the FWHM of the minor axis profile, described in the next section. A robust foreground surface density is evaluated by counting stars in two 1000 pixel wide strips, located 500 pixels from the southern and northern borders of the field. A total of 3860 stars, in these strips, yields a foreground density of 13.75 0.22 stars per arcmin2.
The major axis profile is displayed in Figure 6. Counts on the eastern and western sides are averaged and the foreground density is removed from those counts. We presume that in the central area the incompleteness is severe due to crowding. The straight line corresponds to a linear regression from 4′ to 14′. The slope of the line yields an exponential scale length of 2.96 , corresponding to 1.1 kpc, in excellent agreement with 3.1′, determined by Jobin & Carignan (1990).
The discontinuity observed at 14′ must correspond to the end of the disk and not be the result of an wrong estimation of the foreground density. That limit corresponds to 4.7 times the disk scale length. Kregel et al. (2002) determined, for small scale length spirals, that the average ratio of disk truncation radius and scale length is four. Thus, NGC 3109 is quite normal in this respect.

4.2.2 The minor axis profile
In order to better define the minor axis profile and its limit, we count only AGB and old red giants stars. To do so, we exclude, from the counts, stars with (R–I) 0.2 and obvious foreground stars with I 19 mag. Stars are counted in a 2000 pixel N - S strip centered on the galaxy. A foreground density of 11.88 stars per arcmin2 is determined by counting stars in the two strips described in the previous section. This foreground density differs from the one determined previously because here we consider a subset of the stars, as define above. The surface density of C stars along the minor axis is also determined in the same fashion.
Figure 7 presents the surface density (stars/arcmin2) along the minor axis, uncorrected for the foreground, at distances larger than 2′ from the center of NGC 3109. This figure reveals that the counts reach the foreground density at a distance between from the major axis. The dotted line corresponds to the foreground estimate, made independently of the plotted data points. If one assumes that NGC 3109 is shaped like a thin disk with a 75∘ inclination, a 14′ semi-major axis will correspond to a 3.75′ semi-minor axis, close to where we observe the minor axis cutoff. The disk of the galaxy is however not infinitely thin thus the minor axis cutoff is expected to be somewhat larger than 3.75′. This result shows that NGC 3109 does not have a halo made of red giants of all ages, with M–2.

Two minor axis profiles are displayed in Figure 8: the red stars whose profile is plotted in Fig. 7 and C stars represented by open dots. The C star counts are multiplied by 20 to facilitate the comparison. A scale length of 0.576 fits both the red star and C star densities. There is a hint of a short plateau or discontinuity observed in the profile of the red stars in the last few bins. Counts at distances larger than 4′ are very nearly equal to the foreground estimate. We interpret this behavior as an indication of a real cutoff of the stellar population of NGC 3109. The density of C stars is unaffected by the foreground correction since it is zero for these stars but, unfortunately, their numbers are just too small to allow us to follow them beyond . We have excluded, from this analysis, the 30 C stars represented by open squares in Fig. 3.

4.3 The C/M ratio
The C/M ratio of a stellar population is known to be function of the metallicity of that population (Groenewegen 1999). The number of C stars is relatively easy to obtain in a galaxy. On the other hand, the number of M stars is much more difficult to assess because one has to know the contribution of the foreground M stars to the total count. The wide field of view of the CFH12K camera allows to obtain a robust estimation of the foreground counts for galaxies of the size of NGC 3109.
To be consistent with our other publications of this series and to follow Brewer et al. (1995), we select a subset of the M stars (those in the M box of the colour-colour diagram) by applying a lower and upper cutoffs. MAGB must have their M and their I 19.0. The determination of the bolometric magnitude follows the procedure detailed by Battinelli et al. (2003).
We define the “galaxy” by a rectangular area centered on the major axis and with a width of 9′ and a length of 28′. In this area we count 413 C stars and 1318 MAGB stars. The foreground contribution is determined by counting MAGB stars in two strips near the southern and northern borders of the field. The foreground contribution to the MAGB counts of the rectangle was found to be 1083 37 stars. Therefore, 236 51 MAGB stars belong to NGC 3109, yielding a C/M ratio of 1.75 0.20. The M star sample includes stars of spectral type M0 and later.
5 Conclusion
Our wide field survey of NGC 3109 has revealed marked differences with NGC 6822, an other dwarf galaxy of similar morphological type. In term of the C star population, NGC 6822 with nearly 900 C stars has more intermediate-age stars for its luminosity than any other dwarf surveyed. NGC 3109, on the other hand, fits into the general trend of NC versus galactic Mv defined by NGC 205, NGC 147 or IC 1613, galaxies of similar magnitude. Both NGC 3109 and NGC 6822 are surrounded by an extended hydrogen cloud. This is essentially their only common structural feature. C star survey of NGC 6822 has revealed the presence of an extended intermediate-age halo as well as an old halo around that galaxy (Letarte et al. 2002). NGC 3109, contrasts with the latter having no halo of intermediate-age and no stellar halo outside of the (thick) disk. This properties makes NGC 3109 unique among dwarf galaxies and justifies the title of Jobin & Carignan (1990) paper: The dark side of NGC 3109.
Acknowledgements.
This research is funded in parts (S. D.) by the Natural Science and Engineering Council of Canada.References
- (1) Albert, L., Demers, S., & Kunkel, W. E. 2000, AJ, 119, 2780
- (2) Aparicio, A., & Tikhonov, N. 2000, AJ, 119, 2183
- (3) Aparicio, A., Tikhonov, N., & Karachentsev, I. 2000, AJ, 119, 177
- (4) Barnes, D. G., & de Blok, W. J. G. 2001, AJ, 122, 825
- (5) Battinelli, P. & Demers, S. 2003, in preparation.
- (6) Battinelli, P., Demers, S., & Letarte, B. 2003, AJ, 125, 1298
- (7) Brewer, J. P., Richer, H. B., & Crabtree, D. R. 1995, AJ, 109, 2480
- (8) de Blok, W. J. G., & Walter, F. 2000, ApJ, 537, L95
- (9) Costa, E., & Frogel, J. A., 1996, AJ, 112, 2607
- (10) Demers, S.,& Battinelli, P. 2002 AJ, 123, 238
- (11) Demers, S., Dallaire, M., & Battinelli, P. 2002 AJ, 123, 3428
- (12) Demers, S., Kunkel, W. E., & Irwin, M. J. 1985, AJ, 90, 1967
- (13) Eggen, O. J., Lynden-Bell, D., & Sandage, A. R. 1962, ApJ, 136, 748
- (14) Groenewegen, M. A. T. 1999, in: “Asymptotic Giant Branch Stars”, eds. T. Le Bertre, A. Lebre, C. Waelkens, IAU Symp. 191, p. 535
- (15) Jobin, M.,& Carignan, C. 1990, AJ, 100, 648
- (16) Kregel, M., van der Kruit, P. C., & de Grijs, R. 2002, MNRAS, 334, 646
- (17) Lee, M. G. 1993, ApJ, 408, 409
- (18) Letarte, B., Demers, S., Battinelli, P., & Kunkel, W. E. 2002, AJ, 123, 832
- (19) Méndez, B., Davis, M., Moustakas, J., Newman, J., Madore, B. F., & Freedman, W. L. 2002, AJ, 124, 213
- (20) Minniti, D. & Zijlstra, A. A. 1997, AJ, 114, 147
- (21) Minniti, D., Zijlstra, A. A., & Alonso, M. V. 1999, AJ, 117, 881
- (22) Momany, Y., Held, E. V., Saviane, I., & Rizzi, L. 2002, A&A, 384, 393
- (23) Musella, I., Piotto, G., & Capaccioli, M. 1997, AJ, 114, 976
- (24) Nowotny, W., Kerschbaum, F., Olofsson, H., & Schwarz, H. E. 2003, A& A,403, 93
- Rieke & Lebofsky (1985) Rieke, G. M. & Lebofsky, M. J. 1995, ApJ, 288, 618
- (26) Sandage, A. & Tammann, G. A. 1991 Revised Shapley-Ames Catalog of Bright Galaxies Carnegie Inst. of Washington.
- (27) Schlegel, D., Finkbeiner, D., & Davis, M. 1998, ApJ, 500, 525
- (28) Searle, L., & Zinn, R. 1978, ApJ, 225, 357
- (29) Stetson, P. B. 1987, PASP, 99, 191
- (30) Stetson, P. B. 1994, PASP, 106, 250