Search for extraterrestrial point sources of neutrinos with AMANDA-II
Abstract
We present the results of a search for point sources of high energy neutrinos in the northern hemisphere using AMANDA-II data collected in the year 2000. Included are flux limits on several AGN blazars, microquasars, magnetars and other candidate neutrino sources. A search for excesses above a random background of cosmic-ray-induced atmospheric neutrinos and misreconstructed downgoing cosmic-ray muons reveals no statistically significant neutrino point sources. We show that AMANDA-II has achieved the sensitivity required to probe known TeV -ray sources such as the blazar Markarian 501 in its 1997 flaring state at a level where neutrino and -ray fluxes are equal.
pacs:
14.60.Pq,26.65.+t,96.40.Tv,95.85.RyI Introduction
The search for sources of high-energy extraterrestrial neutrinos is the primary mission of the Antarctic Muon and Neutrino Detector Array (AMANDA). The mechanism for accelerating cosmic rays to energies above the “knee” () remains a mystery. Cosmic rays are thought to be accelerated in the shock fronts of galactic objects like supernova remnants, microquasars and magnetars, and in extragalactic sources such as the cores of active galaxies (AGN) and gamma ray bursts (GRB) halzen02 .
High energy protons accelerated in these objects will collide with the ambient gas and radiation surrounding the acceleration region, or with matter or radiation intervening between the source and the Earth. This leads to pion production, the charged pions decaying into highly energetic muon and electron neutrinos, and the neutral pions decaying into the observed -rays. Fermi acceleration of charged particles in magnetic shocks naturally leads to power-law spectra, , where is typically close to -2. By the time the neutrinos reach the Earth, vacuum oscillations will have uniformly populated all three flavors (unless the neutrinos are unstable beacom ). All limits quoted in this letter are on the muon neutrino flux arriving at the Earth; limits at the source will be approximately a factor of two higher due to oscillations.
Neutrino astronomy may provide information complementary to the knowledge obtained from high energy photons and charged particles, since neutrinos propagate directly from their point of origin undeflected by magnetic fields. Therefore they have the potential to reveal “hidden” sources masked by photon absorption. Probing the neutrino sky may bring us closer to solving the cosmic ray mystery, or might even reveal something completely new and unexpected.
II AMANDA-II
AMANDA-II nature is a Cherenkov detector frozen into the antarctic polar icecap. A high energy muon neutrino interacting with the ice or bedrock in the vicinity of the detector results in a high energy muon propagating up to tens of kilometers.
The muon track is reconstructed based on detection of the Cherenkov light emitted as it propagates through a 19-string array of 677 photomultiplier tubes. The median neutrino pointing resolution is 2 - 2.5∘, depending weakly on declination, and is dominated by the resolution of the muon track reconstruction. AMANDA-II demonstrates a significant improvement over its predecessor in acceptance and background rejection, especially near the horizon. Results from the first phase of AMANDA, the 10-string subdetector AMANDA-B10, have been reported in b10 .
Atmospheric muons from cosmic rays that penetrate to AMANDA depths are the dominant background. AMANDA-II views the neutrino sky above the northern hemisphere using the Earth as an atmospheric muon filter. Cosmic rays also produce neutrinos in the Earth’s atmosphere, but with a spectral index of , softer than expected for astrophysical sources. Atmospheric neutrinos are an important source for calibration in AMANDA amaatmos , but are also background to a search for extraterrestrial point sources. A point source search is conducted by looking for excess events above the background, which is experimentally measured for a given angular search bin by taking the average background rate in the same band of declination.
III Data Processing & Detector Simulation
The data set comprises triggered events collected over 238 days between February and November, 2000, with 197.0 days livetime after correcting for 17.2% detector dead-time. After application of an iterative series of maximum-likelihood reconstruction algorithms, 2.1 million events reconstructed with declination remain in the experimental sample.
To prevent bias in the selection of cuts, the data are “blinded” by randomizing the reconstructed Right Ascension (R.A.) angle of each event. The output of a Neural Network (NN) trained on simulated events and using six input variables (such as the number of unscattered photon hits, track length, likelihood of the muon track reconstruction, and topological variables amaatmos ), is used as a quality cut. A second cut is placed on the likelihood ratio (LR) between the muon track reconstruction and a muon reconstruction weighted by an atmospheric muon prior bayesian . The prior describes the zenith-dependent frequency of downgoing muons such that choosing a cut on the LR gives downgoing hypotheses a prior weight of up to more than the upgoing hypotheses, effectively forcing events surviving the cut to be of higher quality. The final choice of NN quality cut, likelihood ratio cut, and the optimum size for a search bin are determined independently in each band of declination in order to optimize the limit setting potential of the experiment mrp . The directional information is then restored (data “unblinded”) for the calculation of the limits and significances.
A full simulation chain b10 including neutrino absorption in the Earth, neutral current regeneration, muon propagation and detector response is used to simulate the point source signal according to an energy spectrum. The limits obtained in this analysis are a function of the measured background, , as well as the expected number of events, , from a simulated flux : where is the number of observed events in the given source bin, and is the 90% upper limit on the number of events following the unified ordering prescription of Feldman and Cousins fc98 .
IV Systematic Uncertainties
Atmospheric neutrinos were used to determine the absolute normalization of the detector simulation. The normalization factor 0.86 is consistent with the theoretical uncertainty of 25% on the atmospheric neutrino flux amaatmos . The overall systematic uncertainty, which includes the theoretical uncertainty of the atmospheric neutrino flux and statistical uncertainty of the measured background, is incorporated into the limits using the Cousins-Highland ch92 prescription with unified Feldman-Cousins ordering fc98 ; conrad but with a more appropriate choice of the likelihood ratio test hill03 .
Coincident events between the SPASE air shower array spase and AMANDA-II were used to evaluate the systematic error in pointing accuracy. This value was determined to be less than , which results in signal loss in a typical search bin of only 5%.
V Results
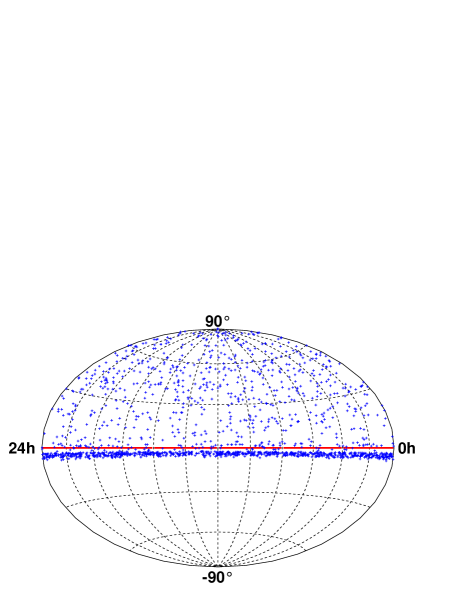
The final sample consists of 699 upwardly reconstructed () events, illustrated in Fig. 1. A comparison to the normalized atmospheric neutrino simulation reveals that for declinations the sample is strongly dominated by atmospheric neutrinos.
A binned search for excesses in the region has been performed. The search grid contains 301 rectangular bins with zenith-dependent widths ranging from to , based on the aforementioned bin-size optimization. The grid is shifted 4 times in declination and right ascension to fully cover boundaries between the bins of the original configuration. The number of times to shift the grid was studied, taking into account statistical penalties for the number of shifts by using simulated event samples, and set at a level where further shifts do not markedly improve the average maximum significance obtained on simulated Poisson-fluctuated signals of similar magnitude to the background.
The most significant excess, observed at about , is 8 events observed on an expected background of 2.1. Simulation reveals a probability of 51% to observe such an excess as a random upward fluctuation of the background.
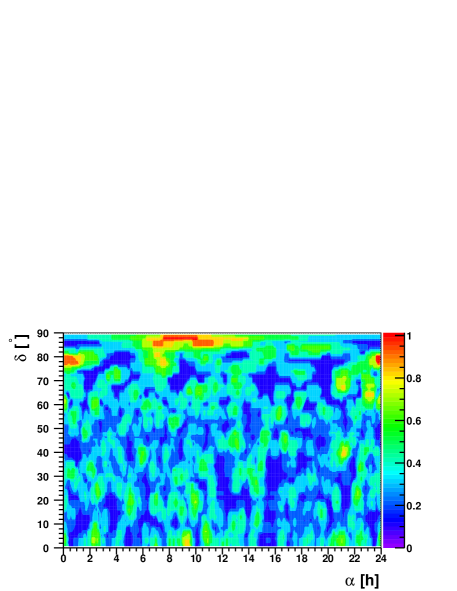
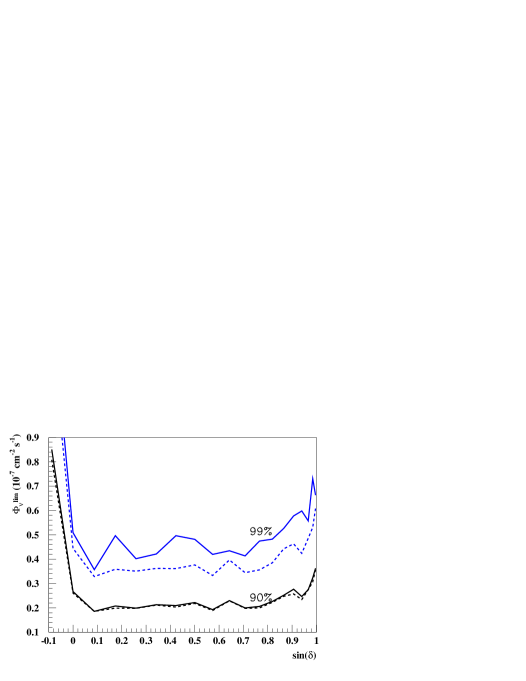
In addition to the binned search, we place limits on a number of extragalactic and galactic candidate sources. Circular bins with optimized radii are positioned at each candidate position; the number of expected background events is given by the number of observed events in the declination band scaled down to the search bin area. The same method applied to any point in the Northern hemisphere yields neutrino flux upper limits shown in Fig. 2. For the region an adjacent region at lower declination was used for the background estimation. The average flux upper limits for spectra obtained in an ensemble of identical experiments in the case of no true signal is shown vs. declination in Fig. 3. It should be pointed out that due to the large number of cells tested a single source with a flux at the sensitivity level (90% average flux upper limit) would normally be interpreted as a statistical fluctuation. Therefore a flux a few times higher would be needed to make a discovery of a point source possible in the binned search.
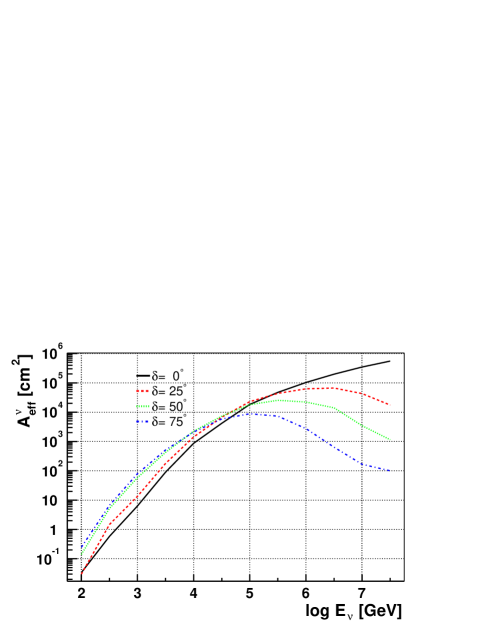
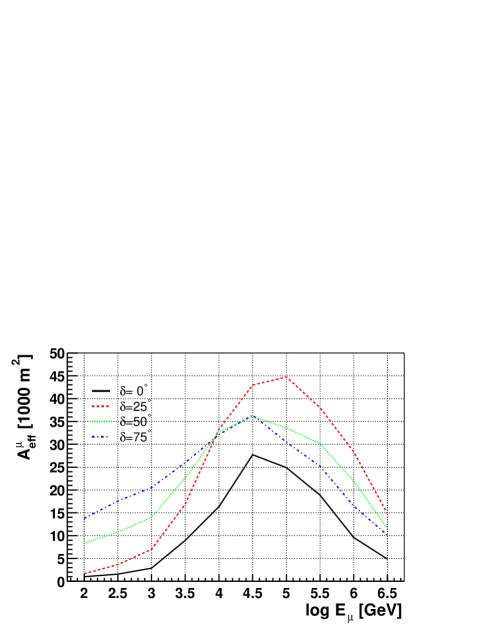
In Tab. 1, we present neutrino flux limits for northern hemisphere blazars, selected blazars, microquasars, magnetars, and selected miscellaneous candidates. The limits are computed based on an assumed energy spectrum. Limits for other spectra can be computed using the neutrino effective area shown in Fig. 4: The neutrino flux limit for an assumed flux is inversely proportional to the energy averaged effective area , i.e. a limit for spectral index is obtained by multiplying the presented limit by . Effective areas at declinations not shown in Fig. 4 can be obtained by linear interpolation in ; the systematic shift induced by this interpolation is below 20% for spectral indices in the range ….
| Candidate | Dec. [∘] | R.A. [h] | ||||
| TeV Blazars | ||||||
| Markarian 421 | 38.2 | 11.07 | 3 | 1.50 | 3.0 | 3.5 |
| Markarian 501 | 39.8 | 16.90 | 1 | 1.57 | 1.5 | 1.8 |
| 1ES 1426+428 | 42.7 | 14.48 | 1 | 1.62 | 1.4 | 1.7 |
| 1ES 2344+514 | 51.7 | 23.78 | 1 | 1.23 | 1.6 | 2.0 |
| 1ES 1959+650 | 65.1 | 20.00 | 0 | 0.93 | 0.9 | 1.3 |
| GeV Blazars | ||||||
| QSO 0528+134 | 13.4 | 5.52 | 1 | 1.09 | 2.5 | 2.0 |
| QSO 0235+164 | 16.6 | 2.62 | 1 | 1.49 | 2.0 | 1.7 |
| QSO 1611+343 | 34.4 | 16.24 | 0 | 1.29 | 0.7 | 0.8 |
| QSO 1633+382 | 38.2 | 16.59 | 1 | 1.50 | 1.5 | 1.7 |
| QSO 0219+428 | 42.9 | 2.38 | 1 | 1.63 | 1.4 | 1.6 |
| QSO 0954+556 | 55.0 | 9.87 | 1 | 1.66 | 1.3 | 1.7 |
| QSO 0716+714 | 71.3 | 7.36 | 2 | 0.74 | 2.9 | 4.4 |
| Microquasars | ||||||
| SS433 | 5.0 | 19.20 | 0 | 2.38 | 1.0 | 0.7 |
| GRS 1915+105 | 10.9 | 19.25 | 1 | 0.91 | 2.9 | 2.2 |
| GRO J0422+32 | 32.9 | 4.36 | 2 | 1.31 | 2.9 | 2.9 |
| Cygnus X1 | 35.2 | 19.97 | 2 | 1.34 | 2.2 | 2.5 |
| Cygnus X3 | 41.0 | 20.54 | 3 | 1.69 | 3.0 | 3.5 |
| XTE J1118+480 | 48.0 | 11.30 | 1 | 0.92 | 1.7 | 2.2 |
| CI Cam | 56.0 | 4.33 | 0 | 1.72 | 0.6 | 0.8 |
| LS I +61 303 | 61.2 | 2.68 | 0 | 0.75 | 1.0 | 1.5 |
| SNR, magnetars & miscellaneous | ||||||
| SGR 1900+14 | 9.3 | 19.12 | 0 | 0.97 | 1.4 | 1.0 |
| Crab Nebula | 22.0 | 5.58 | 2 | 1.76 | 2.6 | 2.4 |
| Cassiopeia A | 58.8 | 23.39 | 0 | 1.01 | 0.9 | 1.2 |
| 3EG J0450+1105 | 11.4 | 4.82 | 2 | 0.89 | 4.2 | 3.2 |
| M 87 | 12.4 | 12.51 | 0 | 0.95 | 1.3 | 1.0 |
| Geminga | 17.9 | 6.57 | 3 | 1.78 | 3.7 | 3.3 |
| UHE CR Triplet | 20.4 | 1.28 | 2 | 1.84 | 2.4 | 2.3 |
| NGC 1275 | 41.5 | 3.33 | 1 | 1.72 | 1.4 | 1.6 |
| Cyg. OB2 region. ob2 | 41.5 | 20.54 | 3 | 1.72 | 2.9 | 3.5 |
| UHE CR Triplet | 56.9 | 12.32 | 1 | 1.48 | 1.4 | 1.9 |
In guetta , expected numbers of neutrino induced muon events for galactic microquasars using source parameters estimated from radio observations are calculated. For microquasars whose jets have not been resolved in the radio band the neutrino emission is estimated from the synchrotron luminosity. In the case of the microquasar SS433, 252 muons are predicted. Scaling to the AMANDA-II effective area at that declination () and to the livetime of this analysis, yields a prediction of 1.07 events for an assumed spectrum. We observe no events in the search bin for this source, and place a 90% upper limit of 1.24 events. Due to a random fluctuation, this limit is about 3 times better than the sensitivity at this declination.
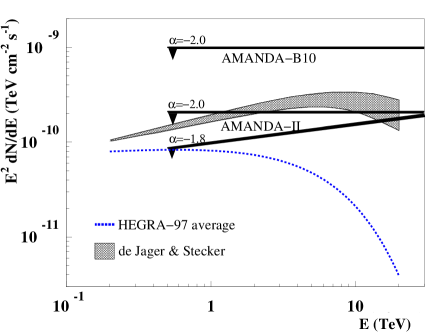
In Fig. 5 the AMANDA-II neutrino sensitivity is compared to the 1997-averaged TeV -ray flux of the blazar Markarian 501 (), and the intrinsic source spectrum (corrected for IR absorption). The figure demonstrates AMANDA-II has achieved the sensitivity needed to search for neutrino fluxes from TeV -ray sources of similar strength to the intrinsic -ray flux.
Data collected in 2001-2002 are being analyzed and should improve the sensitivity of this analysis approximately by a factor 2.3.
VI Acknowledgments
We acknowledge the support of the following agencies: National Science Foundation–Office of Polar Programs, National Science Foundation–Physics Division, University of Wisconsin Alumni Research Foundation, Department of Energy, and National Energy Research Scientific Computing Center (supported by the Office of Energy Research of the Department of Energy), UC-Irvine AENEAS Supercomputer Facility, USA; Swedish Research Council, Swedish Polar Research Secretariat, and Knut and Alice Wallenberg Foundation, Sweden; German Ministry for Education and Research, Deutsche Forschungsgemeinschaft (DFG), Germany; Fund for Scientific Research (FNRS-FWO), Flanders Institute to encourage scientific and technological research in industry (IWT), and Belgian Federal Office for Scientific, Technical and Cultural affairs (OSTC), Belgium; Fundación Venezolana de Promoción al Investigador (FVPI), Venezuela; D.F.C. acknowledges the support of the NSF CAREER program.
References
- (1) J.F. Beacom, et. al., submitted to Phys. Rev. D, hep-ph/0307025.
- (2) E. Andrés, et al., Nature, 410 (2001) 441.
- (3) J. Ahrens, et al., Astrophys.J. 583 (2003) 1040, astro-ph/0208006.
- (4) J. Ahrens et al., Phys. Rev. D66, (2002) 012005, astro-ph/0205109.
- (5) G. C. Hill and K. Rawlins, Astropart. Phys. 19 (2003) 393, astro-ph/0209350.
- (6) F. Halzen and D. Hooper, Rep. Prog. Phys. 65 (2002) 1025, astro-ph/0204527.
- (7) G. C. Hill, in Proceedings of the 27th ICRC, ed. Heinzelmann G. et al., (2001) 1279, HE 2.67.
- (8) G. J. Feldman and R.D. Cousins, Phys. Rev. D57 (1998) 3873, physics/9711021.
- (9) R. D. Cousins and V. L. Highland, Nucl. Instr. Meth. A320 (1992) 331.
- (10) J. Conrad et. al., Phys. Rev. D67 (2003) 012002, hep-ex/0202013.
- (11) G. C. Hill, Phys. Rev. D 67 (2003) 118101, physics/0302057.
- (12) J. Ahrens et. al., paper submitted to Nucl. Instr. and Meth. A (2003)
- (13) C. Distefano, D. Guetta, A. Levinson and E. Waxmann, Astrophys. J. 575 (2002) 378, astro-ph/0202200.
- (14) F. Aharonian, Astron. & Astrophys. 393 (2002) 89, astro-ph/0205499.
- (15) An unidentified TeV -ray source; see F. A. Aharonian et. al., Astron. Astrophys. 393 (2002) L37, astro-ph/0207528.
- (16) O.C. de Jager and F. W. Stecker, Astrophys. J. 566 (2002) 738, astro-ph/0107103.