Gemini-Phoenix infrared high-resolution abundance analysis of five giants in the bulge globular cluster NGC 6553 ††thanks: Observations collected at the Gemini Observatory, Chile, and the European Southern Observatory, Paranal, Chile
A detailed abundance analysis of 5 giants of the metal-rich
bulge globular cluster NGC 6553 was carried out using
high resolution infrared spectra in the H band,
obtained at the Gemini-South 8m telescope.
JK photometry collected at ESO
and VI photometry from the Hubble Space Telescope
are used to derive effective temperatures.
The present analysis provides a metallicity
[Fe/H] = -0.200.10. An overabundance of oxygen of [O/Fe] = +0.20
is found from IR OH lines.
Key Words.:
stars: abundances, atmospheres - Galaxy: globular clusters: individual: NGC 65531 Introduction.
NGC 6553 is a metal-rich globular cluster, projected in the direction of the Galactic bulge, located at = 18h09m16s, = -25∘54’28”, and (l,b) = (5.25∘,-3.02∘) at a distance of d⊙ 5.1 kpc (Guarnieri et al. 1998). Ortolani et al. (1990, 1995) have shown the turnover of the Red Giant Branch (RGB), due to the presence of TiO bands, in Colour-Magnitude Diagram (CMD) of NGC 6553. This RGB morphology indicates that NGC 6553 is more metal-rich than the halo cluster 47 Tucanae, and almost identical to the bulge cluster NGC 6528 (Ortolani et al. 1995; Momany et al. 2003). NGC 6553, together with NGC 6528, are also shown to have a metallicity and an age comparable to the bulk of the Baade‘s Window stellar population (Ortolani et al. 1995; Zoccali et al. 2003a). Due to their high metallicities, NGC 6528, NGC 6553 and NGC 6440 were adopted by Bica (1988) as templates to reproduce the spectra of the more metal-rich elliptical galaxies.
NGC 6553, as a reference metal-rich cluster, is suitable for studies of individual stars, because it is relatively loose and uncrowded, and shows a reddening considerably lower than the majority of metal-rich globular clusters.
A proper motion study of NGC 6553 (Zoccali et al. 2001, 2003b) showed that its orbital rotational velocity around the Galactic center is consistent with the mean rotation of the bulge at 2.7 kpc (Minniti 1995) and as well with the disk rotation at the same distance (Amaral et al. 1996). Given that from the kinematical point of view, NGC 6553 appears to be consistent with either a disk or a bulge membership, it is important to solve this issue by deriving elemental abundance ratios, as signatures from star formation timescale and age.
The analyses of individual stars of NGC 6553 have given however some conflicting results:
Barbuy et al. (1992) estimated [Fe/H] -0.2, from fits of synthetic spectra to the observed spectrum of a cool giant at a resolution of R 20 000; no abundance ratios were derived given the limitations of S/N. From higher signal-to-noise data, with the same resolution, Barbuy et al. (1999) derived [Fe/H] = -0.55, together with significant -element enhancements for two giants of effective temperatures around 4000 K. Cohen et al. (1999) analysed 5 Horizontal Branch (HB) stars and found a mean value of [Fe/H] = -0.16, with the mean overabundances of -elements [Mg/Fe] = +0.4, [Si/Fe] = +0.14, [Ca/Fe] = +0.26, [Ti/Fe] = +0.19, whereas the oxygen value of [O/Fe] = +0.5 may be overestimated given the use of the OI 777nm triplet, which tends to give higher values than other oxygen lines (e.g. Meléndez et al. 2001; Lambert 2002).
Carretta et al. (2001) analysed 4 HB stars of NGC 6528, having obtained [Fe/H] = +0.07, and they proposed a rescaling of the metallicity of NGC 6553 to [Fe/H] = -0.06, 0.1dex higher than given in Cohen et al. (1999).
Origlia et al. (2002) analysed two cool giants of effective temperature Teff = 4000 K from infrared spectra in the H band, at a resolution R 25 000, and found a mean metallicity of [Fe/H] = -0.3 and [/Fe] = +0.3.
In the present work we analyse 5 giants of NGC 6553, using high resolution H-band spectra obtained with the Phoenix spectrograph at the Gemini-South 8m telescope. At a resolution R 50 000, these are the highest resolution observations so far obtained for stars in this cluster.
In Sect. 2 the observations are described. In Sect. 3 the stellar parameters effective temperature, gravity, metallicity and abundance ratios are derived. In Sect. 4 the results are discussed. In Sect. 5 conclusions are drawn.
| Star | V | IC | J | K | Date | Exp. time | S/N | S/N | v |
| (s) | resol. | pixel | km s-1 | ||||||
| Gemini-South | |||||||||
| 40201 (III-17) | 15.36 | 12.35 | 10.31 | 8.97 | 2002 May 06 | 6 420 | 330 | 200 | -8.7 |
| 20150 | 15.40 | 12.67 | 10.81 | 9.45 | 2002 May 08 | 3 600 | 240 | 120 | 7.7 |
| 40056 (II-85) | 15.52 | 13.01 | 11.04 | 9.79 | 2002 May 09 | 9 600 | 240 | 150 | 1.6 |
| 20074 (IV-13) | 15.59 | 13.11 | 11.28 | 10.03 | 2002 May 08 | 9 600 | 260 | 130 | 9.3 |
| 40082 (III-3) | 15.82 | 13.41 | 11.54 | 10.33 | 2002 May 09 | 3 600 | 160 | 80 | -1.0 |
| VLT | |||||||||
| 40056 (II-85) | 15.52 | 13.01 | 11.04 | 9.79 | 2000 Jun 26-27 | 2 3600 | 170 | 70 | 0.5 |
2 Observations
The log-book of observations is reported in Table 1. The spectra of individual stars of NGC 6553 in the H band, at a resolution of R = 50 000, were obtained using the 8 m Gemini South telescope and the Phoenix spectrograph (Hinkle et al. 2000). The instrument uses a 1024 1024 InSb Aladdin array, which is sensitive in the 1-5 m region. The observations were centred at 1.555 m, with a wavelength coverage of 75 Å. The spectra were observed using the 4-pixel slit ().
Each sample star was observed at three different positions separated by 3” along the slit. Most exposures were taken with an integration time of 10 min at each position. The sky and dark background were removed by subtracting exposures taken at different positions on the detector array. Each night 10 flat and 10 dark frames were gathered. A hot star was observed to check for the presence of telluric lines, and the region was found to be almost free of them.
The frames were reduced with IRAF, following a procedure similar to that described in Meléndez et al. (2001). Dark and flat frames are combined and the resulting dark is subtracted from the flat. A bad pixel mask is obtained using the subtracted flat, and the bad pixels of the image frames were replaced by interpolation of surrounding pixels. A response image was obtained from the corrected flat and the sky corrected object frames were divided by the response frame. The spectra were extracted and wavelength calibrated using the absorption stellar lines, and finally the spectra taken at different positions were combined and the continuum was normalized.
The star II-85 was also observed in the optical, in the wavelength range 4800-6800 Å with the UVES spectrograph at the VLT UT2 telescope at ESO (Paranal). With the standard configuration, a resolution of R 60 000 was achieved for a slit width of . In Table 1 the S/N values per pixel and per resolution element are given. The resolution element at the UVES spectrograph cover 7-pixels, with 0.017 per pixel. The spectra were reduced using the UVES context of the MIDAS reduction package, including bias and inter-order background subtraction, flatfield correction, optimal extraction (with cosmic ray rejection) above the sky level and wavelength calibration (Balester et al. 2000).
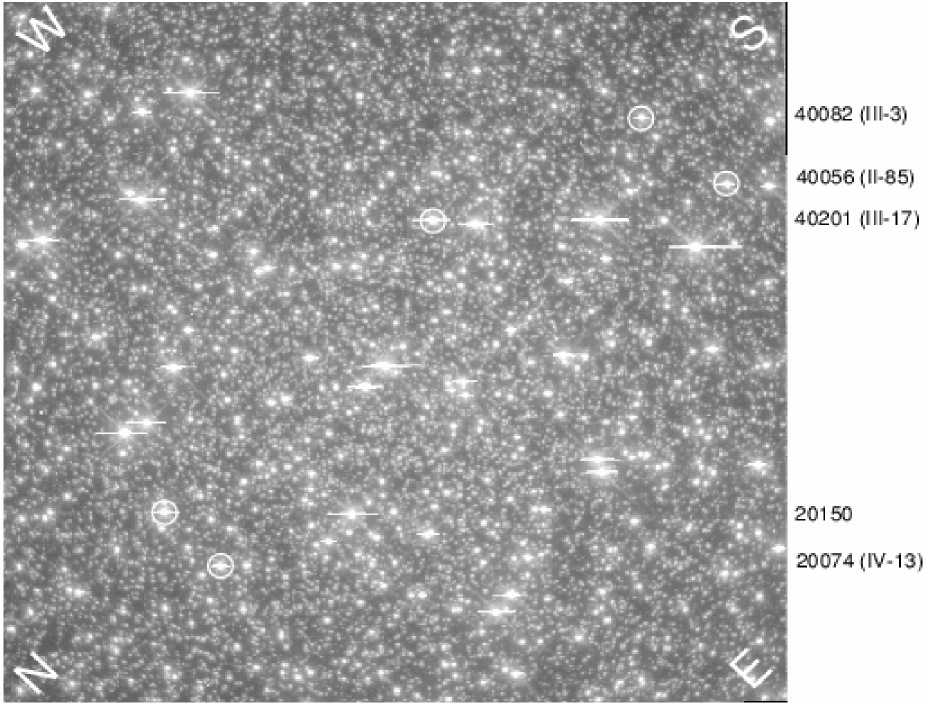
The targets are identified in Fig. 1, which is a deep Hubble Space Telescope (HST) F814W image.
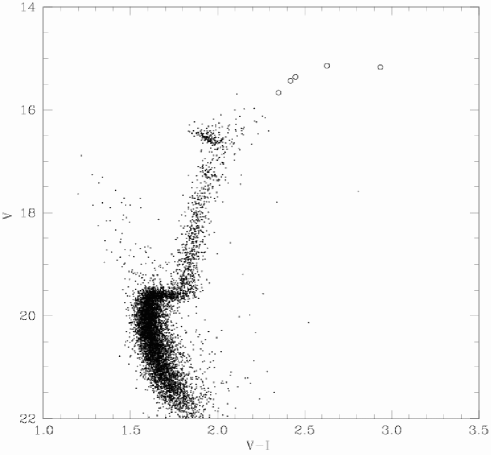
In Fig. 2 is shown the V vs. Colour-Magnitude Diagram of NGC 6553 using HST (Ortolani et al. 1995) observations, where the sample stars are represented by filled circles. The CMD is corrected from differential reddening following method by Piotto et al. (1999) and Zoccali et al. (2001). The identifications given in Hartwick (hartwick (1975)) are adopted along the text.
The radial velocities, indicated in Table 1, were derived with respect to the sky lines reported in Table 2. A mean value of v = 1.66 km s-1 is obtained. Fig. 3 shows a histogram of radial velocities for the present values combined to stars from Origlia et al. (2002), Barbuy et al. (1999) and Cohen et al. (1999).
A peak value of v = 2 km s-1 is found (Fig. 3), in good agreement with the value of 8.48.4 kms-1 measured by Rutledge et al. (1997). It is also consistent with the mean value derived, from low resolution spectra using three methods, by Coelho et al. (2001), of v -1 km s-1; membership of most sample stars of NGC 6553 were examined in Coelho et al. (2001) prior to observations with the large telescopes.
| (Å) | Transition | Wavenumber (cm | Int. |
|---|---|---|---|
| 15535.462 | (3, 1) P1e 5.5 | 6435.128 | 1.0 |
| 15536.705 | (3, 1) P1f 5.5 | 6434.613 | 1.0 |
| 15541.645 | (4, 2) R1f 3.5 | 6432.568 | 0.7 |
| 15542.146 | (4, 2) R1e 3.5 | 6432.360 | 0.7 |
| 15565.907* | (4, 2) R2e,f 3.5 | 6422.542 | 0.8 |
-
∗
Blend: 15565.817 & 15565.996 Å


3 Stellar Parameters
3.1 Reddening
Zinn (1980) used integrated photometry in the Gunn uvgr and two passbands on the H and K CaII lines, and found E(B-V) = 0.78. Reed et al. (1988) used integrated UBVRI colours and estimated E(B-V) = 0.82.
Schlegel et al. (1998) presented a 100m map of the Galaxy allowing to extract the reddening at different galactic coordinates, corresponding to the total value in each line of sight across the Galaxy, in the direction of extragalactic sources. For b 5∘ the values are less precise. For NGC 6553, E(B-V) = 1.42 is derived; Schlegel’s extinctions are overestimated in the bulge direction, and a quantification of this is given by Dutra et al. (2003) who showed that at these inner Galaxy directions Schegel’s values should be multiplied by 0.75, giving thus E(B-V) = 1.06.
Cohen et al. (1999) analysed 5 HB stars, and estimated their temperatures from excitation equilibrium of Fe I lines. In order to be compatible with the colours, they deduced E(B-V) = 0.78 for 3 stars and 0.86 for the two other ones.
Methods using CMDs compare the locus of the Red Giant Branch (RGB) of the cluster with that of a cluster of similar metallicity, or an isochrone. Sagar et al. (1999) compared the CMD of NGC 6553 to isochrones and obtained E(B-V) = 0.7. A comparison with 47 Tuc ([Fe/H] = -0.71, Harris 1996) was carried out by Ortolani et al. (1990), Guarnieri et al. (1998) and Zoccali et al. (2001); the latter two papers used the same data set and values E(V-I) = 0.95 and 0.80, or E(B-V) = 0.7 and 0.6, respectively, were found. The difference between these two values are due to two reasons: (a) the colour of the RGB at the HB level was given with a (V-I) = 0.05 difference between Zoccali et al. (2001) and Guarnieri et al. (1998); (b) a mistake in the derivation of Zoccali et al. (2001) has been to consider that the reddening of 47 Tuc had to be subtracted, whereas it has to be added, giving thus a difference of (V-I) = 0.1, since E(V-I)47Tuc = 0.05.
The blanketing assumed for the difference between the metallicities of 47 Tuc and NGC 6553 is = 0.14 (Girardi et al. 2002; Kim et al. 2002). The V-I colours of the RGB at the HB level are (V-I)47Tuc = 1.0 (Barbuy et al. 1998) and (V-I)NGC6553 = 2.08 (this refers to the average value, as can be checked in Fig. 7 of Zoccali et al. 2001). Therefore we have: E(V-I)NGC6553-47Tuc = 2.08 - 1.0 - 0.14 + 0.05 = 0.99 Assuming E(V-I)/E(B-V) = 1.33 (Dean et al. 1978), or 1.36 (Schlegel et al. 1998), this transforms to E(B-V) = 0.74 or 0.73 respectively.
A check of differential reddening for our sample stars, following the method described in Zoccali et al. (2001), indicates that they have a lower reddening, relative to the mean, of (B-V) = -0.04 for 3 stars, -0.055 for III-17 and -0.075 for 20150. Therefore in the present work, we assumed E(B-V) = 0.74 - 0.04 = 0.70 for all sample stars.
3.2 Effective Temperatures
The determination of effective temperatures Teff was carried out using V, I, J and K colours, reported in Table 1. V and I colours were obtained using HST and J and K colours using the detector IRAC2 at the ESO 2.2m telescope (Ortolani et al. 1995; Guarnieri et al. 1998).
Assuming a ratio E(V-I)/E(B-V)=1.33 (Dean et al. 1978), E(V-K)/E(B-V) = 2.744 and E(J-K)/E(B-V) = 0.527 (Rieke & Lebofsky 1985), the available colours were dereddened, and they are given in Table 3.
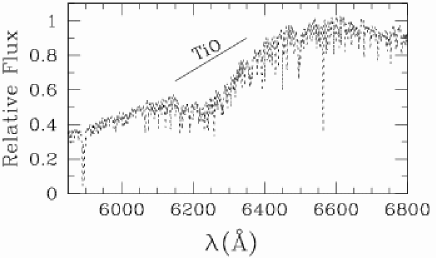
In the present wavelength region the Fe I lines have high excitation potentials around 5.5 - 6.5 eV, therefore the line strengths are not sensitive to errors in temperature, as can be seen in Fig. 4. To constrain the effective temperature in a reddening-free manner (excitation equilibrium), we also measured Fe I lines in a range of excitation potential values, from optical spectra of the star II-85. This star has an effective temperature of Teff 4000 K and shows TiO bandheads, as shown in Fig. 5. We measured Fe I lines only in the wavelength regions 5850 - 6150 Å and 6360 - 6810 Å. In Fig. 6 are plotted the derived Fe abundances vs. excitation potential and reduced equivalent width. It is clear that the Teff = 4000 K is in good agreement with the excitation equilibrium requirement. This indicates that the effective temperatures derived from colours are reliable, at least for II-85. Full analysis of optical spectra obtained with the UVES spectrograph at the Very Large Telescope is in progress (Hill et al., in preparation).
In Table 3 are reported effective temperatures derived using the , and calibrations of Alonso, Arribas & Martínez-Roger (1999, hereafter AAM99) and those by Houdashelt et al. (2000a,b). There is good agreement between these temperatures and derivations based on relations by Bessell et al. (1998) and McWilliam (1990).
| Id. | No. | E(B-V) | 0 | Teff(V-I) | Teff(V-K) | Teff(J-K) | Mean | Mean | Final | |||||||
|---|---|---|---|---|---|---|---|---|---|---|---|---|---|---|---|---|
| Houd | Alon | Houd | Alon | Houd | Alon | Houd | Alonso | |||||||||
| III17 | 40201 | 0.70 | 2.06 | 4.51 | 0.87 | 3694 | 3596 | 3684 | 3634 | 3994 | 3986 | 3790 | 3739 | 3765 | ||
| 20150 | 0.70 | 1.79 | 4.07 | 0.88 | 3812 | 3708 | 3790 | 3747 | 3976 | 3949 | 3859 | 3801 | 3830 | |||
| II85 | 40056 | 0.70 | 1.57 | 3.85 | 0.78 | 3952 | 3866 | 3845 | 3819 | 4170 | 4170 | 3989 | 3952 | 3970 | ||
| IV13 | 20074 | 0.70 | 1.54 | 3.68 | 0.78 | 3976 | 3885 | 3914 | 3894 | 4207 | 4138 | 4032 | 3972 | 4002 | ||
| III3 | 40082 | 0.70 | 1.47 | 3.61 | 0.75 | 4040 | 3951 | 3932 | 3922 | 4268 | 4225 | 4080 | 4033 | 4056 | ||

3.3 Gravities
The classical relation was used (adopting T⊙ = 5770 K, M∗ = 0.85 M⊙ (Bertelli et al. 1994) and Mbol⊙ = 4.75 (Cram 1999; see also Bessell et al. 1998). For deriving Mbol∗ we adopted the distance modulus (m-M)∘ = 13.6 and AK = 0.38E(B-V) (Guarnieri et al. 1998). The bolometric magnitude corrections BCK are from Houdashelt et al. (2000a,b). The derivation of Mbol = MK + BCK is better than that using MV + BCV because it is much less dependent on reddening and metallicity. The resulting Mbol values are given in Table 7.
3.4 Equivalent Widths, Oscillator Strengths and Damping Constants
Equivalent widths of Fe I lines were measured from the infrared spectra, and from the optical spectrum of the star II-85 (see Sect. 3.2). The list of Fe I lines in the H band is given in Table 4.
| log | W (mÅ) | |||||||||||||
|---|---|---|---|---|---|---|---|---|---|---|---|---|---|---|
| (Å) | (eV) | adopted | TWG1 | TWP1 | MB992 | S021 | VMB952 | MS922 | 40201 | 20150 | 40056 | 20074 | 40082 | |
| 15531.753a | 5.64 | -0.48 | -0.47 | -0.49 | a | -0.56 | -0.45e | — | 177 | 180 | 157 | 160 | 179 | |
| 15534.260 | 5.60 | -0.45 | -0.47 | -0.50 | -0.47 | -0.40 | -0.28e | -0.34i | 194 | 180 | 180 | 190 | 156 | |
| 15537.690b | 6.32 | -0.23 | -0.26 | -0.21 | b | -0.80d | -0.21g | — | 116 | 109 | 106 | 106 | 107 | |
| 15550.450c | 6.34 | -0.25 | -0.27 | -0.22 | -0.35c | — | -0.23g | — | 84 | 110 | 94 | 83 | 96 | |
| 15551.430 | 6.35 | -0.20 | -0.21 | -0.16 | -0.31 | — | -0.16h | — | 80 | 100 | 99 | 76 | 105 | |
| 15566.725 | 6.35 | -0.45 | -0.50 | -0.45 | -0.50 | — | -0.36h | -0.43 | 57 | 71 | 77 | 66 | 71 | |
-
1
based on Arcturus spectrum
-
2
based on Solar spectrum
-
a
blend (5.64 eV & 6.24 eV)
-
b
blend (6.32 eV & 5.79 eV)
-
c
blend (6.32 eV & 6.36 eV)
-
d-i
The excitation potential adopted was: = 5.79, 5.71, 6.39, 6.42 & 5.64 eV, respectively.
-
References: TWG: This work (Gustafsson model); TWP: This work (Plez model); MB99; S02: Smith et al. (2002); VMB: Valenti, Marcy & Basri (1995); MS92: Muglach & Solanki (1992)
Fig. 6b shows the derived Fe abundances as a function of reduced equivalent widths. The equivalent widths in the optical were measured using DAOSPEC, a new automatic code developed by P.Stetson (Stetson et al. 2003, in preparation). In Barbuy et al. (1999), with a lower S/N and resolution (R = 20 000), only stronger lines were measured, and a low metallicity derived in Barbuy et al. (1999) of [Fe/H] = -0.55 was probably underestimated. In the present optical and IR spectra, of higher resolution, the deblending with CN lines is also much improved: the Arcturus spectrum (Hinkle et al. 1995) was inspected in order to avoid blends with CN lines.
| Parameter | This Work | Literature∗ |
|---|---|---|
| (K) | 4275 | 4300 10 |
| log | 1.55 | 1.55 0.10 |
| mass (M⊙) | 0.9 | 0.81∗∗ 0.20 |
| 1.65 | 1.67 0.05 | |
| [Fe/H] | -0.54 | -0.54 0.06 |
| [C/Fe] | -0.08 | -0.04 0.04 |
| [N/Fe] | +0.30 | +0.27 0.08 |
| [O/Fe] | +0.43 | +0.39 0.06 |
| [Ni/Fe] | +0.02 | +0.05 0.05 |
-
∗
References: Brown & Wallerstein (1992); Peterson et al. (1993); McWilliam & Rich (1994); Sneden et al. (1994); Balachandran & Carney (1996); Hill (1997); Gonzalez & Wallerstein (1998); Thevenin & Idiart (1999); Tomkin & Lambert (1999); Griffin & Lynas-Gray (1999); Smith et al. (2000); Carr et al. (2000); Decin et al. (2000); Mishenina & Kovtyukh (2001); Smith et al. (2002); Reddy et al. (2002).
-
∗∗
obtained from log (= 1.55 0.10) and R (= 25R⊙)
3.5 Spectrum synthesis
We have adopted the photospheric models for giants of Plez et al. (1992).
The atomic parameters derived in Meléndez & Barbuy (1999, hereafter MB99) were revised based on the spectrum of Arcturus, using the Plez et al. (1992) model atmosphere, in order to be consistent with the models used for the sample stars.
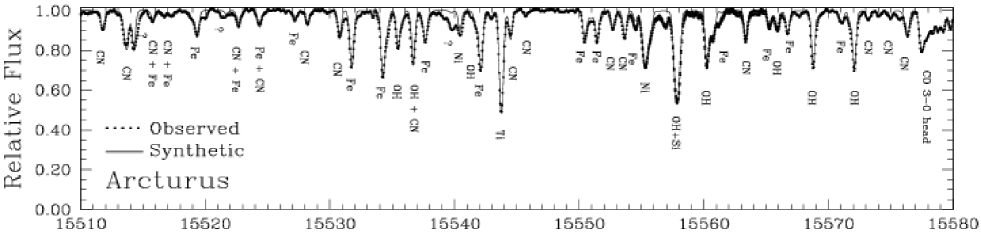
In Table 4 are reported the stellar parameters found in the literature for Arcturus and the presently adopted parameters obtained in the same way as for stars of NGC 6553. A fit to the spectrum of Arcturus (Hinkle et al. 1995) in the H band is shown in Fig. 7. The metallicity [Fe/H] = -0.54 adopted here is rather different from the value adopted in Smith et al. (2002) of [Fe/H] = -0.72, but the [O/Fe] = +0.43 (present work) and +0.34 (Smith et al. 2002) values are in close agreement.
The revised oscillator strengths of Fe I lines are given in Table 4. The damping constants were computed based on the collisional broadening theory of Barklem et al. (1998a), using tables by Anstee & O’Mara (1995), Barklem & O’Mara (1997) and Barklem et al. (1998b). Molecular lines of CN A2-X2, OH X2 and CO X1 are taken into account. See more details and the full list of lines in MB99, Meléndez et al. (2001) and Meléndez & Barbuy (2002). A difference relative to these papers is the adoption of a dissociation potential of CN D∘(CN) = 7.72 eV (Pradhan et al. 1994), and electronic transition moment for CN from Bauschlicher et al. (1988).
For the optical spectrum of II-85 the Fe I gf-values were adopted from the National Institute of Standards & Technology (NIST) database (Martin et al. 2002).
3.6 Microturbulence velocity
For deriving the microturbulence velocity vt, lines of different equivalent widths are needed. In the H band most lines, of high excitation potential, are weak. In order to better derive vt, we used optical lines of the star II-85 (Sect. 3.2) for which we obtain vt = 1.4 km s-1. We adopt this same value for the other stars of same temperature and vt = 1.5 km s-1 for the two cooler ones. The microturbulence velocity might be somewhat lower, given that from VLT-UVES data for 3 giants of NGC 6528, with effective temperatures in the range 4200 - 4800 K, Zoccali et al. (2003c) determined microturbulence velocities of vt = 1.1 - 1.5 km s-1.
The adopted stellar parameters are given in Table 7.
3.7 Errors
Errors due to change in stellar parameters are shown in Table 6, for an increase of 100 K in the effective temperature, +0.3 dex in log , and +0.3 km s-1 in vt.
4 Results
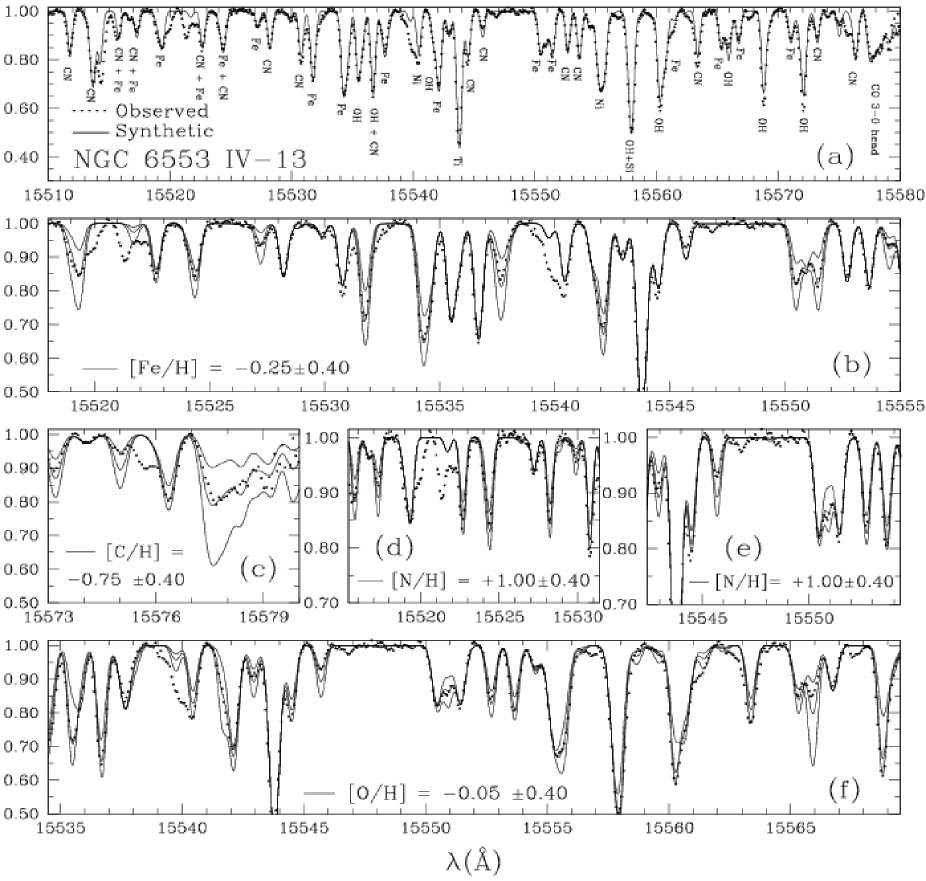
We obtained a mean metallicity [Fe/H] = -0.200.10. In Table 7 are reported the abundance ratios obtained for C, N and O. Fig. 8 shows the fit of synthetic spectra to the observed spectrum of star IV-13.
The C abundance determination is based on the CO 3-0 band at 1.5578 m. N is from a large number of CN lines as can be seen in Fig. 8. The analysed giants clearly show a C deficiency and N enhancement, which are signatures of convective mixing. Oxygen on the other hand is little affected by the mixing, and should reflect the original oxygen abundance. Note that log(C+N) = 9.1, whereas the solar value is log(C+N)⊙ = 8.65. Given that we do not expect that the first dredge-up modifies the C+N abundance, this would point out to an original enhancement of C+N in NGC 6553. A Nitrogen original enhancement seems likely. For such studies, in the future it will be interesting to observe stars in the main sequence of this cluster.
The O abundance is derived from OH lines of moderate strength, particularly those at 1.5536 and 1.5566 m. The mean oxygen-to-iron abundance is [O/Fe] = +0.200.10. The enhancement of oxygen points to an important contribution from supernovae type II in the original chemical enrichment of this cluster.
4.1 Comparison with previous work
Barbuy et al. (1999) derived [Fe/H] = -0.55, together with -element enhancements of [Mg/Fe] = +0.33, [Si/Fe] = +0.35, [Ca/Fe] = +0.32 and [Ti/Fe] = +0.50, for two giants of effective temperatures around 4000 K.
Cohen et al. (1999) analysed 5 HB stars and found a mean value of [Fe/H] = -0.16, with the mean overabundances of -elements [Mg/Fe] = +0.4, [Si/Fe] = +0.14, [Ca/Fe] = +0.26, [Ti/Fe] = +0.19, whereas for oxygen a value of [O/Fe] = +0.5 may be overestimated given the use of the OI 777nm triplet (e.g. Meléndez et al. 2001). There is an interesting similarity of the abundance ratios by Cohen et al.’s and the results for Baade’s Window field stars by McWilliam & Rich (1994, hereafter MR94) where [Mg/Fe] [Ti/Fe] +0.3 and [Ca/Fe] [Si/Fe] 0.0, to be noted in particular the lower overabundance of Si and Ca, relative to that of Mg. In MR94 Ti is also more overabundant than Si and Ca.
Carretta et al. (2001) analysed 4 HB stars of NGC 6528, and obtained [Fe/H] = +0.07. For NGC 6553, they proposed a rescaling of metallicity by summing up spectra of 3 HB stars of NGC 6553 and 2 stars of NGC 6528. By comparing the equivalent widths of the hypothetical average red HB stars, they rederive the stellar parameters and find a higher metallicity compared to that found by Cohen et al. (1999). They adopt a final mean metallicity of [Fe/H] = -0.06. Note that, as concerns the metallicity [Fe/H], the present results are in better agreement with Cohen et al (1999) than with the rescaling of Carretta et al. (2001).
A good agreement between the present results and those by Origlia et al. (2002) is found. Their two cool giants of effective temperature Teff = 4000 K, analysed from Keck-NIRSPEC infrared spectra in the H band, at a resolution of R 25 000, gave a metallicity of [Fe/H] = -0.3 and [O/Fe] = +0.3; for other -elements the authors indicate [/Fe] = +0.3, but no detailed elemental abundances are given.
The main causes of disagreement with previous work come from temperature and microturbulence velocity uncertainties, and from the resolution and S/N of the spectra.
| Element | log | vt | ||
|---|---|---|---|---|
| +100 K | +0.3 dex | +0.3 km s-1 | ||
| Fe [Fe I optical] | -0.05 | +0.07 | -0.13 | 0.16 |
| Fe [Fe I (6 eV)] | -0.01 | +0.04 | -0.05 | 0.06 |
| C [CO] | +0.05 | +0.10 | -0.03 | 0.12 |
| N [CN] | -0.20 | -0.09 | -0.03 | 0.22 |
| O [OH] | +0.22 | +0.20 | +0.02 | 0.30 |
| Ni [Ni I] | -0.02 | +0.06 | -0.06 | 0.09 |
| log | vt | Mbol | [Fe/H] | [C/Fe] | [N/Fe] | [O/Fe] | [Ni/Fe] | ||
|---|---|---|---|---|---|---|---|---|---|
| (K) | () | (mag) | |||||||
| 40201 (III-17) | 3800 | 0.8 | 1.5 | -2.2 | -0.25 | -0.60 | +1.20 | +0.30 | -0.10 |
| 20150 | 3800 | 1.0 | 1.5 | -1.8 | -0.16 | -0.75 | +1.45 | +0.15 | -0.15 |
| 40056 (II-85) | 4000 | 1.2 | 1.4 | -1.6 | -0.20 | -0.70 | +1.30 | +0.25 | -0.15 |
| 20074 (IV-13) | 4000 | 1.3 | 1.4 | -1.4 | -0.25 | -0.50 | +1.25 | +0.20 | -0.10 |
| 40082 (III-3) | 4000 | 1.4 | 1.4 | -1.1 | -0.17 | -0.55 | +1.30 | +0.15 | -0.10 |
| median | -0.20 | -0.60 | +1.30 | +0.20 | -0.10 |
-
NOTE : A⊙(Fe, C, N, O, Ni) = 7.50, 8.55, 7.97, 8.87, 6.25.
5 Discussion and conclusions
We have determined a metallicity of [Fe/H] = -0.200.10 for NGC 6553. We find an enhancement of C+N, corresponding to about 0.5dex relative to the solar value, which indicates an excess of C+N abundance in the gas from which NGC 6553 formed. The -element oxygen is enhanced by [O/Fe] +0.20. Cohen et al. (1999) found enhancements of other -elements, with [Mg/Fe] = +0.4, [Si/Fe] = +0.14, [Ca/Fe] = +0.26, and [Ti/Fe] = +0.19, and a mean of [/Fe] = 0.25. These results altogether point to a clear enhancement of elements in stars of NGC 6553.
Matteucci & Brocato (1990) and Matteucci et al. (1999) have computed models of bulge formation with a fast star formation rate, which is completed for the bulk of the bulge, in a timescale shorter than that of SNIa explosions. The predictions by Matteucci et al. (1999) indicate higher [/Fe] values than found here, but in any case the enhancements found here are basically consistent with that chemical evolution model, and with the old age of NGC 6553 determined by Ortolani et al. (1995).
Taking into account the overabundance of [O/Fe] = +0.200.10, together with results by Cohen et al. (1999), we find an overall enhancement of [-elements/Fe] = +0.2, and an overall metallicity [M/H] = [Z] = -0.06, or essentially solar.
These results indicate that NGC 6553 was enriched predominantly by Type II SNs, and that the bulge underwent fast star formation as modeled by Matteucci et al. (1999), and is consistent with the old age derived for this cluster by Ortolani et al. (1995).
Acknowledgements.
This work is based on observations obtained at the Gemini Observatory, which is operated by the Association of Universities for Research in Astronomy, Inc., under a cooperative agreement with the NSF on behalf of the Gemini partnership: the National Science Foundation (United States), the Particle Physics and Astronomy Research Council (United Kingdom), the National Research Council (Canada), CONICYT (Chile), the Australian Research Council (Australia), CNPq (Brazil), and CONICET (Argentina). We acknowledge partial financial support from CNPq and Fapesp (Brazil).References
- (1) Alonso, A., Arribas, S. & Martínez-Roger, C. 1999, A&AS, 140, 261 (AAM99)
- (2) Amaral, L. H., Ortiz, R., Lépine, J. R. D., Maciel, W. J. 1996, MNRAS, 281, 339
- (3) Anstee, S.D., O’Mara, B.J. 1995, MNRAS, 276, 859
- (4) Balachandran, S., Carney, B.W. 1996 AJ, 111, 946
- (5) Balester, P., Modigliani, A., Boitquin, O. et al. The Messenger, 101, 31
- (6) Barbuy, B., Bica, E., Ortolani, S. 1998, A&A, 333, 117
- (7) Barbuy, B., Castro, S., Ortolani, S., Bica, E.: 1992, A&A, 259, 607
- (8) Barbuy, B., Renzini, A., Ortolani, S., Bica, E., Guarnieri, M.D. 1999, A&A, 341, 539
- (9) Barklem, P.S., O’Mara, B.J. 1997, MNRAS, 290, 102
- (10) Barklem, P.S., Anstee, S.D., O’Mara, B.J. 1998a, PASA, 15, 336
- (11) Barklem, P.S., O’Mara, B.J., Ross, J.E. 1998b, MNRAS, 296, 1057
- (12) Bauschlicher, C.W. Jr., Langhoff, S.R., Taylor, P.R. 1988, ApJ, 332, 531
- (13) Bertelli, G., Bressan, A., Chiosi, C., Fagotto, F., Nasi, E., 1994, A&AS, 106, 275
- (14) Bessell, M.S., Castelli, F., Plez, B.: 1998, A&A, 333, 231
- (15) Bica, E. 1988, A&A, 195, 76
- (16) Brown, J.A., Wallerstein, G. 1992, AJ, 104, 1818
- (17) Carr, J.S., Sellgren, K., Balachandran, S. 2000, ApJ, 530, 307
- (18) Carretta, E., Cohen, J.G., Gratton, R.G., Behr, B.B. 2001, AJ, 122, 1469
- (19) Coelho, P., Barbuy, B., Perrin, M. N., Idiart, T., Schiavon, R. P., Ortolani, S., Bica, E. 2001, A&A, 376, 136
- (20) Cohen, J.G., Gratton, R.G., Behr, B.B., Carretta, E. 1999, ApJ, 523, 739
- (21) Cram, L. 1999, Trans. IAU XXIIIB, ed. J. Andersen, p. 141
- (22) Dean, J.F., Warpen, P.R., Cousins, A.J.: 1978, MNRAS, 183, 569
- (23) Decin, L., Waelkens, C., Eriksson, K. et al. 2000, ESA SP 456, 289
- (24) Dutra, C.M., Ahumada, A.V., Bica, E., Clariá, J.J., Barbuy, B. 2003, A&A, 408, 287
- (25) Girardi, L., Bertelli, G., Bressan, A., Chiosi, C., Groenewegen, M.A.T., Marigo, P., Salasnich, B., Weiss, A., 2002, A&A, 391, 195
- (26) Gonzalez, G., Wallerstein, G. 1998, AJ, 116, 765
- (27) Griffin, R.E.M., Lynas-Gray, A. 1999, AJ, 117, 2998
- (28) Guarnieri, M.D., Ortolani, S., Montegriffo, P., Renzini, A., Barbuy, B., Bica, E., Moneti, A.: 1998, A&A, 331, 70
- (29) Harris, W.E. 1996, AJ 112, 1487
- (30) Hartwick, F.D.A. 1975, PASP, 87, 77
- (31) Hill, V. 1997, A&A, 324, 435
- (32) Hinkle, K.H., Wallace, L., Livingston, W. 1995, Infrared Atlas of the Arcturus Spectrum, 0.9-5.3 microns, ASP, San Francisco.
- (33) Hinkle, K.H., Joyce, R.R., Sharp, N., Valenti, J.A. 2000, SPIE, 4008, 720
- (34) Houdashelt, M.L., Bell, R.A., Sweigart, A.V., Wing, R.F. 2000a, AJ, 119, 1424
- (35) Houdashelt, M.L., Bell, R.A., Sweigart, A.V., 2000b, AJ, 119, 1448
- (36) Kim, Y.-C., Demarque, P., Yi, S.K., Alexander, D.R., 2002, ApJS, 143, 499
- (37) Lambert, D.L. 2002, Highlights Astron. 12, 445
- (38) Martin, W.C., Fuhr, J.R., Kelleher, D.E., Musgrove, A., Podobedova, L., Reader, J., Saloman, E.B., Sansonetti, C.J., Wiese, W.L., Mohr, P.J., and Olsen, K. (2002). NIST Atomic Spectra Database (version 2.0), http://physics.nist.gov/asd. National Institute of Standards and Technology, Gaithersburg, MD.
- (39) Matteucci, F., Brocato, E. 1990, ApJ, 365, 539
- (40) Matteucci, F., Romano, D., Molaro, P. 1999, A&A, 341, 458
- (41) McWilliam, A. 1990, ApJS, 74, 1075
- (42) McWilliam, A., Rich, R.M. 1994, ApJS, 91, 749 (MR94)
- (43) Meléndez, J. & Barbuy, B. 1999, ApJS, 124, 527 (MB99)
- (44) Meléndez, J. & Barbuy, B. 2002, ApJ, 575, 474
- (45) Meléndez, J., Barbuy, B. & Spite, F. 2001, ApJ, 556, 858
- (46) Minniti, D. 1995, AJ, 109, 1663
- (47) Mishenina, T.V., Kovtyukh, V.V. 2001, A&A, 370, 951
- (48) Momany, Y., Ortolani, S., Held, E.V., Barbuy, B., Bica, E., Renzini, A., Bedin, L.R., Rich, R.M., Marconi, G. 2003, A&A, 402, 607
- (49) Muglach, K., Solanki, S.K., 1992, A&A, 263, 301
- (50) Origlia, L., Rich, R.M., Castro, S. 2002, AJ, 123, 1559
- (51) Ortolani, S., Barbuy, B., Bica, E. 1990, A&A, 236, 362
- (52) Ortolani, S., Renzini, A., Gilmozzi, R., Marconi, G., Barbuy, B., Bica, E., Rich, R.M.: 1995, Nature, 377, 701
- (53) Peterson, R.C., Dalle Ore, C., Kurucz, R. 1993, ApJ, 404, 333
- (54) Piotto, G., Zoccali, M., King, I. R., Djorgovski, S. G., Sosin, C., Rich, R. M., Meylan, G. 1999, AJ, 118, 1737
- (55) Plez, B., Brett, J.M., Nordlund, : 1992, A&A, 256, 551
- (56) Pradhan, A.D., Partridge, H., Bauschlicher, Jr. C.W. 1994, J. Chem. Phys. 101, 3857
- (57) Reddy, B.E., Lambert, D.L., Hrivnak, B.J., Bakker, E.J., 2002, AJ, 123, 1993
- (58) Reed, B. C., Hesser, J.E., Shawl, S.J. 1988, PASP, 100, 545
- (59) Rieke, G.H., Lebofsky, M.J.: 1985, ApJ, 288, 618
- (60) Rutledge, G.A., Hesser, J.E., Stetson, P.B., Mateo, M., Simard, L., Bolte, M., Friel, E.D., Copin, Y. 1997, PASP, 109, 883
- (61) Sagar, R., Subramanian, A., Richtler, T., Grebel, E.K. 1999, A&AS, 135, 391
- (62) Schlegel, D.J., Finkbeiner, D.P., Davis, M. 1998, ApJ, 500, 525
- (63) Smith V., Suntzeff, N.B., Cunha, K., Gallino, R., Busso, M., Lambert, D.L., Straniero, O. 2000, AJ, 119, 1239
- (64) Smith, V.H., Hinkle, K.H., Cunha, K., Plez, B., Lambert, D.L., Pilachowski, C.A., Barbuy, B., Meléndez, J., Balachandran, S., Bessell, M.S., Geisler, D.P., Hesser, J.E., Winge, C. 2002, AJ, 124, 3241
- (65) Sneden, C., Kraft, R.P., Langer, G.E., Prosser, C.F., Shetrone, M.D. 1994, AJ, 107, 1773
- (66) Thevenin, F., Idiart, T. 1999, ApJ, 521, 753
- (67) Tomkin, J., Lambert, D.L. 1999, ApJ, 523, 234
- (68) Valenti, J.A., Marcy, G.W., Basri, G., 1995, ApJ, 439, 939
- (69) Zinn, R. 1980, ApJS, 42, 19
- (70) Zoccali, M., Renzini, A., Ortolani, S., Bica, E., Barbuy, B. 2001, AJ, 121, 2638
- (71) Zoccali, M., Renzini, A., Ortolani, S., Greggio, L., Saviane, I., Cassisi, S., Rejkuba, M., Barbuy, B., Rich, R.M., Bica, E. 2003a, A&A, 399, 931
- (72) Zoccali, M., Renzini, A., Ortolani, S., Bica, E., Barbuy, B. 2003b, AJ, 125, 994
- (73) Zoccali, M., Barbuy, B., Hill, V., Ortolani, S., Renzini, A., Bica, E., Momany, Y., Pasquini, L., Minniti, D., Rich, R.M. 2003c, A&A, to be submitted