Hubble Space Telescope Observations of UV Oscillations in WZ Sagittae During the Decline from Outburst111 Based on observations made with the NASA/ESA Hubble Space Telescope, obtained at the Space Telescope Science Institute, which is operated by the Association of Universities for Research in Astronomy, Inc., under NASA contract NAS 5-26555.
Abstract
We present a time series analysis of Hubble Space Telescope observations of WZ Sge obtained in 2001 September, October, November and December as WZ Sge declined from its 2001 July superoutburst. Previous analysis of these data showed the temperature of the white dwarf decreased from 29,000 K to 18,000 K. In this study we binned the spectra over wavelength to yield ultraviolet light curves at each epoch that were then analyzed for the presence of the well–known 27.87 s and 28.96 s oscillations. We detect the 29 s periodicity at all four epochs, but the 28 s periodicity is absent. The origin of these oscillations has been debated since their discovery in the 1970s and competing hypotheses are based on either white dwarf non–radial –mode pulsations or magnetically–channelled accretion onto a rotating white dwarf. By analogy with the ZZ Ceti stars, we argue that the non–radial –mode pulsation model demands a strong dependence of pulse period on the white dwarf’s temperature. However, these observations show the 29 s oscillation is independent of the white dwarf’s temperature. Thus we reject the white dwarf non–radial –mode pulsation hypothesis as the sole origin of the oscillations. It remains unclear if magnetically–funnelled accretion onto a rapidly rotating white dwarf (or belt on the white dwarf) is responsible for producing the oscillations. We also report the detection of a QPO with period 18 s in the September light curve. The amplitudes of the 29 s oscillation and the QPO vary erratically on short timescales and are not correlated with the mean system brightness nor with each other.
1 Introduction
WZ Sge is the prototype of a class of cataclysmic variables that exhibit extreme characteristics: short orbital periods, extremely large dwarf nova outbursts, long outburst recurrence times, and low–mass companion stars. WZ Sge displays 7.5 mag outbursts separated by 2–3 decades and has a stellar mass ratio of 13–25 : 1 with a companion star that is less than 0.11 M⊙ and perhaps as low as 0.03 M⊙ (Steeghs et al. 2001, Ciardi et al. 1998). These extreme characteristics make WZ Sge an ideal proving ground for accretion disk theory.
Among the many challenges WZ Sge offers is the origin of the rapid 27.87 s and 28.96 s oscillations. First seen in the optical by Robinson, Nather & Patterson (1978), these oscillations have been detected in the UV (Welsh et al. 1997, Skidmore et al. 1999), infrared (Skidmore et al. 2002) and in the X-ray (Patterson et al. 1998), though weakly. The oscillations are complex, with large changes in amplitude, phase jitter, and transient signals at nearby periods. Sometimes both periodicities are present in the light curve. Robinson et al. (1978) proposed that the oscillations are due to non–radial –mode pulsations of the white dwarf, a hypothesis supported by the simultaneous presence of the incommensurate 27.87 s and 28.96 s periodicities. Further support comes from analogy with GW Lib, a cataclysmic variable that almost certainly is a bona fide pulsating white dwarf (van Zyl et al. 2000, Szkody et al. 2002).
An alternative hypothesis, proposed by Patterson (1980), attributed the oscillations to a magnetized white dwarf channelling the accretion flow. The white dwarf’s rotation provides the stable clock driving the 27.87 s fundamental periodicity. The other complex, transient oscillations are due to reprocessing of radiation in the accretion disk (see Patterson et al. 1998 for more details). WZ Sge would then be a member of the DQ Herculis (or intermediate polar) class of cataclysmic variables. The detection of a 27.87 s periodicity in ASCA observations added much support to this magnetic accretor model. However, despite the success of this “oblique rotator” model in other cataclysmic variables, the presence of the simultaneous incommensurate periodicities in WZ Sge remains an obstacle for this interpretation.
In their investigation of quasi–periodic oscillations in cataclysmic variables, Warner & Woudt (2002) developed the “low inertia magnetic accretor” (LIMA) model and this yields a third possibility for the origin of the oscillations. The model contains two elements: (i) magnetically–controlled accretion onto a rapidly rotating belt on the white dwarf and (ii) a prograde travelling wave at the inner edge of the disk that produces a vertical thickening which acts as a site for reprocessing and can also occult part of the disk and/or white dwarf. In this scenario, the 27.87 s periodicity arises from magnetic accretion onto the white dwarf, but unlike the DQ Her model, the belt can slip on the white dwarf’s surface and hence the oscillation can vary in phase, amplitude and even period quite naturally. The 28.96 s signal comes from the reprocessing of the 27.87 s signal by the travelling wave whose orbital period is 740 s. While the model can satisfactorally explain the periodicities, and perhaps even the enigmatic 15 s quasi–periodic oscillation (QPO) discovered by Knigge et al. (2002), no other dwarf nova shows persistent QPOs in quiescence, requiring WZ Sge to be unique in this regard.
Understanding the nature of the periodicities in WZ Sge is important not only for its own sake, but because of the implications for accretion disk physics in general. Due to its extreme outburst characteristics, WZ Sge is believed to have a low mass–transfer rate from its companion star (e.g. Osaki 1996). Yet this alone is insufficient to allow accretion disk models to match the outburst size and timescale. One solution requires that the accretion disk have a “hole” at its center (Lasota et al. 1995). This inner disk region may be evacuated by (i) a magnetic field, as in the DQ Her stars where the white dwarf’s magnetic field truncates the inner disk (Warner et al. 1996; Lasota et al. 1999); or (ii) evaporation via a “siphon” into a hot corona (Meyer & Meyer–Hofmeister 1994). This coronal siphon mechanism has properties related to ADAF mechanisms in black-hole accreting systems (e.g. Mineshige et al. 1998, Meyer–Hofmeister & Meyer 2001). Another solution requires the quiescent viscosity in WZ Sge’s accretion disk to be very low: , compared to a more typical value of in “normal” accretion disks (e.g. Smak 1993; Osaki 1996; Meyer–Hofmeister, Meyer & Liu 1998). If WZ Sge can be shown to be a DQ Her–like system, then the “universality” of the viscosity parameter is preserved and no seemingly ad hoc low value for is necessary. On the other hand, if WZ Sge is a white dwarf pulsator, then either the coronal siphon must be operating and we have a white dwarf analog of a black hole accretion disk, or an anomalously low viscosity is required. Either way, understanding the nature of the oscillations in WZ Sge can have an important impact on our understanding of accretion disks.
In 2001 July WZ Sge went into outburst, 23 years after its previous outburst (see Patterson et al. 2002 for extensive coverage of the 2001 outburst). Sion et al. (2003) obtained Hubble Space Telescope (HST) observations of WZ Sge on the decline from outburst and in this paper we present a time series analysis of those same data. These observations provide compelling evidence against a simple white dwarf non–radial –mode pulsation interpretation of the oscillations.
2 The HST Observations
As part of the Director’s Discretionary time, WZ Sge was observed with the HST at four epochs: 2001 September 11, October 10, November 10, and December 11. Each observation lasted approximately 39 min, just under half of the 81.6 min binary orbital period. The UV light was probably dominated by emission from the heated white dwarf from October to December; in September the disk contribution may have been substantial and spectral decomposition into disk and white dwarf emission is much less certain (Sion et al. 2003). See figure 1 in Long et al. (2003) for the outburst light curve and the placement of the September, October and November HST observations.
The HST STIS FUV MAMA detector was used in TIME-TAG mode with a wavelength coverage of 1140 – 1735 Å (see Sion et al. 2003 for additional information regarding the observations). Data reduction was carried out with the standard STSDAS pipeline software. The data were cast into 2 s or 5 s time bins then binned over wavelength into a single UV light curve at each epoch.
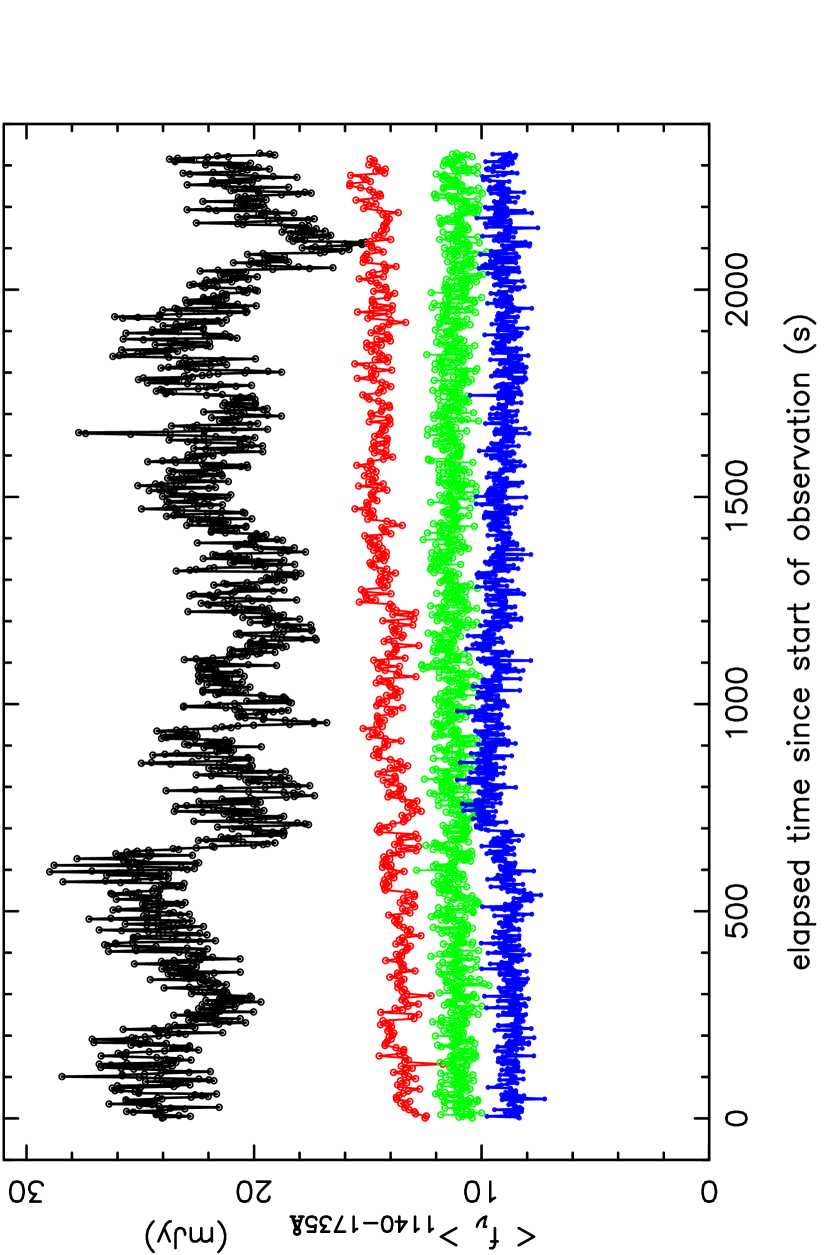
The September observation took place just prior to the minimum before the final re–brightening (or “echo outburst”) of WZ Sge’s slow and erratic decline. The light curve shows large amplitude rapid flickering; a rms variation of 10.5% of the mean flux (21.8 mJy) was present. In contrast, the October, November and December light curves show much less flickering, with variations only slightly above the noise level. Figure 1 shows the four light curves, with respect to the start time of each observation. The mean UV flux dropped by a factor of 2.4 between the September and December observations.
3 Power Density Spectra
Figure 2 shows the power spectrum at each epoch, after prewhitening the light curves with a sliding boxcar average of width 146 s. Since the duration of the light curves were short and therefore the frequency resolution poor ( Hz, or formally equivalent to a period resolution of only 0.36 s at 28.96 s), the power spectra were oversampled by a factor of 2, so only every other bin is independent. The power density is normalized such that a sinusoid of amplitude gives a power of . In all four cases, a spike consistent with the previously known 28.96 s periodicity is present. Henceforth we shall refer to this feature as the P29 signal. The period and amplitude of the P29 signal were determined via least–squares sine fitting. Table 1 lists the observed characteristics of the P29 signal.
The luminosity of the P29 signal dropped by a factor 4.5 between September and October, but thereafter remained fairly constant. In flux units, the amplitude changed from 0.42 mJy in September to 0.09 mJy in October–December, while the fractional amplitude dropped from 1.9% to 0.9%.
The P29 luminosity experienced a larger decrease than the mean UV luminosity, suggesting that P29 responds more quickly to changes in the global mass accretion rate than the mean system. One possible explanation is that the long cooling time of the white dwarf keeps the mean system luminosity well above its quiescent value; indeed in December WZ Sge was still much brighter in the UV than when in quiescence.
The 27.87 s periodicity was not detected, nor was the 15 s quasi–periodicity seen by Knigge et al. (2002) in HST UV observations earlier in the outburst. However, a broad feature near 18 s is present in the September observations which we identify as a quasi–periodic oscillation (QPO).
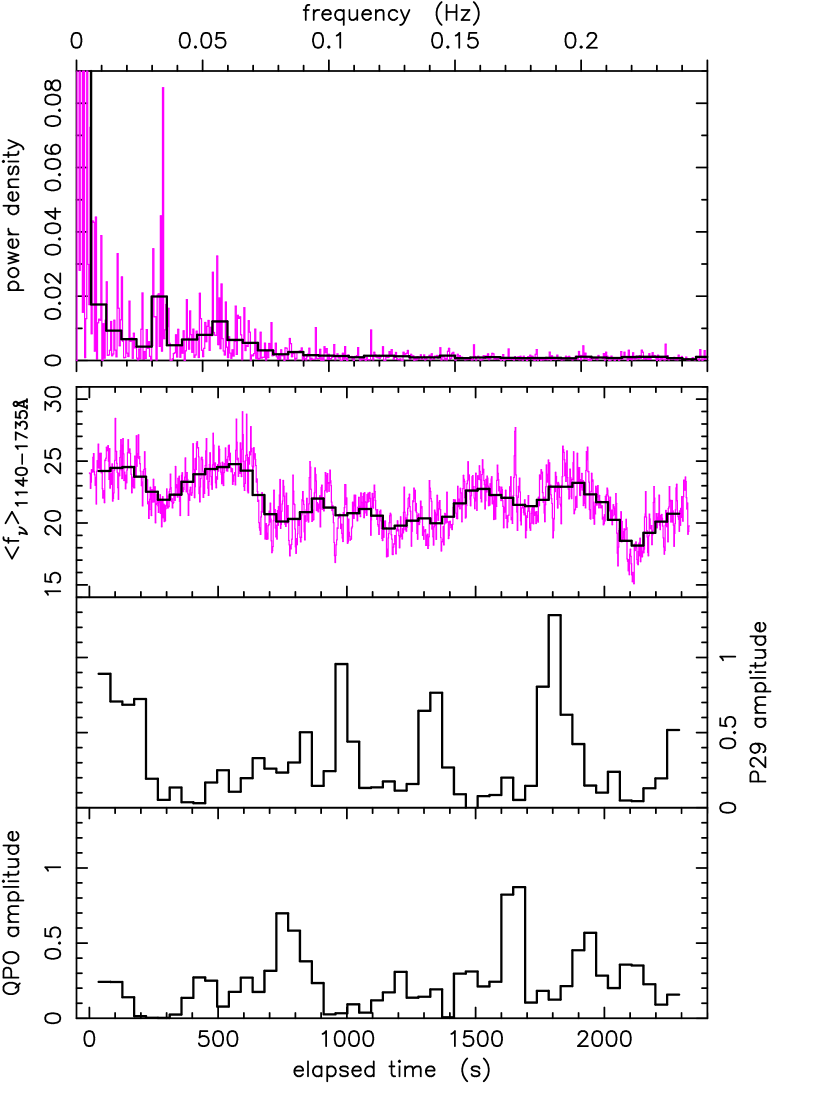
In Fig. 3 we show the September observations in more detail. The power spectrum was recomputed using only a linear detrending, thus the rapid rise in power at low-frequencies due to flickering remains present. Fig. 3 also shows the mean light curve and the amplitude (from the square root of the power) of the P29 and QPO periodicities. The P29 and QPO amplitudes were computed from short segments of the light curve, each 118 s in duration. Fifty such segments were used; they are not independent, having 61% overlap between them. The frequency resolution of such short light curves is very poor so the power spectrum was oversampled by a factor of 4. After removing the white noise background, the power was summed over the intervals 27.8–33.7 s for the P29 signal and 16.9–19.7 s for the QPO signal. The flickering red noise background remains present in these bandpasses, so these amplitudes are still somewhat biased high; the uncertainties in the amplitudes are roughly half the values of amplitudes themselves. The most noticeable features of the amplitudes are their rapid variations and lack of correlation with the mean light curve or each other. No periodicity in P29 or QPO amplitude is apparent. It is interesting to note that despite the P29 signal being present at 4 epochs spanning 3 months, the signal can vary from being quite strong to undetectable in a span of less than a few hundred seconds. Long–term stability is present while short–term stability is not. Although hard to quantify, the amplitude of the QPO is roughly 0.31 mJy or 1.4% of the mean system brightness. If only a single sinusoid is fit to the broad QPO signal, an amplitude of 0.27 mJy (1.3%) at a period of 17.95 s is measured. The relationship, if any, between this weak QPO and the much stronger 15 s and 6.5 s QPOs seen 20 days earlier in the outburst (Knigge at al. 2002) is unclear.
4 Discussion
4.1 The White Dwarf on the Decline from Outburst
Based on the same HST UV spectra as used in this work, Sion et al. (2003) measured the white dwarf’s temperature decline from 29,000 K in 2001 September to 18,000 K in December. Although some of the lines used in the analysis seem unusually narrow, the interpretation of a cooling white dwarf is fairly secure based on the success of the models in matching the observations, in particular the continuum and broad Ly absorption. Further evidence of an elevated white dwarf temperature comes from the lack of strong quasi–molecular H2 or C I absorption lines that are prominent in quiescence. Nevertheless, the interpretation that the white dwarf completely dominates the UV spectrum at these epochs is not fully established. If we omit the September observations on the presumption that the accretion disk contributes significantly to this UV spectrum there still remains a 5000 K drop in white dwarf temperature between October and December. The uncertainties in these temperature estimates are roughly 10%, though the errors are largely systematic rather than statistical.
A similar change in white dwarf temperature was deduced from analysis of Far Ultraviolet Spectroscopic Explorer (FUSE) observation by Long et al. (2003), with temperatures dropping from 25,000 K to 22,600 K between September 29 and November 8. Part of the difference in estimated white dwarf temperature between the non–simultaneous HST and FUSE spectra comes from the uncertainty in the contribution of the disk to the total spectrum. Nevertheless the trend — a substantial cooling of the white dwarf — seems secure. Post–outburst cooling of the white dwarf has been well-documented in other dwarf novae, e.g., in VW Hyi (Gänsicke & Beuermann 1996, Sion et al. 1995), U Gem (Sion et al. 1998), and AL Com (Szkody et al. 1998).
Because of its critical importance in the interpretation to come, we repeat the statement in Godon et al. (2003) regarding the temperature of the white dwarf in WZ Sge. The temperature increase of the white dwarf, due to the enhanced accretion during outburst, is not confined to a thin outermost layer. Such a layer would very quickly radiate away heat gained during the outburst and therefore would remain at an elevated temperature only while substantial accretion is present. However, compressional heating takes place deeper in the star (though still in the outer layers) and takes months to cool, as is the case in WZ Sge (Sparks et al. 1993). So while irradiation from the boundary layer and inner disk heats the surface of the white dwarf, compression gets under the white dwarf’s skin (Sion 1995, 1999). Thus the dwarf nova outburst accretion episode, which dumps on the order of of matter onto the white dwarf (Godon et al. 2003), produces a deep and significant heating of the white dwarf’s envelope.
4.2 The White Dwarf Non–radial –mode Pulsation Hypothesis
Before we present the primary conclusion of our investigation, we briefly summarize the plausibility of the pulsation hypothesis.
The original, and in some ways still best, argument in favor of the white dwarf pulsation hypothesis is the observed simultaneous presence of the incommensurate P28 and P29 periodicities (Robinson et al. 1978). Incommensurate periodicities are common for the ZZ Ceti class of stars (isolated non–radial –mode pulsating white dwarfs; see Kepler & Bradley 1995 for a good review of white dwarfs and pulsation). Also, the white dwarf in GW Lib is known to exhibit ZZ Ceti–type pulsations (van Zyl et al. 2000; Szkody et al. 2002). Additional support, albeit weak, comes from the UV spectrum of the oscillations that are consistent with a white dwarf photospheric origin (Skidmore et al. 1999, Welsh et al. 1997).
Yet the ZZ Ceti stars (and GW Lib) have much longer periods (hundreds of seconds) than WZ Sge. Furthermore, the quiescent temperature of the white dwarf in WZ Sge, 14,600 K (Cheng et al. 1997, Godon et al. 2003), exceeds the nominal upper temperature limit (the “blue edge”) of 13,500 K of the instability strip for ZZ Ceti stars. However, more massive white dwarfs have a hotter “blue edge” than the canonical 0.6 M⊙ white dwarf (Bradley & Winget 1994; Bergeron et al. 1995; Giovannini et al. 1998) and recent studies do in fact suggest WZ Sge has a massive white dwarf, exceeding 0.8 M⊙ and perhaps even as high as 1.2 M⊙ (Steeghs et al. 2001; Skidmore et al. 2000; Knigge et al. 2002; Long et al. 2003; Godon et al. 2003). By linearly extrapolating the blue edge temperature versus mass presented in Giovanninni et al. 1998, a –mode pulsating white dwarf with a temperature of 14,600 K would require a white dwarf mass , barely within acceptable mass estimates. However, the extrapolation to values above is highly uncertain so this crude mass limit should be taken as nothing more than a statement that –mode pulsations cannot be ruled out by quiescent white dwarf temperature arguments. Furthermore, as was suggested by Szkody et al. (2002) for GW Lib, it could be that the temperature determined for WZ Sge is a global average, and a cooler region could be responsible for the pulsations — for GW Lib, a two–temperature white dwarf model fits substantially better then a one temperature model. Note that the thickness of the surface convective zone responsible for the pulsations in WZ Sge should be very thin compared to other ZZ Ceti stars since the timescale of the periodicity depends on the depth of the base of the convective zone (e.g. see Bergeron et al. 1995) — fast periodicities require a shallow convective zone.
Skidmore et al. (1999) extrapolated the observed temperature–period relation of ZZ Ceti stars using the data in Clemens (1993) and found the extrapolation falls tantalizingly close to the quiescent temperature and period of WZ Sge. This bolstered the viability of the white dwarf pulsation hypothesis, and mitigated the objection that the 28 s and 29 s periods are too short to be related to the ZZ Ceti phenomenon. We re-examined this extrapolation of figure 2 of Clemens (1993) and while the observed temperature–period relation for ZZ Ceti stars does project close to WZ Sge, the theoretical relation makes a dramatic drop to very fast periodicities at temperatures just higher than the observed ZZ Ceti star temperatures. From figure 3 of Clemens (1993), for a temperature of 14,600 K the thermal timescale at the bottom of the ionization zone where the pulsations are generated (which should be approximately equal to the observed periodicity) is on the order of only 0.01 s. There are large uncertainties in both the theory and observed temperatures, so this 0.01 s timescale should not be overinterpreted, but the conclusion remains thus: extrapolation of the observed temperature–period relation of ZZ Ceti stars to the WZ Sge regime cannot be trusted. However, we can be confident that if WZ Sge is a non–radial –mode pulsator, it should follow, at least crudely, the trend of the temperature–pulse period relation for isolated white dwarf pulsators: hotter surface temperatures stars have shorter periods and smaller pulsation amplitudes (Clemens 1993).
Given the significant and deep heating of the white dwarf’s envelope discussed in §4.1, it would be astounding if the periods of any non-radial –mode pulsations in WZ Sge did not change substantially as the white dwarf’s temperature changed. Yet in this work we have shown the continued presence of the 29 s periodicity while the white dwarf cools by over 10,000 K. During the outburst decline, WZ Sge no longer lies near the extrapolated empirical ZZ Ceti period–temperature relation and, more importantly, the observed period of the P29 oscillation is independent of the white dwarf’s temperature. These observations therefore rule out non–radial –mode pulsations of the white dwarf as the sole origin of both the 28 s and 29 s pulsations.
4.3 Implications for Magnetic Accretor Hypotheses
Having claimed the observations of the P29 oscillation herald the end of the simple non–radial –mode pulsation hypothesis, we are now left with a challenge: Can the observations be interpreted within the framework of the magnetically–channelled accretion flow models?
Patterson (1980) proposed the magnetic oblique–rotator model for WZ Sge (i.e. the DQ Her–type scenario) based on the stability of the 27.87 s oscillation and the ability to match some of the complex sideband structure in the power spectrum (the “satellite periods”) with simple integer multiples of the orbital frequency. In this model the rotation of the white dwarf provides a stable clock that produces the primary 27.87 s oscillation while the accretion disk provides (transient) structures that reprocess the primary signal. Cheng et al. (1997) measured a rapidly rotating white dwarf ( km s-1 in quiescence) supporting the magnetic rotator model, though this rotational velocity has not been confirmed with post–outburst observations. As Patterson et al. 1998 showed, this fast rotation requires a high–mass (0.8–1.1M⊙) white dwarf if the period of rotation of the white dwarf is 28 s. Finally, the presence of a periodicity at 27.86 s in ASCA 2–6 keV light curves, along with a weaker signal in the 0.4–2 keV band (one half cycle out of phase), lends considerable support for the DQ Her interpretation (Patterson et al. 1998). Lasota et al. (1999) expand upon the DQ Her model and suggest that the rapidly spinning white dwarf actually ejects most of the matter transferred from the secondary star via a magnetic propeller. The P29 signal is caused by reprocessing of the P28 signal by blobs at the outer edge of the disk. A prediction of the model is that the white dwarf cannot be massive ( M⊙), potentially a serious problem if recent estimates suggesting a massive white dwarf are correct.
The LIMA model of Warner & Woudt (2002) is similar in spirit to the DQ Her model of Patterson (1980), but has added flexibility: the periodicities are not tied to the white dwarf’s rotation, but instead to a thin belt on the white dwarf. Since the belt contains much less inertia than the white dwarf, significant short timescale changes in rotation rate are possible. In this model the belt itself amplifies the white dwarf’s magnetic field, allowing a white dwarf with very low magnetic field strength to channel the accretion flow. One particularly attractive feature of the model is that the vertical thickening at the inner disk can also explain the “dips” seen in WZ Sge’s light curve. While the model seems very promising for the dwarf nova oscillations (DNOs) and QPOs seen in other cataclysmic variables, WZ Sge presents more of a challenge. For all other systems the DNOs are present only in outburst,333at least in the optical; Warner & Woudt (2002) point out an X-ray QPO seen during quiescence in HT Cas. while in WZ Sge the DNO signal, P28, is often present in quiescence and seems to have disappeared during the outburst.
4.3.1 The 28s Periodicity
The P28 signal is not present in outburst (e.g. Patterson et al. 1981; Knigge et al. 2002; this work), and remained hidden for nearly 18 years after the 1978 outburst. In the standard DQ Her scenario, the lack of the P28 oscillation during outburst can be explained by the greatly enhanced mass accretion rate (see Patterson et al. 1998): the ram pressure of the accreting gas overwhelms the magnetic pressure and effectively crushes the magnetosphere back onto the surface of the white dwarf and accretion takes place along the equator, not at the magnetic poles. The magnetic field is too weak to channel the accretion flow during outburst, hence the photometric modulations vanish.
Even when deep in quiescence, observations do not always show the P28 signal; this is a puzzle. When present, the P28 signal maintains long–timescale clock–like stability, though short–term phase and amplitude changes are frequent. Inhomogeneities in the disk and or accretion flow must be such that the P28 signal is either not produced, hidden, or canceled for extended durations of time. Patterson et al. (1998) claim that sometimes when the P28 signal was absent other nearby periodicities that could be identified as sidebands of the P28 signal were observed, suggesting the P28 signal was present, just not detected. While the prolonged absence of the P28 signal after the 1978 outburst is not quite fully understood, a plausible reason exists, and the stability, sidelobes, and X–ray modulation can be interpreted, at least consistently, within the context of the DQ Her model.
4.3.2 The 29s Periodicity
As seen here and many times previously, the P29 signal can exhibit rapid changes in amplitude and phase on timescales as short as minutes (e.g. Skidmore et al. 1997), yet the mean period is constant and on occasion the signal remains quite stable — perhaps even retaining phase coherence for up to a week (Patterson et al. 1998). The P29 signal exists throughout most of the dwarf nova eruption cycle: before, during and after the superoutburst — though perhaps not close to the peak of outburst (Knigge et al. 2002). The P29 signal does not correlate with the instantaneous luminosity of the system (and hence the inferred instantaneous — see Fig. 3), though its amplitude is somewhat tied with the average brightness of the system on the decay from outburst. As we have shown in this work, P29 is de-coupled from the white dwarf temperature.
As Patterson (1998) stated, the P29 signal does not naturally appear as any known simple ratio or sum of periodicities in the system (orbital or spin). In the DQ Her model, the P29 signal is created by the reprocessing of the P28 signal by some structure in the disk: P29 is the “beat” between P28 and a blob orbiting in the disk with a period of 740 s, most likely at the inner edge of the disk. Similarly, in the LIMA model of Warner & Woudt (2002), the P28 signal corresponds to a DNO while the P29 signal corresponds to a QPO, created by the reprocessing of the DNO signal. While a periodicity of 741 s has been detected in WZ Sge’s light curve (Warner & Woudt 2002), it is very rare, and the DNO driving signal (i.e. P28) was not present at that time.
In the DQ Her model, the P28 period remains constant during outburst since it is maintained by the rotation of the entire white dwarf. In contrast, on the rise to outburst the period of the P29 signal should increase as the radius of the reprocessing inner disk shrinks, and the signal disappear entirely when the disk reaches the white dwarf. As the disk hole (i.e. magnetosphere) re–opens during the outburst decline, the P29 oscillation should re–appear and decrease back to its quiescent period.
In the LIMA model, the DNO period should decrease as more and more angular momentum is accreted into the belt during the rise to outburst. The P29 (QPO) signal would also experience a period change, for two reasons: it is being driven by the faster DNO and the inner radius of the disk where reprocessing is occurring is shrinking. On the decline from outburst, the periods should increase. A strong period–luminosity relationship through the outburst should exist, as is the case for DNOs of other systems (see Woudt & Warner 2002 and references therein).
In both magnetic accretor scenarios, the P29 signal should vary during the outburst. Yet as we have shown here, this is not the case in WZ Sge: the P29 signal remains constant in period on the decline from outburst, and with the same period it has in quiescence. In fact, just the presence of the P29 signal in the absence of the P28 signal during the outburst decay presents a significant problem for the magnetic accretor models. In the DQ Her model, if the magnetosphere is crushed onto the white dwarf thereby quenching the P28 signal, the inner edge of the disk is now coincident with the white dwarf’s surface. So not only is there no inner disk region to reprocess any modulation, there is no modulation to reprocess. And yet the P29 signal is quite strong, stronger in fact than in quiescence, at least in the 2001 September observations. As in the DQ Her model, the LIMA model requires the presence of the DNO at 28 s to drive the QPO at 29 s. The complete absence of the P28 signal in the observations presented here is vexing. We clearly do not understand the mechanism producing the P29 signal.
The continued presence of the P29 signal during the outburst decay, as the disk reforms and the mass accretion rate and white dwarf temperature dramatically change, suggests that a clock of exceptional (long–term) stability is involved. The most immediate candidate is the rotation of the white dwarf, but how this could work is not at all apparent. We conclude that while the rotating magnetic accretor models remain viable, they are sorely incomplete.
5 Summary
We present ultraviolet light curves of the dwarf nova WZ Sge as it declined from its 2001 July superoutburst. The observations were made with the HST STIS and were obtained on 2001 September, October, November and December. The well–known 28.96 s periodicity was present at all four epochs, but the 27.87 s periodicity was absent. We also note the appearance of a QPO with period 18 s in the September light curve.
Between 2001 September and December the temperature of the white dwarf dropped from 30,000 K to 18,000 K (Sion et al. 2003). We argue that by analogy with the ZZ Ceti stars, the white dwarf non–radial –mode pulsation model for the origin of the 27.87 s and 28.96 s periodicities (Robinson et al. 1976) demands a large change in the pulsation period as the white dwarf’s temperature changes. However, these observations do not support this prediction: the 29 s oscillation period is observed to be independent of the white dwarf’s temperature. We consider this the coup de grace of the non–radial –mode pulsation hypothesis as the sole origin of both the 28 s and 29 s pulsations.
In light of these observations, the alternative hypotheses for the origin of the periodicities, the venerable DQ Her magnetic rotator model (Patterson 1978) and the LIMA model of Warner & Woudt (2002), do not fare particularly well either. In these models the 28 s periodicity is related to rotation of either the entire white dwarf or an accretion belt on the white dwarf. The 28 s modulation is ultimately responsible for driving all the other periodicities including the 29 s modulation. The presence of a relatively strong 29 s periodicity in the total absence of the 28 s periodicity is a problem for the models. While the models remain viable, they must be considered incomplete. Finally, we remark that while non–radial –mode pulsations cannot be responsible for the oscillations in WZ Sge, this does not necessarily imply that other modes of white dwarf pulsation are ruled out. In particular, the periods of non–radial –modes (Papaloizou & Pringle 1978) can be near those of WZ Sge and are not very temperature sensitive so they may play a role in WZ Sge’s puzzling behavior.
References
- Bradley (1995) Bradley, P.A. 1995 Baltic Astronomy 4, 536
- Bradley & Winget (1994) Bradley, P.A. & Winget, D.E. 1994 ApJ 421, 236
- Bergeron et al. (1995) Bergeron, P., Wesemael, F., Lamontagne, R., Fontaine, G. Saffer, R.A. & Allard, N.F. 1995 ApJ 449, 258
- Ciardi et al. (1998) Ciardi, D.R., Howell, S.B., Hauschildt, P.H. & Allard, F. 1998 ApJ 504, 450
- Cheng et al. (1997) Cheng, F.-H., Sion, E.M., Szkody, P., & Huang, M. 1997, ApJ, 484, L149
- Clemens (1993) Clemens, J.C. 1993 Baltic Astronomy 2, 407
- Gänsicke & Beuermann (1996) Gänsicke, B.T. & Beuermann, K. 1996 A&A 309, 47L
- Giovannini et al. (1998) Giovannini, O., Kepler, S.O., Kanaan, A., Wood, M.A., Claver, C.F. & Koester, D. 1998 Baltic Astronomy 7, 131
- Godon et al. (2003) Godon, P., Sion, E.M., Gänsicke, B.T., Knigge, C., Sparks, W.M., & Starrfield, S. 2003 ApJ (in preparation)
- Kepler & Bradley (1995) Kepler, S.O. & Bradley, P.A. 1995 Baltic Astronomy, 4, 166
- Knigge et al. (2002) Knigge, C., Hynes, R.I., Steeghs, D., Long, K.S., Araujo–Betancor, S. & Marsh T.R. 2002 ApJ 580, L151
- Lasota et al. (1995) Lasota, J.–P., Hameury, J.M. & Huré 1995 AA 302, 29L
- Lasota et al. (1999) Lasota, J.–P., Kuulkers, E. & Charles, P. 1999 MNRAS 305, 473
- Long et al. (2003) Long, K., Froning, C. S., Gänsicke, B., Knigge, C., Sion, E. M. & Szkody, P. 2003 ApJ 591, 1172
- Meyer–Hofmeister & Meyer (2001) Meyer–Hofmeister, E. & Meyer F. 2001 A&A 372, 508
- Meyer–Hofmeister et al. (1998) Meyer–Hofmeister, E., Meyer, F. & Lui, B. 1998 A&A, 339, 507
- Mineshige et al. (1998) Mineshige, S., Lui, B., Meyer, F. & Meyer–Hofmeister, E. 1998 PASJ, 50, L5
- Osaki (1996) Osaki, Y. 1996 PASP 108, 39
- Papaloizou & Pringle (1978) Papaloizou, J. & Pringle. J. E. 1978 MNRAS 182, 423
- Patterson (1980) Patterson, J. 1980 ApJ 241, 235
- Patterson et al. (2002) Patterson, J., Masi, G., Richmond, M.W., Martin, B., Beshoer, E., Skillman, D.R., Kemp, J., Vanmunster, T., Rhea, T., et al. 2002 PASP, 114, 721
- Patterson et al. (1981) Patterson, J., McGraw, J.T., Coleman, L. & Africano, J.L. 1981 ApJ 248, 1067
- Patterson et al. (1998) Patterson, J., Richman, H., Kemp, J. & Mukai, K. 1998 PASP 110, 403
- Robinson et al. (1978) Robinson, E.L., Nather, R.E. & Patterson, J. 1978 ApJ 219, 168
- Sion (1995) Sion, E.M. 1995 ApJ 438, 876
- Sion (1999) Sion, E.M. 1999 PASP 111, 532
- Sion et al. (2003) Sion, E.M., Gänsicke, B.T., Long, K.S., Szkody, P., Cheng, F.H. , Howell, S.B., Godon, P., Welsh, W.F., Starrfield, S., Knigge, C., Sparks, W.M. 2003 ApJ 592, 1137
- Sion et al. (1995) Sion, E.M., Szkody, P., Cheng, F.H., & Huang, M. 1995, ApJ, 444, L97
- Sion et al. (1998) Sion, E.M., Cheng, F.H., Szkody, P., Sparks, W., Gaensicke, B., Huang, M. & Mattei, J. 1998 ApJ 496, 449
- Skidmore et al. (2000) Skidmore, W., Mason, E., Howell, S.B.,Ciardi, D.R., Littlefair, S. & Dhillon, V.S. 2000 MNRAS 318, 429
- Skidmore et al. (1997) Skidmore, W., Welsh, W.F., Wood, J.H. & Stiening, R.F. 1997 MNRAS 288, 189
- Skidmore et al. (1999) Skidmore, W., Welsh, W.F., Wood, J.H., Catalán & Horne, K. 1999 MNRAS 310, 750
- Skidmore et al. (2002) Skidmore, W., Wynn, G. A., Leach, R. & Jameson, R. F. 2002 MNRAS, 336, 1223
- Smak (1993) Smak, J. 1993 Acta Astronomica, 43, 101
- Sparks et al. (1993) Sparks, W.M., Sion, E.M., Starrfield, S.G. & Austin, S. 1993 Annals of the Israel Physical Society, 10, 96
- Steeghs et al. (2001) Steeghs, D., Marsh, T. R., Maxted, P. F. L., Kuulkers, E. & Skidmore, W. 2001 ApJ, 562, L145
- Szkody et al. (1998) Szkody, P., Hoard, D.W., Sion, E.M., Howell, S.B., Cheng, F.H. & Sparks, W.M. 1998 ApJ 497, 928
- Szkody et al. (2002) Szkody, P., Gänsicke, B.T., Howell, S.B. & Sion, E.M. 2002 ApJ, 575, 79L
- van Zyl et al. (2000) van Zyl, L., Warner, B., O’Donoghue, D., Sullivan, D., Pritchard, J. & Kemp, J. 2000 Baltic Astronomy, 9, 231
- Warner et al. (1996) Warner, B., Livio, M. & Tout, C. A. 1996 MNRAS 282, 735
- Warner & Woudt (2002) Warner, B., & Woudt, P.A. 2002 MNRAS 335, 84
- Welsh et al. (1997) Welsh, W.F., Skidmore, W., Wood, J.H., Cheng, F.H. & Sion, E.M. 1997 MNRAS 291, L57
- Woudt & Warner (2002) Woudt, P.A. & Warner, B. 2002 MNRAS 333, 411

| Date | Start Time | Mean UV Flux | Best–fit | Best–fit | Relative | Unbiased 28.96 s |
|---|---|---|---|---|---|---|
| (yyyy-mm–dd) | (UT) | (mJy) | Period (s) | Amplitude (mJy) | Amplitude (%) | Amplitude (mJy) |
| 2001–09–11 | 03:03:28 | 21.8 2.2 | 29.068 0.067 | 0.416 0.021 | 1.9 0.2 | 0.339 |
| 2001–10–10 | 12:57:13 | 14.1 0.6 | 28.844 0.085 | 0.093 0.018 | 0.7 0.1 | 0.074 |
| 2001–11–10 | 11:45:32 | 11.2 0.4 | 28.877 0.053 | 0.102 0.015 | 0.9 0.1 | 0.093 |
| 2001–12–11 | 00:34:59 | 9.1 0.5 | 29.052 0.111 | 0.079 0.014 | 0.9 0.2 | 0.077 |
Note. — Unbiased amplitudes are determined by holding the period fixed at 28.96 s in the fit; uncertainties are the same as in the least–squares best–fit sinusoid case. In all cases, the formal period resolution at 29 s is 0.36 s.