Early Growth and Efficient Accretion of Massive Black Holes at High Redshift
Abstract
Black-hole masses of the highest redshift quasars () are estimated using a previously presented scaling relationship, derived from reverberation mapping of nearby quasars, and compared to quasars at lower redshift. It is shown that the central black holes in luminous quasars are very massive (). It is argued that the mass estimates of the high- quasars are not subject to larger uncertainties than those for nearby quasars. Specifically, the large masses are not overestimates and the lack of similarly large black-hole masses in the nearby Universe does not rule out their existence at high-. However, AGN host galaxies do not typically appear fully formed and/or evolved at these early epochs. This supports scenarios in which black holes build up mass very fast in a radiatively inefficient (or obscured) phase relative to the stars in their galaxies. Additionally, upper envelopes of and ergs s-1 are observed at all redshifts.
Accepted by ApJ, Sept. 14, 2003 \journalinfoTo appear in The Astrophysical Journal, 600, January 1, 2004
1 Introduction
High-redshift quasars are of immediate interest to both cosmologists and active galactic nuclei (AGNs) specialists for several reasons. For example, quasars can be observed out to greater distances and with more ease than quiescent galaxies, owing to their unparalleled energy output over essentially the entire electromagnetic spectrum (e.g., Elvis et al. 1994). Since quasars reside in the central regions of massive galaxies (e.g., Boroson & Oke 1982; Boroson, Oke, & Green 1982; Kukula et al. 2001), they provide a valuable beacon to locate galaxies at early times, which is difficult by other means111However, SIRTF, JWST, FIRST/Herschel and ALMA will undoubtedly change this (e.g., Neufeld 1999; Omont 2003). (Lanzetta et al. 1999). Furthermore, quasar activity is intimately connected with the hierarchical buildup of galaxies (e.g., Haehnelt, Natarajan, & Rees 1998; Cattaneo, Haehnelt, & Rees 1999; Ferrarese & Merritt 2000; Gebhardt et al. 2000a; Haehnelt & Kauffmann 2000; Colina et al. 2001; Menou, Haiman, & Narayanan 2001). In fact, quasars possibly play a profound role for the formation and evolution of most, if not all, galaxies (e.g., Kauffmann & Haehnelt 2000; Milosavljević & Merritt 2001, 2002; Benson et al. 2002). The quasar phase may even precede the formation of the galaxies themselves (Rix et al. 2001; Kauffmann & Haehnelt 2000; Omont et al. 2001) and impact their early formation and evolution (e.g., Silk & Rees 1998; Haiman, Madau, & Loeb 1999; Theuns, Mo, & Schaye 2001; Di Matteo et al. 2003).
By virtue of being associated with the highest density peaks in the matter distribution (e.g., Efstathiou & Rees 1988; Volonteri, Haardt, & Madau 2002), quasars are an easy probe of these peaks at the earliest epochs and hence of some of the first structures formed in the early Universe (e.g., Haiman & Loeb 1998). In addition, quasars help probe the nature of the medium in which they are embedded. For example, the spectra of quasars place constraints on the epoch of re-ionization (Fan et al. 2002). The presence of luminous, massive222This is typically estimated via the Eddington argument but these high black-hole masses are also confirmed in this work. quasars at redshift 6, when the Universe was less than 10% of its present age, already place much-needed constraints on models of the earliest structure formation (Turner 1991; Haiman & Loeb 2001; Volonteri et al. 2002).
High-redshift quasars are also studied (a) to track the growth and evolution of the central black holes (Haiman & Loeb 2001; Merritt & Ferrarese 2001a; Ferrarese 2002; A. Steed et al. 2003, in preparation), (b) to understand the central engine (e.g., Peterson, Polidan, & Pogge 2001; Peterson 2002) responsible for their monstrous energy release, and (c) to understand the evolution of the quasars and active galaxies in general (e.g., Pei 1995; Boyle et al. 2000; see Hartwick & Schade 1990 and Osmer 2003 for reviews).
It is well established that quasars and their activity reign333Quasars were most numerous at the epoch at , yet they are still rare objects (e.g., Hartwick & Schade 1990) relative to the galaxy population (e.g., Huchra & Burg 1992). between redshift 2 and 3 (Osmer 1982; Hartwick & Schade 1990; Warren, Hewett, & Osmer 1994; Schmidt, Schneider, & Gunn 1995; Kennefick, Djorgovski, & Meylan 1996; Fan et al. 2001a). The decline in comoving space density above redshifts of is significant not only for the optically selected quasars but also for the radio-selected subset (Shaver et al. 1996; Hook et al. 2002) and for X-ray selected sources (Hasinger 2002); the latter may decline more slowly with increasing redshift, but the statistics are still relatively poor. The question naturally arises whether or not the space density drop toward higher also signifies a change in cardinal properties of the quasar population at that epoch, given the relatively short time available to generate massive black holes; at the Universe was only 10% of its present age for a Universe (and 15% of its present age for ).
Recent developments allow virial black-hole masses in distant quasars to be estimated using scaling relationships calibrated to reverberation mapping masses of nearby AGNs and quasars (Wandel, Peterson, & Malkan 1999; Kaspi et al. 2000; Vestergaard 2002, hereafter Paper I). In this work, these scaling relationships are used to estimate the black-hole masses in high- quasars. The main focus in this work is to compare the typical central masses of quasars just below and above the epoch at which the comoving space density of quasars declines. In addition, these masses are discussed in light of our current knowledge of the nature of their host galaxies. Representative quasar samples in the redshift range are studied (§ 3), including part of the large, high-quality data bases of high-redshift quasars now available. Several surveys have in the past 10 years turned up a large number of previously unknown quasars (e.g., Kennefick et al. 1995a, 1995b, 1996; Storrie-Lombardi et al. 1996; Schneider, Schmidt, & Gunn 1997; see also Constantin et al. 2002). The Sloan Digital Sky Survey (SDSS) has in recent years had particular success in uncovering an even larger number of quasars at redshifts greater than 3.5 (Fan et al. 1999, 2000, 2001b, 2001c; Anderson et al. 2001). For a large subset of these quasars for which spectra are published, the black-hole masses were estimated in this work and compared with mass estimates of lower-redshift quasars, namely the well-selected quasar sample of Vestergaard (2000). Given current and earlier survey capabilities, these samples necessarily consist of luminous quasars. Since data on nearby luminous quasars and AGNs readily exist in the Bright Quasar Survey sample (hereafter BQS; Schmidt & Green 1983), this sample was also included for comparison and reference. The lack of objects between does not affect the conclusions of this study.
The structure of this paper is as follows. The approach in estimating , , and is outlined next (§ 2). The data are described in § 3, presented in detail in § 4, and discussed in § 5. In particular, since the central masses are very large () for the quasars, the efficacy of the scaling relations is examined in § 5.1; it is concluded that the scaling relations are fully applicable to the high- quasars with an uncertainty of a factor 4. Section 5.2 discusses the fact that although the masses of these high- active black holes are rather large, the AGN host galaxies at appear to be rather young, and even small, young galaxies at are capable of hosting massive black holes. This leads to the conclusion that super-massive black holes were in place long before the bulk of the stellar mass in the quasar host galaxies. A summary and conclusions are provided in § 6.
A cosmology with = 75 , q0 = 0.5, and = 0 is used throughout, although the main conclusions of this study do not depend on the specific choice of cosmology. However, it is worth mentioning that adoption of a cosmology of = 70 , = 0.3, = 0.7 will increase the mass estimates at the highest redshifts by no more than a factor 2.4 and by a decreasing factor at lower redshifts.
2 MBH, Lbol, and Lbol/LEdd Measurements
The samples of quasars studied here cover the redshift ranges and . Therefore, the observed optical spectra cover restframe wavelengths including H for the BQS and the region around C iv for the higher redshift quasars.
The virial masses, , are estimated from single-epoch spectral measurements using the relationships presented in Paper I (eqns. 1, 2, A5, and 7), since they are relevant for spectroscopic data covering the wavelength regions around the H and C iv lines. Here is the Doppler width of an emission line and is the radius of the line-emitting region. Note that also the high-ionization line-emitting gas, including C iv, yields virial masses consistent with those derived from H in all the objects for which this can be tested (Peterson & Wandel 2000; Onken & Peterson 2002). Hence, the C iv line width is valid as a measure of (see discussion in § 5.1).
The important scaling relationship for the mass equations listed below is the radius luminosity relation, that allows the size of the broad line region (BLR) to be estimated from the optical continuum luminosity of the source. The empirical scaling law, applicable to Balmer lines and based on reverberation-mapped nearby AGNs and quasars, is (Kaspi et al. 2000):
| (1) |
The mass equation based on optical data (hereafter, the ‘optical relationship’) is
and the mass equation relevant for UV data (the ‘UV relationship’) is
| (4) | |||||
where the sample standard deviation of the weighted mean is 0.45 and shows the intrinsic scatter in the sample (Paper I). This is confirmed by the black-hole masses of reverberation mapped AGNs which exhibit an intrinsic scatter of about 0.3 0.5 dex (Peterson 2002) around the relationship, established by local quiescent galaxies (e.g., Ferrarese & Merritt 2000; Gebhardt et al. 2000a; see also Gebhardt et al. 2000b and Ferrarese et al. 2001 for comparisons of some AGN masses with the relation). Both the optical and the UV relationships were calibrated (Paper I) to virial mass estimates of low-redshift active galaxies determined from reverberation-mapping analysis.
The velocity dispersion, , of the broad line gas is estimated using the broad emission line width as characterized by FWHM. While equation (1) is valid for the Balmer lines only, a similar scaling law, , is assumed for the UV relationship; the constant of proportionality is determined by the calibration and included in equation (4). Note that when applying these scaling relationships to higher- quasars, a large extrapolation in luminosity is not performed, which might otherwise raise concern. The efficacy of the mass scaling relationships is discussed in § 5.1.
The bolometric luminosities are estimated based on existing average spectral energy distributions (SEDs). SEDs are only available for a small group of distant quasars. Kuhn et al. (2001) found no significant differences between the restframe optical and UV energy distributions for 15 quasars and low- quasar SEDs. It is fair to assume the Kuhn et al. sample is representative, also of quasars at higher redshifts yet, given the similarity of quasar spectra at all redshifts (see § 5). Specifically, this means that the empirical average SED of low- active galaxies and quasars (Elvis et al. 1994) is also representative of the average SED of more distant quasars. Here, the average radio-quiet quasar (RQQ) SED of Elvis et al. (1994) is updated to reflect the more representative optical-to-X-ray slope of 1.43 determined by Elvis, Risaliti, & Zamorani (2002) using new and improved X-ray data. This updated RQQ SED was used to estimate bolometric correction factors applicable also to radio-loud quasars (RLQs), because (1) high- RLQs appear to constitute a similar low fraction (10%) of all quasars as seen for 2 quasars (Stern et al. 2000), and (2) the average RLQ SED has not yet been updated (M. Elvis, 2002, private communication). The bolometric correction factors to the monochromatic continuum luminosities, , at rest wavelengths of 1350Å, 1450Å, and 4400Å were computed444 The bolometric correction to (4400Å) of 9.74 is slightly lower than the average correction of 11.8 established by Elvis et al. (1994). The reason is in part the weaker contribution from the X-rays, and in part due to the use of the average SED in this work compared to the average of the individual bolometric correction factors quoted by Elvis et al. (1994). The scaling factor of 9.74 is preferred for (4400Å) for consistency with the 1350Å and 1450Å bolometric correction factors which were not quoted by Elvis et al. to be 4.62, 4.65, and 9.74, respectively. Applying a bolometric correction to the UV continuum luminosities for the high- quasars reduces the uncertainty in the estimate compared to using a bolometric correction to luminosities at other wavelengths. The reasons are that one eliminates the uncertainty associated with the measured UV continuum slope and extrapolation to other wavelengths, and since 1350 and 1450 are close to the peak of the big blue bump, the associated bolometric correction factors are the smallest relative to other wavelengths.
The conservative measurement uncertainties estimated from the line widths, continuum fluxes, and continuum slopes were propagated to estimate the measurement errors on , , and the Eddington ratios /. These uncertainties do not include the uncertainty associated with the use of bolometric corrections or the use of the simple scaling relationships in eqn. (2), (1), and (4) to estimate the . A statistical 1 uncertainty of about 0.4 dex and 0.5 dex (i.e., a factor 2.5 and 3 in the mass) for the optical and UV relationships, respectively, was found for the sample studied in Paper I. This additional uncertainty must be kept in mind, especially when considering the masses in absolute terms. However, since can likewise be reasonably estimated for high redshift quasars (§ 5.1), statistical analysis and comparison of the relative masses of high-redshift quasars should be reasonably sound.
3 Data
Several samples of quasars at low, intermediate, and high redshift are analyzed here as described in detail below.
3.1 Low Redshift Quasars
This sample consists of the 87 BQS quasars at . For the objects with available reverberation-mapping masses, these masses are used, as computed in Paper I. For the remaining sources, the masses are estimated from equation (2). The measurements of line widths and continuum luminosities used are explained in detail in Paper I. Briefly, the FWHM(H ) measurements were primarily adopted from Boroson & Green (1992). The monochromatic luminosities, (5100Å), were determined for most of the objects from the spectrophotometry by Neugebauer et al. (1987), but for a few sources (5100Å) was computed from 4400 Å flux densities (Kellerman et al. 1989) by adopting a power-law slope, 0.5 (F). Bolometric luminosities for different subsets of the BQS quasars have been measured by a few authors (Sanders et al. 1989; Elvis et al. 1994; Lonsdale, Smith, & Lonsdale 1995; Wilkes et al. 1999a). Comparison of the measurements for quasars common between two or more of these studies shows that the values are generally relatively similar555While one can argue that one of the studies has better X-ray data, then another has better IR data, and for individual objects, the SED of one study may be preferred over that of another. However, it is beyond the scope of this work to compile updated SEDs based on the best data now available. within a common scatter of 0.2 0.3 dex, consistent with the estimated measurement uncertainties quoted by Elvis et al. (1994). In the interest of simplicity and consistency with the data used for the quasar samples at higher-redshifts, the values were here estimated as (4400Å) (§ 2). Adopting this scaling introduces an uncertainty similar to the measurement uncertainties quoted above and is thus considered acceptable. Errors on the parameters are propagated using the measurement uncertainties on the primary measurements as described in Paper I.
3.2 Intermediate Redshift Quasars
The sample of 114 quasars at intermediate redshifts () studied here is that analyzed by Vestergaard (2000). The sample consists of 68 RLQs and 48 RQQs. The RLQs were selected from Barthel et al. (1988), Barthel, Tytler, & Thomson (1990), Murphy, Browne, & Perley (1993), and the 3C and 4C radio catalogs to span the range of observed quasar radio spectral indices; this allows a study of how the spectral features may change with source inclination with respect to our line of sight (e.g., Vestergaard, Wilkes, & Barthel 2000). Most of the RLQ data are from Barthel et al. (1990). The individual RQQs were selected from Hewitt & Burbidge (1993) to be well-matched and paired in redshift and luminosity to individual quasars in the radio-loud subset. The purpose was to study the rest UV spectral characteristics with radio properties (Vestergaard 2000). Given the careful sample selection, this sample of 116 quasars is here considered reasonably representative of the quasar population to be compared with the higher redshift quasars. The full sample, as opposed to the pair-matched subset, is studied here to improve the statistical significance of the comparison.
The C iv line width, FWHM(C iv), was measured reliably for this sample on a smooth representation of the emission profile, obtained by modeling with 2 to 3 Gaussian functions (following Laor et al. 1994), above a global power-law continuum fit to line-free windows (e.g., Francis et al. 1991; Vestergaard & Wilkes 2001). The FWHM uncertainties were estimated by varying the continuum fit within the continuum flux and remeasuring the FWHM. The continuum fluxes were measured from the best fit power-law and the flux uncertainties were determined as the scatter around this fit in the continuum fitting windows. The bolometric luminosity is estimated from (1350Å), i.e., = 4.62 (1350Å) [§ 2].
3.3 High Redshift Quasars
The high- quasar sample consists of 150 quasars, mostly from the SDSS, selected from recently published work, as detailed below. For consistency, the spectra of these quasars were measured in a similar manner, as follows: FWHM(C iv) was measured relative to a reasonable, best-fit continuum determined using virtually line-free continuum windows. The continuum flux at rest frame wavelengths 1350Å and 1450Å were measured from this best-fit power-law continuum. Conservative measurement uncertainties on line widths, continuum fluxes, and spectral slopes were estimated based on the continuum rms noise, as described above for the intermediate- quasars. The spectral slope measured here is only used when more accurate, published values are unavailable. was estimated as 4.65 (1450Å) (see § 2).
The source studies from which the individual quasars are drawn are listed below. In each case, the details of the analysis specific to the individual data set are outlined.
Constantin et al. (2002):
High-quality spectra of these quasars were kindly provided by the authors. Constantin et al. corrected their data for Galactic reddening using Schlegel, Finkbeiner, & Davis (1998) values and the Cardelli, Clayton, & Mathis (1989) extinction curve. Constantin et al. quote an uncertainty of 0.2 dex in their AB(1450Å)-based, monochromatic luminosities. The (1450Å) values measured here were recalibrated to match the AB-based (1450Å) for the few objects showing a difference larger than 0.2 dex between the two sets of luminosity measurements. The spectra of 40 of the 44 quasars could be measured. A few quasars are too strongly absorbed in the C iv emission profile for a reasonable measurement of the line width. One quasar exhibited no conspicuous emission lines other than Ly and N v.
Anderson et al. (2001):
The digital SDSS spectra of these 125 quasars are publicly available. The best quality spectra were selected for measurement. A few other poorer quality spectra were also measured. The spectra were first corrected for Galactic reddening using the Schlegel et al. (1998) values obtained from NED and the Cardelli et al. (1989) reddening curve. For a subset (60) of the quasars Fan et al. (1999, 2000, 2001b) present AB(1450Å) magnitudes to which the spectral measurements were recalibrated.
Fan et al. (1999, 2000, 2001b):
The best-quality spectra (kindly provided by X. Fan) of these SDSS quasars that include a full, measurable C iv line profile were selected for measurement. The continuum luminosities measured here at 1350Å and 1450Å were recalibrated to the (dereddened) AB(1450Å) magnitudes. Fan et al. define 3 quasar subsamples. The set of 59 quasars analyzed here (hereafter the “Fan et al. sample”) is drawn from these subsamples, as follows: (a) 34 of the 39 quasars that comprise the well-defined “color-selected sample” (3.6 5; mag), complete within the survey area (see Fan et al. 2001b for details), (b) 12 quasars from the “bright subsample” ( mag) that are not included in (a), and (c) 13 of the 18 “faint subsample” quasars ( mag). As mentioned, the selection is mostly based on data quality (but see below). Ten quasars were common between the originally selected “Anderson et al. ” and the “Fan et al. ” samples. Since neither of these samples are complete, each of those quasars only occur once in the “high- sample”; each object was included in the sample which has the better spectrum. The data of the “color-selected quasars” are presented by Fan et al. (1999, 2001b) and Schneider et al. (2001). The photometry of Fan et al. (2001b) and line widths measured in the high spectra of Constantin et al. were used for two objects common to these studies. Five quasars were excluded from the “color-selected sample”: the spectra of three of these quasars did not include the C iv emission line. For another object (J020731.68010348.9) the poor spectrum quality precludes a FWHM(C iv) measurement. Finally, the spectrum of a fifth object, J225529.09003433.4, could not be located in any of the references listed or in the SDSS archive. It will be shown in the next section that the “color-selected sample” is statistically similar in the distributions of , , and to those of the other high- quasar samples (), as expected if this is a representative subset of quasars.


Pentericci et al. (2002):
The authors present near-IR spectra of two of the quasars discovered in SDSS (Fan et al. 2001c), namely SDSSp J103027.10052455.0 ( = 6.28) and SDSSp J130608.26035626.3 ( = 6.00). The C iv line widths are estimated from enlarged versions of the published spectral plots, while the luminosities are adopted from Fan et al. (2001c). The width of C iv measured here for SDSSp J103027.10052455.0 is consistent with that quoted by Pentericci et al. within the errors. The C iv profile is truncated in the blue-most part of the wing. The FWHM estimate (=7000 km s-1) used here for was obtained by measuring a reasonable extension of the observed blue profile to the continuum level indicated. The (large) FWHM measurement uncertainty adopted is based on a conservative estimate of the continuum uncertainty.
4 Distributions of Mass, Luminosity, and Eddington Ratio
4.1 Number Distributions
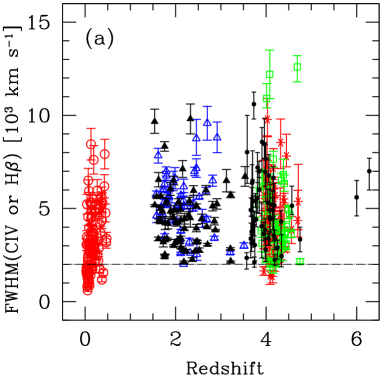
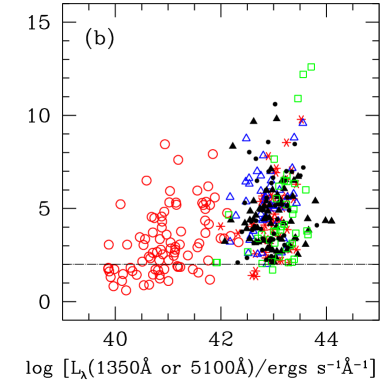
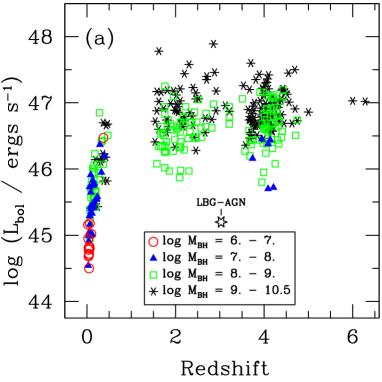
The histograms of masses, bolometric luminosities, and Eddington ratios are shown in Figure 1 for different redshift bins. Figure 2 shows the distributions of emission-line widths with redshift and continuum luminosities.
It is evident from Figure 1 that the intermediate and high-redshift () quasars are all massive () and luminous (ergs s-1) and have somewhat similar and distributions. As discussed in § 4.2 the lower boundaries are due to selection effects. The two radio types of the intermediate-redshift quasars, which are matched in luminosity and redshift, display no significant difference, in contrast to some studies claiming black-holes of RLQs are more massive (e.g., Laor 2000; McLure & Dunlop 2001). The radio-loud sample does have a larger number of luminous quasars than the radio-quiet subset (see § 3.2). Also, even the quasars in the high-redshift () faint sub-sample of Fan et al. (2001b) are quite massive ().
Kolmogorov-Smirnov tests confirm the apparent similarity seen in Figure 1 of the distributions in mass, luminosity, and Eddington ratio for all high-redshift samples (§ 3.3), including the “color-selected sample” of Fan et al. (2001b). The low-redshift quasars of the BQS span a larger range in each of these parameters simply because less-luminous quasars are still bright and easily detectable at low redshift.
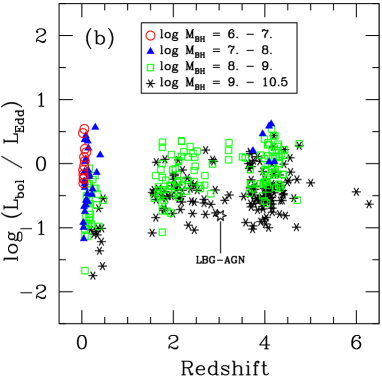
Figure 1c suggests that in every redshift range there is a significant number of quasars with greater than unity. However, given the uncertainties in both and bolometric corrections, the reality of super-Eddington luminosities is unclear. Nevertheless, barring some large systematic error, all the values of are high, almost always greater than 0.1. This is not surprising given that we are sampling the brightest quasars in every redshift bin. Indeed, the lower end of the distribution in is due to survey flux limits and the apparent upper envelope to the C iv line width for a given luminosity (Fig 2b). The upper end of the distribution is truncated by the lack of objects with very high luminosity and/or emission lines narrower than about 2000 km s-1. Since active nuclei are commonly identified by their broad lines, it is not clear whether the discovery surveys with their selection criteria (and crude spectral resolution in early surveys) would be able to identify quasars with such narrow lines; even the SDSS quasar identification is not well-defined at present (Richards et al. 2001). The upper cutoff in is however real (see e.g., § 4.2).
4.2 Redshift Distributions
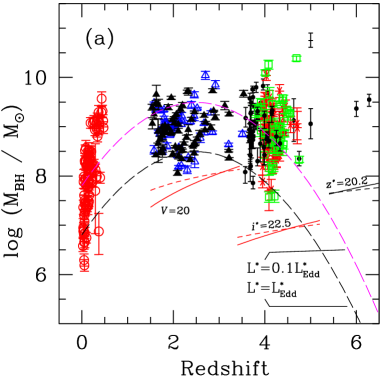
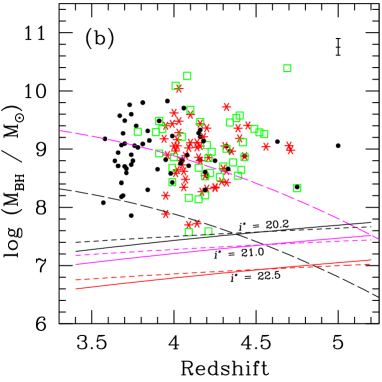
Figures 3 and 4 show how and distribute with redshift. The curve segments are lower limits imposed by the survey limits or sample selection. In Figures 5 and 6 the , , and distributions with redshift are shown binned in different ways and with measurement uncertainties omitted for clarity.
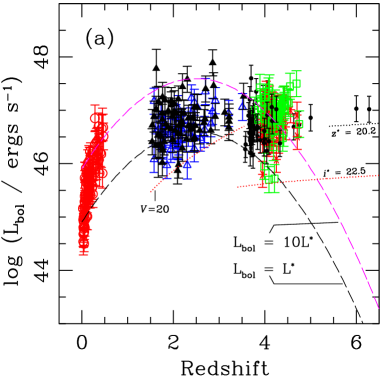
The lower envelope of the observed values is easily explained by the survey or selection flux limits (Fig. 3). The bolometric luminosity corresponding to and 10 and their evolutionary tracks [i.e., and ] are shown for reference, where is the characteristic (break) luminosity of the quasar luminosity function, . For simplicity, the parameterization of Boyle et al. (2000) is adopted here, namely:
| (5) |
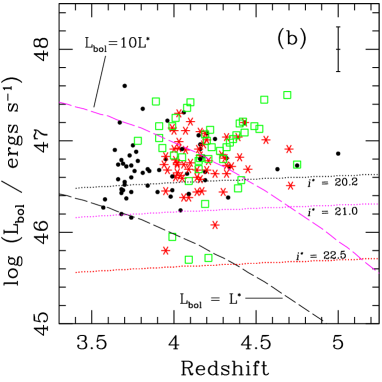
where is the broad-band luminosity, and and are the slopes of the faint and bright end of the luminosity function, respectively. The values were computed as . The bolometric correction factor to was determined from the updated quasar SED described in § 2. The and its evolution666The luminosity function determined by Pei (1995) is consistent with that of Boyle et al. (2000) within the parameter uncertainties. was determined for 6000 quasars by Boyle et al. (2000) between redshifts zero and 2.3 from the LBQS and 2dF Quasar Redshift Survey data. Boyle et al. extrapolate to based on the fit to the data at lower redshifts. Figure 3 shows that the quasars studied here are very luminous: most are well above several (see e.g., Fig. 3b), assuming can be trusted for short extrapolations (from 2.3). The extrapolation to is much more uncertain, but, evidently, the most distant quasars detected are unusually bright. Also, the BQS quasars are clearly among the most luminous quasars at low redshift, as is well known, while the quasars are, on average, quasars or slightly more luminous. A preliminary analysis of the Large Bright Quasar Survey (LBQS) data from Forster et al. (2001) of quasars at suggests that the brightest of these quasars may exceed ergs s-1 and . If indeed so, the relatively lower values of the intermediate- sample (see Fig. 3) are consistent with the fact that these quasars were intentionally selected not to be the brightest at a given (Vestergaard 2000).
One possible explanation for the high luminosities is gravitational lensing by foreground galaxies too faint to be detected at present. The lensing fraction is strongly dependent on the slope () of the bright end of the optical luminosity function at (e.g., Wyithe & Loeb 2002). Fan et al. (2001a) determined the luminosity function for the well-defined “color-selected sample” of bright quasars at and find a slope of = 2.58, somewhat flatter than the slope, , of the bright end of the luminosity function (Boyle et al. 2000). This shows that the “color-selected sample” contains a larger fraction of the most luminous quasars, in accordance with the findings here. More importantly, this bright end slope allows a handle on the lensing fraction at high-, assuming the “color-selected sample” is representative of bright quasars. Wyithe & Loeb (2002) find a relatively high probability () that the luminosity of quasars is enhanced by lensing: 7% 30% for , respectively. The luminosities of the quasars are not expected to be significantly lensed: 4% 13%. These estimates show that very few of the high- quasars studied here are likely to be gravitationally lensed. Even if as many as 13% of the most luminous quasars are lensed, the average of the remaining quasars is still well above the predicted : ergs s-1 = 9.4 . Evidently, with the current survey flux limits, these high- quasar samples only probe the brightest tail of the quasars possibly present at . Future surveys need to go much deeper777 An extrapolation of shows that 1.0 (0.01) quasars are expected to have broad-band magnitudes: 25 (30) mag at and 29 (31.5) mag at . to properly test whether or not the luminosity function is significantly different than that at lower redshifts.
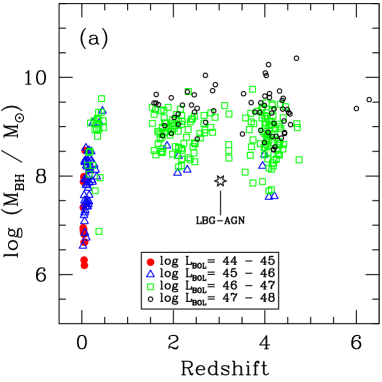
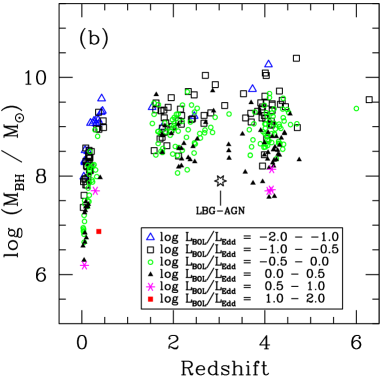
Figure 4 shows that even the high- black-hole masses are quite large888 The mass estimates of the highest redshift (=6.41) quasar SDSS J114816.64525150.3 based on both Mg ii (Willott et al. 2003a) and C iv line widths (Barth et al. 2003) are in agreement (but note that individual mass estimates based on scaling relationships may be uncertain by a factor 10 (Paper I); the factor 3 uncertainty is valid for statistical samples only). and, in particular, do not show a decrease relative to the masses of the intermediate- quasar sample. However, the masses of the LBQS quasars may reach 1010, as noted earlier. Thus, a slight mass decrease may exist at ; the apparent upper envelope in the quasar masses at furthermore suggests this. Also shown in Figure 4 is the relative position of (), determined from the evolution of assuming . Since it is unclear whether all quasars radiate at the Eddington luminosity, the relative location of (), computed assuming , is also shown for reference. If = is valid, most of the quasars across the observed redshift range are very massive, reaching 10 15 . This is true even at the lowest redshifts (). Regardless of the true value of (), the quasars stand out as being extremely massive. For most quasars, = 0.1 may be reasonable, given previous estimates at lower redshifts (e.g., Wandel et al. 1999; Awaki et al. 2001; Czerny et al. 2001; but see also Collin et al. 2002). In this case, the BQS masses distribute almost evenly about the predicted value of , with a range of a factor 10 in each direction. Also, the values of for the quasars are mostly in the range 0.1 1 . Furthermore, if the () extrapolation to is reasonable, then the quasars have masses in the range 0.1 10 , similar to the BQS. The average observed Eddington ratio is, however, well above 0.1 (Fig. 1) — possibly closer to a value of 1 for the highest redshift quasars — with a typical value of 0.4 0.5 at . Adopting this ratio would make fall about halfway between the two () curves shown in Figure 4, making the quasars on average and the quasars as massive as 10 15 or even larger. Note that the absence of much less massive quasars, especially at high-, is mainly due to the selection and survey limits (Figure 4). Also, the high values are not due to severe overestimates caused by the adopted method to estimate (§ 5.1).
The very detection of the quasars means they are very luminous, as already discussed. But, must they also necessarily be massive? Rejecting the possibility that they are grossly super-Eddington, the obvious possibilities for artificially enhancing their estimates are (a) gravitational lensing, and (b) relativistic beaming. Gravitational lensing can account for some, but certainly not all quasars (30% at the very most), as argued above. The high- quasars are also not likely to be strongly beamed, judging by the similar appearance of their UV spectra to those of low- AGNs: beamed sources (BL Lac and OVVs) have very weak or absent emission lines (e.g., Peterson 1997). The equivalent width () of the UV lines in the high- quasars are not much different from those of low- AGNs. The average (Ly N v) and (C iv) in the Constantin et al. sample are 80Å and 40Å, respectively, while Fan et al. (2001b) find a mean (Ly N v) of 69Å for the “color-selected sample”. These compare very well with the typical s in low- AGNs: (Ly N v) = 75Å and (C iv) = 35Å (Peterson 1997). In fact, the s at low and high- are remarkably similar considering more luminous quasars are expected to have lower line (the Baldwin effect; e.g., Baldwin 1977). So to conclude, since the quasars are rather luminous, they must be massive as well. Additionally, the large emission-line widths (Figure 2) also indicate the black-hole masses are large.
Figure 5 shows that even lower-luminosity (ergs s-1) quasars can have relatively high masses, (the BQS at ). The tendency for to increase with decreasing is particularly prominent for the objects (Fig. 5b and 6b). Notably, even the most massive quasars also have high Eddington ratios (Fig. 6b). Also, a large fraction of the quasars appear to have super-Eddington luminosities (Figs. 5b and 6b). For the distant () quasars, there is considerable overlap in luminosity for the two highest mass bins (Fig. 6a) and visa-versa (Fig. 5a).
4.3 Overview of Results
A number of conclusions can immediately be made based on the distributions described above.
(1) At low redshift (), the brightest quasars, represented by the BQS quasars, exhibit a clear upper envelope in (Fig. 4 and 5) and (Fig. 3 and 6) which increases with redshift. Although such a sharp upper cutoff is not seen for the more distant quasars there does appear to be a real physical ceiling of and ergs s-1 at all redshifts. The ratio evenly covers the same approximate range ( ) at all redshifts (Figs. 1 and 6). The lower envelopes of , , and for all the quasars are due to the original discovery surveys being flux limited.
(2) The high- quasars have relatively high values of and . The central masses of the highest redshift () quasars do not drop significantly compared to the intermediate redshift () objects. However, the quasars were not selected to be the brightest, and therefore the most massive, at this redshift (Figs. 1, 3, and 4). A preliminary analysis of the LBQS sample suggests that a mild decrease in, at least, may exist at , as the brightest LBQS quasars may exceed and ergs s-1. It is particularly striking that the most distant quasars at have similarly high as at lower redshifts. These quasars do have a high probability (30%) of being gravitationally lensed (Wyithe & Loeb 2002). But if they are not lensed, the known quasars must be very massive. It has been argued that such massive quasars must necessarily reside in massive dark matter halos and be associated with very rare, high density peaks in the dark matter distribution at that epoch (e.g., Efstathiou & Rees 1988; Fan et al. 2001c; Volonteri et al. 2002).
(3) Most of the objects have masses above (), even at the lowest redshifts where is reliable. Given the mean at , it follows that the actual in Fig. 4 probably lies between the two dashed curves. This makes the quasar masses of the intermediate- sample on average and makes most of the quasars 10 15 , if the luminosity function can be reasonably extrapolated to .
5 Discussion
It was argued in section 2 that black-hole masses of distant AGNs and quasars can be predicted using their broad-line widths, their luminosities, and scaling relationships. For a statistical sample of objects this method appears accurate to within a factor of about 3. When this method is applied to the quasar samples described in § 3 it is concluded that quasars at have black-hole masses of , with an average of about (§ 4). In spite the fact that the currently known high- quasars represent only the upper end of the luminosity function (e.g., Fan et al. 2001a) (and presumably the upper end of the mass function), it is important to appreciate that black-hole masses as large as a few times are capable of forming by . Certainly, the high luminosities of these quasars suggest this must be the case (Fan et al. 2001c), but the present results provide evidence of high black-hole masses independently of arguments based only on the Eddington limit.
It is currently unknown how these massive black holes form or on what time scale. As argued by Fan et al. (2001c), it takes 20()-1 -folding times to grow a 10 black hole with radiative efficiency of 100% to a mass of . As this time scale is within, although close to, the age of the Universe at for a cosmology of = 65 , = 0.35, and = 0.65, this growth scenario is not ruled out by its time scale.
These conclusions depend on whether or not the scaling relations, defined for nearby AGNs and quasars, can be applied to luminous and very distant quasars. The main justifying reason is that the currently available data at radio, UV, and X-ray wavelengths show no clear evidence that the properties of quasars are any different than those of other luminous quasars known at lower redshift. First, quasar rest-frame UV spectra are very similar at all redshifts up to at least (e.g., Constantin et al. 2002; Dietrich et al. 2002a; barring luminosity effects such as the Baldwin effect). Also, as discussed in § 4, the values and distributions of , , and are also similar, especially at . Second, at radio energies, the SDSS quasars exhibit similar properties (10% fractional occurrence and similar radio spectra) as known for quasars (Carilli et al. 2001a; Stern et al. 2000; see Petric et al. 2003 for corroborating results for quasars). Moreover, the X-ray properties of high- quasars (e.g., the optical-UV to X-ray slope, , and X-ray slope, ) are probably not much different from those of their lower- cousins. Brandt et al. (2002) and Mathur, Wilkes, & Ghosh (2002) independently concluded this for the values of three quasars. Bechtold et al. (2003), on the contrary, argue that quasars have relatively steeper values ( with an average of ) based on Chandra data of 17 optically selected, radio-quiet () quasars, but their values are slightly overestimated999 Bechtold et al. (2003) overestimate the values by adopting a UV slope of 0.3. Fan et al. (2001b) find that an average slope of 0.8 is more appropriate for quasars. For example, for two of the objects studied by Bechtold et al. the UV slopes are measured by Fan et al. and the resulting are 1.47 and 1.48, much closer to the average of 1.43 measured at lower redshifts (Elvis et al. 2002; note that the radio-quiet quasars observed with ROSAT have ; Yuan et al. 1998). It may thus not be the norm that high-redshift quasars have very steep optical-X-ray slopes; but see Vignali et al. 2003).. Also, the slope extends to flatter values () when quasars from other studies are included (Fig. 1 by Bechtold et al. ), similar to average values (1.55 ) for radio-quiet quasars (Yuan et al. 1998). However, Vignali et al. (2003) also report steeper values for their quasars, but argue it is a luminosity effect. Nevertheless, Vignali et al. find the X-ray and broad-band spectra similar to those of low- quasars. Bechtold et al. also determine X-ray slopes of (1.5) for their () quasars. These slopes are somewhat flatter than the steepest slopes of 3 to 4 observed for ROSAT quasars. However, this apparent flattening of with redshift is most likely a selection effect because different energy ranges of the X-ray spectrum are observed at different redshift, as also suggested by Bechtold et al. (2003). In conclusion, the apparent similar properties across the SED of distant quasars () indicate that the properties of the central engine of the high- luminous quasars are sufficiently similar that the scaling relationships can used to estimate black-hole masses of these objects. The efficacy of this method is discussed in more detail in § 5.1.
The second key result presented in § 4, is the clear presence of a ceiling to the and values at all redshifts. From redshift zero to 0.6, the maximum values of all three parameters increase to a certain value and then level off at higher redshifts. The upper envelopes in and are genuine, since none of the sample selections impose upper limits in the source brightness. Also, there are no apparent selection biases preventing a detection of very broad-lined, bright quasars, with the possible exception of the quasars (§ 4). The apparent lack of very luminous and very massive quasars may be due to either or both of the following explanations. First, very luminous (massive) quasars are expected to be very rare, given the steep decline of the upper end of the luminosity (mass) function. Second, the above-mentioned ceilings may be due to some physical limit to black hole growth. Possible causes for such a maximum sustainable mass and luminosity include: (a) limits in the dark matter gravitational potential, (b) limits in the fuel supply rate, (c) transition of accretion mode or timescale, and (d) changing accretion disk (i.e., emission) properties with black-hole growth (e.g., Caditz, Petrosian, & Wandel 1991; Yi 1996; Kauffmann & Haehnelt 2000).
Two recent studies (Bechtold et al. 2003; Netzer 2003) report quasar masses at high- ( and , respectively) reaching or exceeding in apparent conflict with the above conclusion. However, these values are not inconsistent with the current analysis once differences in cosmology and statistical uncertainties are taken into account, as explained in the following. Firstly, Netzer (2003) finds a maximum mass of 10.4 dex assuming an slope of 0.7 and = 70 , , and . For this cosmology, his values are about a factor 2 (or dex) higher than for the cosmology adopted here ( = 75 , q0 = 0.5, and = 0). Combining this with the probable uncertainty in his mass values of 0.6 dex, given a measurement error of dex and a statistical uncertainty in the method of 0.5 dex (Paper I), the highest mass values of Netzer’s sample and those analyzed here are statistically consistent. An important point to keep in mind is that individual values can be in error by as much as a factor 10. The fraction (%) of quasars in Netzer’s sample with is also within the expected fraction (10%) of objects for which the values may be off by 1 dex or more (Paper I). Secondly, the maximum value (10.7 dex) reported by Bechtold et al. (2003) for = 50 , q0 = 0.5, and = 0, corresponds to 10.45 dex in the current cosmology. Although, Bechtold et al. do not quote their errors, the uncertainties in their values are presumably as large as or even larger101010This is owing to their crude correction of their FWHM(C iv) values to FWHM(H ), so to apply the optical scaling relationship of Kaspi et al. (2000) to obtain central masses, and their adoption of rather flat UV slopes (0.3) relative to the steep slopes () measured by Fan et al. (2001b) for their representative quasars (see footnote above). than those of Netzer (2003), and, hence, their maximum value is similarly consistent with the upper boundary , seen in the current study, to within the errors.
Netzer (2003) also claims that is inconsistent with the locally defined relationship ( is the stellar velocity dispersion in the host galaxy bulge), since the implied km s-1 is not observed locally. As Netzer notes, either (1) the values are overestimated, because, for example, the relationship does not extrapolate to high- quasars, or (2) the relationship changes with redshift. It is argued in § 5.1 that the relationship is not likely to be misleading and that the scaling relationships used here yield reasonable estimates to within a factor 4. Furthermore, the lack of local black-holes with masses does not mean that the large values inferred from the scaling relationships are strongly overestimated. The reason is that in addition to a possible evolution of the relationship and the statistical uncertainty in the estimate, the lack of local black-holes with masses can possibly be explained by the relatively small volume probed in the local Universe: for the comoving space density of luminous, massive () quasars at of Gpc-3 (Vestergaard & Osmer, in preparation), a volume approximately 20 times larger than that currently probed locally (100 Mpc) is needed to detect one such massive quiescent black-hole.
5.1 Reliability of the Mass Estimates for High Redshift Quasars
It is a serious concern whether the scaling relationship, defined for a representative sample of nearby AGNs and quasars, can rightfully be applied to luminous, distant quasars. Specifically, can extension of this relationship cause the masses of the distant quasars () to be severely overestimated? Netzer (2003) also points out that the high masses he finds at appear inconsistent with the local relationship. In this section, the efficacy of the scaling relationships for luminous, distant quasars is discussed. It is argued that application of the scaling relationships to such quasars is valid, owing mainly to the similarity of quasar spectra across the known redshift and luminosity ranges. In particular, the scaling relation is unlikely to be inaccurate by a factor 4 in the mass.
The mass estimates will obviously be misleading if the assumptions made when extending the scaling relationships beyond the nearby AGNs break down. The two assumptions for FWHM(C iv)2 (1350Å) are: (1) that the size, , of the (C iv) emitting region in the broad line region – i.e., its distance from the continuum source – can be estimated reliably from the continuum luminosity, (1350Å), and (2) that the line width is a reasonable proxy for the gravity-dominated velocity dispersion of the line-emitting gas. The critical issues are therefore: (a) whether or not the relationship is valid at higher redshift and for more luminous quasars than the sample for which it was defined, and (b) whether or not the C iv emission gas is virialized or, for example, the C iv profile has strong blue asymmetries which may be a sign of BLR outflows as suggested for the narrow-line Seyfert 1 (NLS1) galaxies (e.g., Leighly 2000). Each issue is addressed in turn below.
First, the relationship is not likely to be much different for the more luminous and more distant AGNs. The reasons are twofold: (1) the relationship is not extrapolated very far in luminosity: for the highest (1350Å) values of 47.4 dex, the relationship is extrapolated by less than 1.5 dex, a small fraction of the luminosity range of 4 dex, over which the relationship is defined ((5100Å)/ergs s-1), and (2) AGN and quasar spectra look very similar at all redshifts and luminosities considered here, i.e., line flux ratios, line equivalent widths, and SEDs are all similar (e.g., Elvis et al. 1994; Kuhn et al. 2001; Constantin et al. 2002; Dietrich et al. 2002a, 2002b; see also § 2). Specifically, if the relationship does not apply to luminous, distant quasars, the spectra of these objects would look somewhat different than they do. This can be quantified by photoionization modeling. In essence, if the scaling relationship (eq. 4) results in a mass overestimate of, for example, a factor 10 for a quasar with ergs s-1, the virial theorem shows that the Ly and C iv emission lines are emitted so close (33 light-days) to the ionizing source that these lines are produced very inefficiently, and, in particular, C iii] emission cannot be generated. But, the presence of C iii] in all spectra of quasars (at least up to ; Dietrich et al. 2002a) confirms the existence of low-density BLR gas subject to a lower ionizing flux from which Ly and C iv are also much more efficiently emitted111111These conclusions are based on the line emission resulting from gas with a range of column densities subject to the ionizing flux from a source with ergs s-1 as quantified by the photoionization grids of Korista et al. (1997).: this gas will necessarily be located at a greater distance from the ionizing source, close to the distance inferred from the luminosity.
Second, there is no evidence that the kinematics of the BLR in high- AGNs are not dominated by gravity. This conclusion is based on the following 3 arguments.
-
1.
Most, if not all, of the BLR gas121212This has so far been established for the following emission lines: Si iv 1400, C iv 1549, He ii 1640, C iii] 1908, H 4861, He ii 4686 (see e.g., Peterson & Wandel 1999). is in virial motion around the central source, including the high-ionization UV lines: all the AGNs with suitable multiple emission line measurements demonstrate a robust virial relationship between their line widths and variability time lags (Peterson & Wandel 1999, 2000; Onken & Peterson 2002); while only four AGNs are testable so far, the general similarity of AGN spectra (i.e., line shape, line widths, and variability properties) argues that this relationship extends to most AGNs.
-
2.
The distribution of C iv line widths in spectra of distant, luminous quasars is similar to that for nearby AGNs (typical values 4500km s-1 with a range from 2000 10000km s-1 in FWHM), including those for which the scaling relations are calibrated. Also, the C iv widths of the nearby BQS quasars are consistent with their H line widths, assuming virial BLR kinematics and that H is emitted twice as far from the central source as C iv, as established for three of the four AGNs discussed in item 1 (see also Korista et al. 1995; see comment below on the one exception). Furthermore, the similar FWHM(C iv) distributions, where most are narrower than 8000 km s-1 (e.g., Figure 2), argue that the unknown, but possible, contribution to single-epoch line widths from non-variable optically thin emission (Shields, Ferland, & Peterson 1995; Peterson 1997) is highly unlikely to make FWHM(C iv) in error by a factor 2; such an error translates to a mass uncertainty of a factor 4, comparable to the statistical uncertainty (§ 2).
-
3.
Outflow of the BLR line-emitting gas is not important, at least for the quasars considered here. This is supported by two facts: (i) none of the C iv profiles of the quasars (§ 3.2, § 3.3), and most quasars in general, clearly131313Some spectra are noisy and the reality of such a prominent triangular line shape is difficult to discern. resemble the broad, triangular, blue asymmetric C iv profiles of the high luminosity NLS1s; those C iv profiles have been argued to signify strongly outflowing high-ionization line-emitting gas (e.g., Leighly 2000), as NLS1s are very luminous for their , and (ii) while a small fraction (20%) of the C iv profiles in the high- sample (§ 3.3) show weak, blue-ward asymmetries (mostly suspected due to broad, blended N iv]1486), those quasars do not have much larger masses and luminosities than the remaining quasars: a conservative estimate is an 0.2 dex increase on average, dominated by the lower-quality spectra of the Anderson et al. sample; the ‘asymmetric subset’ of the Constantin et al. and Fan et al. quasars exhibit average deviations of 0.1 dex. Also, the C iv profiles of the quasars are not typically asymmetric, and any asymmetries are restricted to the very base of the profile and do not affect FWHM. Moreover, the strongest asymmetries do not extend blueward (Vestergaard 2000; Vestergaard, Wilkes, & Barthel 2000).
In conclusion, blue asymmetries and UV outflows are generally not a concern for the estimates of quasars. Nonetheless, extreme care should be exercised when using the C iv line width to estimate the mass when signs of significant outflows are present. For this reason, mass estimates based on C iv are not well suited for the most luminous NLS1s.
It is important to emphasize that although all AGNs so far tested show the BLR is virialized (i.e., the virial product is constant for all emission lines measured), for one object (3C 390.3) C iv is narrower than H and has a larger lag in contrast to the other three objects. This behavior is not understood, but 3C 390.3 may have an unusual BLR structure as it is the only broad-line radio-galaxy with monitoring data and it, moreover, has double-peaked Balmer lines (Peterson & Wandel 2000). Nevertheless, it is very important for the general applicability of the scaling relations that future studies address this issue.
5.2 Do Black Holes “Mature” Before Their Host Galaxies Do?
Given that black holes with large masses appear as early as and given the intimate connection between the formation of galaxy bulges and their central, supermassive black holes inferred from the relationship, the question naturally arises whether or not this close connection also exists at high redshift. Specifically, do these “mature” black holes (i.e., those that have reached, say, ) also reside in “mature” host galaxies (i.e., virialized systems with the majority of their stars already formed) with aged (1 Gyr) stellar populations? Among the currently available data on high- AGN host galaxies, there is considerable circumstantial evidence that massive active black holes may, in fact, reside in galaxies that are not fully relaxed, virialized systems and where many of the stars are yet to be formed. This is based on (a) the inferred high star-formation rates (SFRs) from the existing large masses of cool dust, (b) the presence of significant amounts of molecular gas in some sources, (c) the presence of large-scale young starbursts in at least one well-studied radio-galaxy with a large dust mass, (d) the strikingly different morphology of host galaxies of high- radio-quiet quasars and radio galaxies compared to their lower- cousins, and (e) the presence of massive, active black-holes in small, young galaxies at . Each issue is discussed in turn below.
5.2.1 The Evidence
Massive Star Formation in High- Quasars
High- AGN host galaxies are apparently experiencing massive, large-scale star formation: the far-IR/sub-mm SEDs of quasars (e.g., Benford et al. 1999; Carilli, Menten, & Yun 1999; Carilli et al. 2001a) are similar to those of ultra-luminous IR galaxies (ULIRGs) and starburst galaxies (e.g., Downes & Solomon 1998; Genzel et al. 1998; Rowan-Robinson 2000; Klaas et al. 2001). ULIRGs are dominated by extreme rates of star formation (1000 yr-1) that yield unique far-IR/sub-mm SEDs, which are independent of whether or not a central AGN is present (e.g., Downes & Solomon 1998; Klaas et al. 2001). The rather cool ( 100 K; typically K) starburst-heated dust dominates the far-IR emission (e.g., Rowan-Robinson 2000; Dunne et al. 2000; Klaas et al. 2001), but AGN-heated dust ( 100 K) emits in the near-IR, shortward of m (e.g., Wilkes et al. 1999b; van Bemmel & Dullemond 2003; Figure 8a by Farrah et al. 2003). Large amounts () of cool ( K) dust are commonly inferred141414The inferred dust masses are, in fact, lower limits as cold dust (30 K) is a poor emitter (e.g., Omont et al. 2001; Chapman et al. 2003); there is probably a factor 3 more gas (e.g., Dunne et al. 2000). from the restframe far-IR/sub-mm emission from quasars (e.g., Benford et al. 1999; Carilli et al. 2001a; Omont et al. 2001; Priddey & McMahon 2001; Isaak et al. 2002). Large dust masses are often taken to imply high SFRs, 1000 2000 yr-1 (Benford et al. 1999; Carilli et al. 1999, 2000, 2001b, 2003); such high SFRs are even inferred for the undetected sources (Isaak et al. 2002). Also, non-thermal radio emission contributes little to the shape of the cm to sub-mm SED, confirming its origin in massive star formation (Carilli et al. 2000, 2001a, 2001b; Yun et al. 2000).
The far-IR properties of the luminous SDSS quasars studied here appear very similar to those of other quasars with far-IR data and to far-IR selected AGNs. Most of them have radio to far-IR SEDs consistent with starburst heating of large dust masses (Carilli et al. 2001a), and the inferred dust masses () and SFRs are similar to other quasars: Figure 7 shows that for the subset of 30 quasars with and estimates, the 13 quasars detected at 1.2 mm all have . Even for the undetected quasars, the upper limits cannot rule out the existence of SFRs of order 300 700 yr-1.
This line of argument is not without caveats. For example, it can be argued (e.g., Sanders et al. 1989; Kuraszkiewicz et al. 2003) that the IR SEDs of nearby quasars can be explained purely by AGN heating, although this explanation is not universally accepted (e.g., Farrah et al. 2003; Klaas et al. 2001). Nevertheless, no correlation is observed between quasar optical-UV luminosity and far-IR luminosity, as otherwise expected if AGN heating dominates the cooler dust (e.g., McMahon et al. 1999; Omont et al. 2001; Isaak et al. 2002; Priddey et al. 2003). Also, Archibald et al. (2002) argue that a high dust mass may indicate a galaxy is in a late starforming phase (75% complete), as discussed below.
Molecular Gas.
Huge amounts of cold molecular gas () are present in far-IR luminous sources. This is (a) determined from CO emission line measurements (Ohta et al. 1996; Omont et al. 1996; Guilloteau et al. 1999; Carilli et al. 1999, 2002a, 2002b; Papadopoulos et al. 2000), and (b) inferred from the dust masses and typical dust-to-gas ratios obtained from low- starbursts (e.g., Sanders, Scoville, & Soifer 1991; Dunne et al. 2000). Such vast gas reservoirs show that large amounts of stars are yet to be formed (e.g., Solomon et al. 1997; Downes & Solomon 1998), and are evidence for ongoing massive star formation, especially when combined with large masses of cool dust (e.g., Ohta et al. 1996; Ivison et al. 1998; Frayer et al. 1999; Papadopoulos et al. 2000; Carilli et al. 2002a, 2002c). In some cases, the cold gas clearly constitutes a significant fraction of the dynamical mass in the system, emphasizing the rather young nature of the galaxy (e.g., Ohta et al. 1996; Guilloteau et al. 1999; Solomon et al. 1997; Downes & Solomon 1998; Tacconi et al. 1999). For some high- sources, the sub-mm emission is (a) clearly separated (tens of kpc) from the AGN nucleus, and/or is (b) distinctly extended (e.g., Papadopoulos et al. 2000; Omont et al. 2001; Isaak et al. 2002; Carilli et al. 2001a, 2002b, 2003). This is strongly suggestive of galactic-scale starforming regions and renders an AGN origin less likely (Carilli et al. 2003). Furthermore, when CO observations of high- sources are conclusive, the high masses of cold gas inferred from dust mass estimates are confirmed (Hughes et al. 1993; Ohta et al. 1996; Omont et al. 1996; Papadopoulos et al. 2000). Non-detections of CO line emission, however, do not necessarily rule out a young starburst interpretation because the observations are still not very sensitive151515The success-rate of CO detection is currently relatively low due to sensitivity limits of the detectors and the relatively narrow accessible band widths compared to the sometimes broad line widths (Ohta et al. 1996; Papadopoulos et al. 2000; Omont 2003). Also, if the molecular gas is too cold, the CO line transitions are very weak..
Young Stellar Populations.
For one far-IR/sub-mm luminous high- AGN, the radio galaxy 4C 41.17, stellar populations synthesis modeling has established the presence of large-scale young starbursts with ages in the range 0.01 Gyr to 0.4 Gyr with a most probable age of 0.07 Gyr (Dey et al. 1997; Dey 1999). This is also important because it confirms the existence of starburst activity, expected based on the strong far-IR emission alone. Although it is difficult to generalize based on one object, it is pertinent to emphasize that such analysis is very difficult to perform for most high- AGNs, given the strong nuclear glare in quasars and the faintness of galaxies at high-. Nevertheless, it is important for future studies to establish whether or not high- far-IR luminous AGNs in general have young starburst activity.
Archibald et al. (2002) infer starburst ages of 0.5 0.8 Gyr for 4C 41.17 from a monochromatic luminosity ratio and their models of dust production and depletion with time in a young galaxy, and conclude the galaxy is in a late starforming phase. These ages are clearly at odds with the results of the more sophisticated age determination discussed above. Further developments in this area seem necessary to resolve these apparent inconsistencies. More importantly, the measured dust mass of 4C 41.17 is also consistent with a starburst age in the range 0.075 Gyr to 0.095 Gyr (Fig. 1 by Archibald et al. 2002), in good agreement with the results of Dey (1999). In conclusion, while dust contents alone is an inaccurate measure of starburst ages, large dust masses are not uniquely tied to 1 Gyr old galaxies but also appear in galaxies with starbursts as young as 0.04 Gyr (for ; Fig. 1 by Archibald et al. 2002).
It is therefore an intriguing possibility that some high- AGN host galaxies may have rather young stellar populations. However, a comparison with the restframe IR emission is necessary to determine the extent to which these young stars dominate the total stellar mass in place at that epoch. The observed apparent extension of the relation, defined for radio galaxies (Lily & Longair 1984), to radio galaxies and quasars is sometimes used to argue for somewhat old stellar populations in their host galaxies. However, it is important to appreciate that the increasing scatter in the observed relationship at is also consistent with galaxies comprising mainly young stellar populations forming at (De Breuck et al. 2002): the stellar mass in the host galaxies (quantified by the -band magnitude) is too low in many cases to place all high- radio-galaxies on the relation with insignificant scatter. Also, it has been argued that the nature of proto-galaxies or young, less massive galaxies may also conspire to fall along the relation at (Eales & Rawlings 1993; Willott et al. 2003b). Hence, it seems at least plausible that a good fraction of high- host galaxies may be relatively young, even if this interpretation is not universally accepted.
Host Galaxy Morphology
While quasar host galaxies appear fully assembled by , AGN host galaxy properties become increasingly more difficult to quantify at (Kukula et al. 2001). Practically, radio galaxies are the only AGNs we can currently study beyond , owing to the lack of nuclear glare that affects optical observations of quasar hosts. Radio-galaxy hosts do not appear fully assembled and dynamically relaxed. Specifically, in contrast to their lower- cousins with mostly single, smooth components, radio galaxies display very clumpy structure: multiple, small star-forming components are embedded in large-scale (50 kpc) faint emission, indicative of galactic systems in early stages of assembly (e.g., Graham et al. 1994; van Breugel et al. 1998; Pentericci et al. 1999, 2001; Papadopoulos et al. 2000). Optically obscured radio galaxies also appear to be in an early stage of formation (Reuland et al. 2003).
For high- radio-quiet quasar hosts, the best-quality imaging data available are likely those from NICMOS HST studies of sources (Ridgway et al. 2001; Kukula et al. 2001). In contrast to radio-galaxy hosts, these are relatively structureless, single components. Also, at , radio-quiet hosts are often more compact (scale-lengths 4 kpc and 2.3 kpc on average; Ridgway et al. 2001) than (a) radio-loud hosts at that epoch (scale-lengths 11 18 kpc; e.g., Best et al. 1998; Kukula et al. 2001; Ridgway et al. 2001), and than (b) quasar hosts at (mean scale-lengths of 8.2 kpc; Bahcall et al. 1997; McLure et al. 1999). Moreover, the hosts of radio-quiet quasars are apparently rather young: Ridgway et al. find the ( mag) radio-quiet quasar hosts contain only 10% 20% of their final stellar mass. A caveat is that the Ridgway et al. results may not reflect the properties of the magnitude more luminous radio-quiet quasars observed at , but deep imaging of radio-quiet quasar hosts is currently unavailable.
![[Uncaptioned image]](/html/astro-ph/0309521/assets/x14.png)
Figure 7: Distribution of inferred star formation rate (SFR) and mass of dust with estimated black-hole mass for a subset of the SDSS quasars analyzed here. The far-IR emission emitted by the cool dust was observed by Carilli et al. (2001a). Detections at 1.2 mm are shown as solid circles, while the open triangles denote upper limits. The dust masses and SFRs are here computed using the prescription of Omont et al. (2001). Specifically, SFR yr-1, where is the ratio between the starburst’s total luminosity and the far-IR luminosity, and is “a function of the present mass composition of the stellar population” (see Omont et al. for explanation) and has values in the range . Since starburst heating dominates the far-IR, 70% is assumed, and thus ; a fair estimate is yielding a lower limit on the SFR.
Can AGNs Occur in Young Galaxies?
Probably the most convincing evidence that relatively young galaxies at are capable of hosting massive, active black holes comes, somewhat surprisingly, from the distant, small-scaled, young, star-forming Lyman-break galaxies (LBGs; e.g., Steidel et al. 1996, 1999). The presence of an active black hole can be inferred for a tiny fraction (1%) of the 1000 LBGs detected in a survey at (Steidel et al. 2002) by the presence of broad emission lines in their rest-UV spectra. Specifically, the average spectrum of these broad-lined LBGs (Steidel et al. 2002) suggests that the mass of the black hole is typically rather high (): Table 1 lists estimates of the average values of , , and for different cosmologies and assumed dust extinction factors. Based on the uncorrected observed fluxes, the broad-lined LBGs have masses , lower than the higher luminosity quasars at any redshift beyond 1.5 (Figure 5), and they are about an order of magnitude less luminous (Figure 6). In spite of the large uncertainties, the inferred average value is intriguingly large considering (a) the relatively faint nature of both the nuclear and host galaxy emission, (b) the star-formation activity in the host galaxy (Steidel et al. 1996), and (c) the low stellar mass in the galaxies at : they typically only contain 10% 30% of their expected final stellar mass (Ridgway et al. 2001; Papovich et al. 2001). This suggests that the massive central black hole in the LBGs formed early and fast compared to the underlying stellar component.
| Extinction | (1350Å) | ||||
|---|---|---|---|---|---|
| Factor | (km s-1) | (erg s-1 Hz-1) | () | (erg s-1) | |
| Applied | Mpc-1) | ||||
| (1) | (2) | (3) | (4) | (5) | (6) |
| None | 50 | 29.540.02 | 8.20.1 | 45.560.2 | 0.200.10 |
| None | 75 | 29.190.02 | 7.90.1 | 45.200.2 | 0.150.08 |
| 50 | 50 | 31.240.02 | 9.40.1 | 47.260.2 | 0.640.32 |
| 50 | 75 | 30.890.02 | 9.10.1 | 46.900.2 | 0.500.25 |
a These estimates and measurement uncertainties are based on the composite spectrum of Steidel et al. (2002). While it is based on non-spectrophotometric data, it should after all be representative of the mean brightness level of these AGNs (C. Steidel, 2002, private communication), sufficient for the discussion here. Specifically, the typical C iv line width is measured (from the published plot and similarly to the other data analyzed here; § 3) to be 4670500 km s-1, and the 1350Å flux is (2.01) Jy. Since the composite spectrum shows evidence of some dust reddening, the , , and values were also computed after making a correction for dust extinction. Steidel et al. (2002) estimate an extinction factor of for their narrow-lined AGNs, but do not quote such a factor for the broad-lined AGNs among their LBGs. Therefore, the estimate for the narrow-lined AGNs were adopted here in attempts to bracket reality somewhat. In addition to the listed values of , is assumed.
A possible caveat is the uncertainty as to whether or not these faint LBG-type AGNs have similar SEDs to the bright quasars, on which both the and, especially, estimates are based. But among the lower-luminosity AGNs in the nearby Universe, only the faint, very low-luminosity LINERs display dramatically different SEDs (Ho 1999), mainly missing the “big blue bump” emission from the accretion disk. Seyfert galaxies, with which the LBGs with broad high-ionization lines may be most similar, display only minor SED differences in the optical-UV region compared to the more luminous quasars (e.g., Sanders et al. 1989; Elvis et al. 1994). Moreover, the relatively large C iv line widths (4670500 km s-1; very similar to the mean FWHM(C iv) of the luminous quasars) and line equivalent widths (see Figure 1 by Steidel et al. ) support a high central mass (as argued in § 4.2), in spite the faint nature of the galaxies. Therefore, the derived mass and luminosity values are crude, but probably not too unrealistic.
5.2.2 Discussion and Summary
Although largely circumstantial, the evidence presented above suggests that the massive, active black holes typically reside in relatively young (possibly dynamically unrelaxed) galaxies in their major star-forming phase. The implication is thus that the black hole either formed long before the stars in the galaxy or sometime during the first star-formation phase and thereafter grew so fast relative to the stellar mass that the nucleus shined long before the galaxy was fully formed. Rix et al. (2001) and Omont et al. (2001) independently reached similar conclusions based on different arguments. Rix et al. find radio-quiet quasars to have either higher nuclear luminosities or fainter host galaxies than lower- AGNs. They argue that the most plausible explanation is that the ratio of to the stellar mass increases with redshift. Omont et al. (2001) use millimeter data on quasars to argue for a higher black-hole growth rate relative to the surrounding bulge stellar component in the host galaxy at early epochs, consistent with the current study and that of Rix et al. Such an evolutionary scenario is consistent with some hierarchical models (e.g., Haehnelt & Rees 1993). Also, Silk & Rees (1998) suggest that early black-hole growth might in fact help regulate star formation in the host galaxy and its evolution. The overall conclusion reached here is thus that black holes likely reach maturity before the stellar populations in their host galaxies.
Archibald et al. (2002) claim that quasar activity is delayed 0.5 0.7 Gyr from the onset of star formation, during which 75% of the stars are formed, in apparent contradiction to the results presented above. However, Archibald et al. assume that black holes grow by accretion with a radiative efficiency () of 10%, while the value of and its constancy with time (or redshift) are highly uncertain. A lower radiative efficiency allows faster black-hole growth, and indeed, some recent estimates imply (Schirber & Bullock 2003). Furthermore, one can equally well expect black-hole formation and early mass growth to be very fast, as expected for the first generation of massive stars (e.g., Abel, Bryan, Norman 2002). Silk & Rees (1998) find it unlikely that the first black holes formed with ; in that case, it would take 0.2 Gyr to generate a black hole from a seed accreting with 10%, consistent with quasar activity existing in very young galaxies, as it takes 0.3 Gyr to form 50% of the stars in the galaxy (Archibald et al. 2002).
It is pertinent to re-emphasize that the presence of young starbursts in high- quasars cannot be inferred from their high dust content alone: a young evolving galaxy maintains a large dust mass () from 0.04 Gyr to 1.5 Gyr after the initial starburst (e.g., Archibald et al. 2002). But the combination of high masses of cool dust and cold (molecular) gas is much more convincing. Therefore, it is important for future investigations to study the cold gas contents in high- AGN host galaxies to test whether or not they are in the process of building up the majority of their stars. Furthermore, better coverage of the radio through near-IR SEDs of high- quasars is required to constrain the relative contributions of AGN and starburst heated dust for more accurate estimates of SFRs.
6 Conclusions
The main results of this work can be summarized as follows:
(1) It is confirmed that the high- quasars have central masses of at least a few times as previously estimated from their luminosities (Fan et al. 2001c). The masses, bolometric luminosities, and Eddington ratios of the quasars are very similar to those of their lower-redshift cousins. Relative to the evolved and the quasars are much more luminous and more massive than the typical quasars at . This assumes that the luminosity function, based on the Large Bright Quasar Survey and the 2-Degree Field Quasar Redshift Survey, and its extension to is reasonably reliable (§ 4.2).
(2) The scaling laws from which the black-hole mass is estimated are fully applicable to distant luminous quasars. This is argued based on the similarity of quasar and AGN spectral properties (line widths, line equivalent widths, line ratios, SEDs) at low and high redshift. In particular, photoionization models confirm that if the radius luminosity relationship does not extend to high- quasars, their spectra would look different than they do. Mass estimates, based on scaling relationships, are not likely inaccurate by a factor greater than 3 to 4 (§ 5.1) when applied to statistically significant samples.
(3) There is a real ceiling to the and values at all redshifts: and ergs s-1. These upper limits are consistent with the recent studies of Netzer (2003) and Bechtold et al. (2003) to within the uncertainties and differences in adopted cosmologies. Moreover, the large values at high- are not inconsistent with local values given the much smaller volume probed locally (§ 5).
(4) Black holes reach maturity (i.e., reach masses ) before their host galaxies: AGN host galaxies at 3 do not typically appear fully assembled, dynamically relaxed, and/or the majority of their stars are not formed or are somewhat evolved (1 Gyr). Since the evidence for relatively young quasar-host galaxies at is mostly indirect, this interpretation needs to be tested further. For example, complete coverage of the radio to IR SEDs of large representative samples of quasars will help provide improved constraints on the relative starburst and AGN contributions to the far-IR emission. Detailed studies confirming the correlation between large dust masses, large reservoirs of cold molecular gas, and high star-formation rates in larger quasar samples are also required. No doubt, the combination of SIRTF and the planned FIRST/Herschel and ALMA telescopes will play an important part in shedding light on these issues.
References
- Abel, Bryan, & Norman (2002) Abel, T., Bryan, G. L., & Norman, M. L. 2002, Science, 295, 93
- (2) Anderson, S. F. et al 2001, AJ, 122, 503
- Archibald et al. (2002) Archibald, E. N., Dunlop, J. S., Jimenez, R., Friaça, A. C. S., McLure, R. J., & Hughes, D. H. 2002, MNRAS, 336, 353
- Awaki, Terashima, Hayashida, & Sakano (2001) Awaki, H., Terashima, Y., Hayashida, K., & Sakano, M. 2001, PASJ, 53, 647
- Bahcall, Kirhakos, Saxe, & Schneider (1997) Bahcall, J. N., Kirhakos, S., Saxe, D. H., & Schneider, D. P. 1997, ApJ, 479, 642
- Baldwin (1977) Baldwin, J. A. 1977, ApJ, 214, 679
- (7) Barth, A. J., Martini, P., Nelson, C. H., Ho, L. C. 2003, preprint (astro-ph/0308005)
- (8) Barthel, P. D., Miley, G. K., Schilizzi, R. T, Lonsdale, C. J. 1988, A&AS, 73, 515
- (9) Barthel, P. D., Tytler, D. R., Thomson, B. 1990, A&AS, 82, 339
- Bechtold et al. (2003) Bechtold, J. et al. 2003, ApJ, 588, 119
- Benford et al. (1999) Benford, D. J., Cox, P., Omont, A., Phillips, T. G., & McMahon, R. G. 1999, ApJ, 518, L65
- Benson et al. (2002) Benson, A. J., Lacey, C. G., Baugh, C. M., Cole, S., & Frenk, C. S. 2002, MNRAS, 333, 156
- Best, Longair, & Roettgering (1998) Best, P. N., Longair, M. S., & Röttgering, H. J. A. 1998, MNRAS, 295, 549
- (14) Boroson, T. A., & Green, R. F. 1992, ApJS, 80, 109
- Boroson & Oke (1982) Boroson, T. A. & Oke, J. B. 1982, Nature, 296, 397
- Boroson, Oke, & Green (1982) Boroson, T. A., Oke, J. B., & Green, R. F. 1982, ApJ, 263, 32
- Boyle et al. (2000) Boyle, B. J., Shanks, T., Croom, S. M., Smith, R. J., Miller, L., Loaring, N., & Heymans, C. 2000, MNRAS, 317, 1014
- Brandt et al. (2002) Brandt, W. N. et al. 2002, ApJ, 569, L5
- Caditz, Petrosian, & Wandel (1991) Caditz, D. M., Petrosian, V., & Wandel, A. 1991, ApJ, 372, L63
- (20) Cardelli, J. A., Clayton, G. C., Mathis, J. S., 1989, ApJ, 345, 245
- Carilli, Menten, & Yun (1999) Carilli, C. L., Menten, K. M., & Yun, M. S. 1999, ApJ, 521, L25
- Carilli et al. (2000) Carilli, C. L. et al. 2000, ApJ, 533, L13
- Carilli et al. (2001a) Carilli, C. L. et al. 2001a, ApJ, 555, 625
- Carilli et al. (2001b) Carilli, C. L., Bertoldi, F., Omont, A., Cox, P., McMahon, R. G., & Isaak, K. G. 2001b, AJ, 122, 1679
- Carilli et al. (2002) Carilli, C. L. et al. 2002a, AJ, 123, 1838
- Carilli et al. (2002) Carilli, C. L. et al. 2002b, ApJ, 575, 145
- Carilli, Bertoldi, Menten, & Owen (2002) Carilli, C. L., Bertoldi, F., Menten, K., & Owen, F. 2002c, in Galaxy Evolution, Theory and Observations, in press
- Carilli et al. (2003) Carilli, C. L., Lewis, G. F., Djorgovski, S. G., Mahabal, A., Cox, P., Bertoldi, F., & Omont, A. 2003, Science, 300, 773
- Cattaneo, Haehnelt, & Rees (1999) Cattaneo, A., Haehnelt, M. G., & Rees, M. J. 1999, MNRAS, 308, 77
- (30) Chapman, S. C., Blain, A. W., Ivison, R. J., Smail, I. 2003, in Star formation through time, preprint (astro-ph/0304236)
- Colina et al. (2001) Colina, L. et al. 2001, ApJ, 563, 546
- Collin et al. (2002) Collin, S., Boisson, C., Mouchet, M., Dumont, A.-M., Coupé, S., Porquet, D., & Rokaki, E. 2002, A&A, 388, 771
- Constantin et al. (2002) Constantin, A., Shields, J. C., Hamann, F., Foltz, C. B., & Chaffee, F. H. 2002, ApJ, 565, 50
- Czerny, Nikołajuk, Piasecki, & Kuraszkiewicz (2001) Czerny, B., Nikołajuk, M., Piasecki, M., & Kuraszkiewicz, J. 2001, MNRAS, 325, 865
- De Breuck et al. (2002) De Breuck, C., van Breugel, W., Stanford, S. A., Röttgering, H., Miley, G., & Stern, D. 2002, AJ, 123, 637
- Dey (1999) Dey, A. 1999, in The Most Distant Radio Galaxies, ed. H. J. A. Röttgering, P. N. Best, & M. D. Lehnert, (Amsterdam: Royal Netherlands Academy of Arts and Sciences), 19
- Dey, van Breugel, Vacca, & Antonucci (1997) Dey, A., van Breugel, W., Vacca, W. D., & Antonucci, R. 1997, ApJ, 490, 698
- Dietrich, Appenzeller, Vestergaard, & Wagner (2002b) Dietrich, M., Appenzeller, I., Vestergaard, M., & Wagner, S. J. 2002b, ApJ, 564, 581
- (39) Dietrich, M., Hamann, F., Shields, J.C., Constantin, A., Vestergaard, M., Chaffee, F., Foltz, C.B., Junkkarinen, V.T. 2002a, ApJ, 581, 912
- Di Matteo et al. (2003) Di Matteo, T., Croft, R. A. C., Springel, V., Hernquist, L. 2003, ApJ, 593, 56
- Downes & Solomon (1998) Downes, D. & Solomon, P. M. 1998, ApJ, 507, 615
- Dunne et al. (2000) Dunne, L., Eales, S., Edmunds, M., Ivison, R., Alexander, P., & Clements, D. L. 2000, MNRAS, 315, 115
- Eales & Rawlings (1993) Eales, S. A. & Rawlings, S. 1993, ApJ, 411, 67
- Efstathiou & Rees (1988) Efstathiou, G. & Rees, M. J. 1988, MNRAS, 230, 5P
- Elvis et al. (1994) Elvis, M. et al. 1994, ApJS, 95, 1
- Elvis, Risaliti, & Zamorani (2002) Elvis, M., Risaliti, G., & Zamorani, G. 2002, ApJ, 565, L75
- (47) Fan, X. et al. 1999, AJ, 118, 1
- (48) Fan, X. et al. 2000, AJ, 119, 1
- (49) Fan, X. et al. 2001a, AJ, 121, 54
- (50) Fan, X. et al. 2001b, AJ, 121, 31
- (51) Fan, X. et al. 2001c, AJ, 122, 2833
- Fan et al. (2002) Fan, X., Narayanan, V. K., Strauss, M. A., White, R. L., Becker, R. H., Pentericci, L., & Rix, H. 2002, AJ, 123, 1247
- Farrah et al. (2003) Farrah, D., Afonso, J., Efstathiou, A., Rowan-Robinson, M., Fox, M., & Clements, D. 2003, MNRAS, 343, 585
- (54) Ferrarese, L., 2002, ApJ, 578, 90
- (55) Ferrarese, L., & Merritt, D. 2000, 539, L9
- Ferrarese et al. (2001) Ferrarese, L., Pogge, R. W., Peterson, B. M., Merritt, D., Wandel, A., & Joseph, C. L. 2001, ApJ, 555, L79
- Forster et al. (2001) Forster, K., Green, P. J., Aldcroft, T. L., Vestergaard, M., Foltz, C. B., & Hewett, P. C. 2001, ApJS, 134, 35
- (58) Francis, P. J., Hewett, P. C., Foltz, C. B., Chaffee, F. H., Weymann, R. J., & Morris, S. L. 1991, ApJ, 373, 465
- Frayer et al. (1999) Frayer, D. T. et al. 1999, ApJ, 514, L13
- (60) Gebhardt, K., et al. 2000a, ApJ, 539, L13
- (61) Gebhardt, K., et al. 2000b, ApJ, 543, L5
- Genzel et al. (1998) Genzel, R. et al. 1998, ApJ, 498, 579
- Graham et al. (1994) Graham, J. R. et al. 1994, ApJ, 420, L5
- Guilloteau et al. (1999) Guilloteau, S., Omont, A., Cox, P., McMahon, R. G., & Petitjean, P. 1999, A&A, 349, 363
- Haehnelt & Kauffmann (2000) Haehnelt, M. G., & Kauffmann, G. 2000, MNRAS, 318, L35
- Haehnelt & Rees (1993) Haehnelt, M. G. & Rees, M. J. 1993, MNRAS, 263, 168
- Haehnelt, Natarajan, & Rees (1998) Haehnelt, M. Natarajan, P., & Rees, M. J. 1998, MNRAS, 300, 817
- Haiman & Loeb (1998) Haiman, Z. & Loeb, A. 1998, ApJ, 503, 505
- Haiman & Loeb (2001) Haiman, Z. & Loeb, A. 2001, ApJ, 552, 459
- Haiman, Madau, & Loeb (1999) Haiman, Z. , Madau, P., & Loeb, A. 1999, ApJ, 514, 535
- Hartwick & Schade (1990) Hartwick, F. D. A. & Schade, D. 1990, ARA&A, 28, 437
- (72) Hasinger, G. 2002, in New Visions of the X-ray Universe in the XMM-Newton and Chandra Era, Ed. F. Jansen (ESTEC: ESA SP-488), XX (astro-ph/0202430)
- Hewitt & Burbidge (1993) Hewitt, A. & Burbidge, G. 1993, ApJS, 87, 451
- Ho (1999) Ho, L. C. 1999, ApJ, 516, 672
- Hook, McMahon, Shaver, & Snellen (2002) Hook, I. M., McMahon, R. G., Shaver, P. A., & Snellen, I. A. G. 2002, A&A, 391, 509
- Huchra & Burg (1992) Huchra, J. & Burg, R. 1992, ApJ, 393, 90
- Hughes, Robson, Dunlop, & Gear (1993) Hughes, D. H., Robson, E. I., Dunlop, J. S., & Gear, W. K. 1993, MNRAS, 263, 607
- Isaak et al. (2002) Isaak, K. G., Priddey, R. S., McMahon, R. G., Omont, A., Peroux, C., Sharp, R. G., & Withington, S. 2002, MNRAS, 329, 149
- Ivison et al. (1998) Ivison, R. J. et al. 1998, ApJ, 494, 211
- (80) Kaspi, S., Smith, P. S., Netzer, H., Maoz, D., Jannuzi, B. T., & Giveon, U. 2000, ApJ, 533, 631
- Kauffmann & Haehnelt (2000) Kauffmann, G., & Haehnelt, M. 2000, MNRAS, 311, 576
- (82) Kellerman, K. I., Sramek, R., Schmidt, M., Shaffer, D. B., & Green, R. 1989, AJ, 98, 1195
- (83) Kennefick, J. D., et al. 1995a, AJ, 110, 78
- (84) Kennefick, J. D., Djorgovski, S. G., & de Carvalho, R. R. 1995b, AJ, 110, 2553
- (85) Kennefick, J. D., Djorgovski, S. G., & Meylan, G. 1996, AJ, 111, 1816
- Klaas et al. (2001) Klaas, U. et al. 2001, A&A, 379, 823
- Korista et al. (1995) Korista, K. T., et al. 1995, ApJS, 97, 285
- Korista, Baldwin, Ferland, & Verner (1997) Korista, K., Baldwin, J., Ferland, G., & Verner, D. 1997, ApJS, 108, 401
- Kuhn, Elvis, Bechtold, & Elston (2001) Kuhn, O., Elvis, M., Bechtold, J., & Elston, R. 2001, ApJS, 136, 225.
- Kukula et al. (2001) Kukula, M. J., Dunlop, J. S., McLure, R. J., Miller, L., Percival, W. J., Baum, S. A., & O’Dea, C. P. 2001, MNRAS, 326, 1533
- Kuraszkiewicz et al. (2003) Kuraszkiewicz, J. K. et al. 2003, ApJ, 590, 128
- (92) Lanzetta, K.-M., Chen, H.-W., Pascarelle, S., & Yahata, N. 1999, in The Birth of Galaxies, ed. B. Guiderdoni et al. (Gif-sur-Yvette, Editions Frontiéres), in press (astro-ph/9809294)
- Laor (2000) Laor, A. 2000, ApJ, 543, L111
- Laor et al. (1994) Laor, A., Bahcall, J. N., Jannuzi, B. T., Schneider, D. P., Green, R. F., & Hartig, G. F. 1994, ApJ, 420, 110
- Leighly (2000) Leighly, K. M. 2000, New Astronomy Review, 44, 395
- Lilly & Longair (1984) Lilly, S. J. & Longair, M. S. 1984, MNRAS, 211, 833
- Lonsdale, Smith, & Lonsdale (1995) Lonsdale, C. J., Smith, H. E., & Lonsdale, C. J. 1995, ApJ, 438, 632
- Mathur, Wilkes, & Ghosh (2002) Mathur, S., Wilkes, B. J., & Ghosh, H. 2002, ApJ, 570, L5
- McLure & Dunlop (2001) McLure, R. J. & Dunlop, J. S. 2001, MNRAS, 327, 199
- McLure et al. (1999) McLure, R. J., Kukula, M. J., Dunlop, J. S., Baum, S. A., O’Dea, C. P., & Hughes, D. H. 1999, MNRAS, 308, 377
- McMahon et al. (1999) McMahon, R. G., Priddey, R. S., Omont, A., Snellen, I., & Withington, S. 1999, MNRAS, 309, L1
- Menou, Haiman, & Narayanan (2001) Menou, K., Haiman, Z., & Narayanan, V. K. 2001, ApJ, 558, 535
- Merritt & Ferrarese (2001) Merritt, D. & Ferrarese, L. 2001, MNRAS, 320, L30
- Milosavljević & Merritt (2001) Milosavljević, M. & Merritt, D. 2001, ApJ, 563, 34
- Milosavljević & Merritt (2002) Milosavljević, M. & Merritt, D. 2002, AAS/Division of Dynamical Astronomy Meeting, 33
- Murphy, Browne, & Perley (1993) Murphy, D. W., Browne, I. W. A., & Perley, R. A. 1993, MNRAS, 264, 298
- (107) Neufeld, D. A. 1999, in After the Dark Ages: When Galaxies were Young (the Universe at ), ed. S. Holt and E. Smith ( : AIPP), 414
- (108) Neugebauer, G., Green, R. F., Matthews, K., Schmidt, M., Soifer, B. T., & Bennett, J. 1987, ApJS, 63, 615
- Netzer (2003) Netzer, H. 2003, ApJ, 583, L5
- Ohta et al. (1996) Ohta, K., Yamada, T., Nakanishi, K., Kohno, K., Akiyama, M., & Kawabe, R. 1996, Nature, 382, 426
- Omont (2003) Omont, A. 2003, preprint (astro-ph/0304340)
- Omont et al. (2001) Omont, A., Cox, P., Bertoldi, F., McMahon, R. G., Carilli, C., & Isaak, K. G. 2001, A&A, 374, 371
- Omont et al. (1996) Omont, A., Petitjean, P., Guilloteau, S., McMahon, R. G., Solomon, P. M., & Pecontal, E. 1996, Nature, 382, 428
- Onken & Peterson (2002) Onken, C. A. & Peterson, B. M. 2002, ApJ, 572, 746
- Osmer (1982) Osmer, P. S. 1982, ApJ, 253, 28
- Osmer (2003) Osmer, P. S. 2003, Carnegie Observatories Astrophysics Series, Vol. 1: Coevolution of Black Holes and Galaxies, ed. L. C. Ho (Cambridge: Cambridge Univ. Press), in press (astro-ph/0304150)
- Papadopoulos et al. (2000) Papadopoulos, P. P., Röttgering, H. J. A., van der Werf, P. P., Guilloteau, S., Omont, A., van Breugel, W. J. M., & Tilanus, R. P. J. 2000, ApJ, 528, 626
- Papovich, Dickinson, & Ferguson (2001) Papovich, C., Dickinson, M., & Ferguson, H. C. 2001, ApJ, 559, 620
- Pei (1995) Pei, Y. C. 1995, ApJ, 438, 623
- Pentericci et al. (1999) Pentericci, L., Röttgering, H. J. A., Miley, G. K., McCarthy, P., Spinrad, H., van Breugel, W. J. M., & Macchetto, F. 1999, A&A, 341, 329
- Pentericci et al. (2001) Pentericci, L., McCarthy, P. J., Röttgering, H. J. A., Miley, G. K., van Breugel, W. J. M., & Fosbury, R. 2001, ApJS, 135, 63
- Pentericci et al. (2002) Pentericci, L. et al. 2002, AJ, 123, 2151
- Peterson (1997) Peterson, B. M. 1997, An introduction to active galactic nuclei (Cambridge: Cambridge University Press)
- Peterson (2002) Peterson, B. M. 2002, in Active Galactic Nuclei: From Central Engine to Host Galaxy, ed. S. Collin, F. Combes, and I. Shlosman (San Francisco: ASP), 6
- (125) Peterson, B. M., Polidan, R. S., & Pogge, R. W. 2001, ASP Conf. Ser. 224, Probing the Physics of Active Galactic Nuclei by Multiwavelength Monitoring (San Francisco: ASP)
- Peterson & Wandel (1999) Peterson, B. M. & Wandel, A. 1999, ApJ, 521, L95
- Peterson & Wandel (2000) Peterson, B. M. & Wandel, A. 2000, ApJ, 540, L13
- Peterson et al. (2000) Peterson, B. M., et al. 2000, ApJ, 542, 161
- Petric et al. (2003) Petric, A. O., Carilli, C. L., Bertoldi, F., Fan, X., Cox, P., Strauss, M. A., Omont, A., & Schneider, D. P. 2003, AJ, 126, 15
- Priddey & McMahon (2001) Priddey, R. S. & McMahon, R. G. 2001, MNRAS, 324, L17
- Priddey, Isaak, McMahon, & Omont (2003) Priddey, R. S., Isaak, K. G., McMahon, R. G., & Omont, A. 2003, MNRAS, 339, 1183
- Reuland et al. (2003) Reuland, M., van Breugel, W., Röttgering, H., de Vries, W., De Breuck, C., & Stern, D. 2003, ApJ, 582, L71
- Richards et al. (2001) Richards, G. T. et al. 2001, AJ, 121, 2308
- Ridgway, Heckman, Calzetti, & Lehnert (2001) Ridgway, S. E., Heckman, T. M., Calzetti, D., & Lehnert, M. 2001, ApJ, 550, 122
- Rix et al. (2001) Rix, H.-W., Falco, E. E., Impey, C., Kochanek, C., Lehár, J., McLeod, B., Muñoz, J., & Peng, C. 2001, ASP Conf. Ser. 237: Gravitational Lensing: Recent Progress and Future Goals, ed. T. G. Brainerd & C. S. Kochanek (San Francisco: ASP), 169
- Rowan-Robinson (2000) Rowan-Robinson, M. 2000, MNRAS, 316, 885
- Sanders et al. (1989) Sanders, D. B., Phinney, E. S., Neugebauer, G., Soifer, B. T., & Matthews, K. 1989, ApJ, 347, 29
- Sanders, Scoville, & Soifer (1991) Sanders, D. B., Scoville, N. Z., & Soifer, B. T. 1991, ApJ, 370, 158
- Schirber & Bullock (2003) Schirber, M. & Bullock, J. S. 2003, ApJ, 584, 110
- (140) Schlegel, D. J., Finkbeiner, D. P., Davis, M. 1998, ApJ, 500, 525
- (141) Schmidt, M., & Green, R. F. 1983, ApJ, 269, 352
- Schmidt, Schneider, & Gunn (1995) Schmidt, M., Schneider, D. P., & Gunn, J. E. 1995, AJ, 110, 68
- Schneider et al. (1997) Schneider, D. P., Schmidt, M., & Gunn, J. E. 1997, AJ, 114, 36
- Schneider et al. (2001) Schneider, D. P. et al. 2001, AJ, 121, 1232
- Shaver et al. (1996) Shaver, P. A., Wall, J. V., Kellermann, K. I., Jackson, C. A., & Hawkins, M. R. S. 1996, Nature, 384, 439
- Shields, Ferland, & Peterson (1995) Shields, J. C., Ferland, G. J., & Peterson, B. M. 1995, ApJ, 441, 507
- Silk & Rees (1998) Silk, J., & Rees, M. J. 1998, A&A, 331, L1
- (148) Solomon, P. M., Downes, D., Radford, S. J. E., & Barrett, J. W. 1997, ApJ, 478, 144
- Steidel et al. (1996) Steidel, C. C., Giavalisco, M., Pettini, M., Dickinson, M., & Adelberger, K. L. 1996, ApJ, 462, L17
- Steidel et al. (1999) Steidel, C. C., Adelberger, K. L., Giavalisco, M., Dickinson, M., & Pettini, M. 1999, ApJ, 519, 1
- Steidel et al. (2002) Steidel, C. C., Hunt, M. P., Shapley, A. E., Adelberger, K. L., Pettini, M., Dickinson, M., & Giavalisco, M. 2002, ApJ, 576, 653
- (152) Stern, D., Djorgovski, S. G., Perley, R. A., de Carvalho, R. R., Wall, J. V. 2000, ApJ, 119, 1526
- Storrie-Lombardi, McMahon, Irwin, & Hazard (1996) Storrie-Lombardi, L. J., McMahon, R. G., Irwin, M. J., & Hazard, C. 1996, ApJ, 468, 121
- Tacconi et al. (1999) Tacconi, L. J., Genzel, R., Tecza, M., Gallimore, J. F., Downes, D., & Scoville, N. Z. 1999, ApJ, 524, 732
- Theuns, Mo, & Schaye (2001) Theuns, T., Mo, H. J., & Schaye, J. 2001, MNRAS, 321, 450
- (156) Turner, E. L. 1991, AJ, 101, 5
- van Bemmel & Dullemond (2003) van Bemmel, I. M. & Dullemond, C. P. 2003, A&A, 404, 1
- van Breugel et al. (1998) van Breugel, W. J. M., Stanford, S. A., Spinrad, H., Stern, D., & Graham, J. R. 1998, ApJ, 502, 614
- Vestergaard (2000) Vestergaard, M. 2000, PASP, 112, 1504
- Vestergaard (2002a) Vestergaard, M. 2002, ApJ, 571, 733 (paper I)
- Vestergaard & Wilkes (2001) Vestergaard, M., & Wilkes, B. J. 2001, ApJS, 134, 1
- Vestergaard, Wilkes, & Barthel (2000) Vestergaard, M., Wilkes, B. J., & Barthel, P. D. 2000, ApJ, 538, L103
- Vignali et al. (2003) Vignali, C., Brandt, W. N., Schneider, D. P., Garmire, G. P., & Kaspi, S. 2003, AJ, 125, 418
- (164) Volonteri, M., Haardt, F., Madau, P. 2002, ApJ, 582, 559
- (165) Wandel, A., Peterson, B. M., & Malkan, M. A. 1999, ApJ, 526, 579
- Warren, Hewett, & Osmer (1994) Warren, S. J., Hewett, P. C., & Osmer, P. S. 1994, ApJ, 421, 412
- Wilkes et al. (1999a) Wilkes, B. J., Kuraszkiewicz, J., Green, P. J., Mathur, S., McDowell, J. C. 1999a, ApJ, 513, 76
- Wilkes et al. (1999b) Wilkes, B. J., Hooper, E. J., McLeod, K. K., Elvis, M. S., Impey, C. D., Lonsdale, C. J., Malkan, M. A., & McDowell, J. C. 1999b, ESA SP-427: The Universe as Seen by ISO, 845
- Willott, McLure, & Jarvis (2003a) Willott, C. J., McLure, R. J., & Jarvis, M. J. 2003a, ApJ, 587, L15
- Willott, Rawlings, Jarvis, & Blundell (2003b) Willott, C. J., Rawlings, S., Jarvis, M. J., & Blundell, K. M. 2003b, MNRAS, 339, 173
- Wyithe & Loeb (2002) Wyithe, J. S. B. & Loeb, A. 2002, ApJ, 577, 57
- Yi (1996) Yi, I. 1996, ApJ, 473, 645
- Yuan, Brinkmann, Siebert, & Voges (1998) Yuan, W., Brinkmann, W., Siebert, J., & Voges, W. 1998, A&A, 330, 108
- Yun et al. (2000) Yun, M. S., Carilli, C. L., Kawabe, R., Tutui, Y., Kohno, K., & Ohta, K. 2000, ApJ, 528, 171