IBIS preliminary results on Cygnus X-1 spectral and temporal characteristics††thanks: Based on observations with INTEGRAL, an ESA project with instruments and science data centre funded by ESA member states (especially the PI countries: Denmark, France, Germany, Italy, Switzerland, Spain), Czech Republic and Poland, and with the participation of Russia and the USA.
We report preliminary results of a broadband spectral and temporal study of the black-hole binary Cyg X-1 performed with the IBIS telescope. Cyg X-1 was the first pointed celestial target of IBIS during the INTEGRAL Performance and Verification Phase, 2002 Nov.–Dec., for a total observing time of 2 Ms in both staring and dithering mode. Here, we report on only the staring, on-axis, observation performed in a stable instrument configuration. During the observing period the source was in its characteristic low/hard state, in which a few flares and dips have been detected. The IBIS/ISGRI results demonstrate that the INTEGRAL observatory offers a unique capability for studying correlations between hardness and/or flux in different bands over a wide photon energy range. One of our new results is finding that the hardness-flux correlation changes the sign twice over the 20–220 keV; first from positive to negative at 50 keV, and then back to positive at 120 keV. The former change appears to be due to the spectral curvature introduced by variable Compton reflection. The latter may be due spectral pivoting.
Key Words.:
black hole physics – stars: individual: Cyg X-1 – gamma rays: observations – X-rays: binaries – X-rays: stars – X-rays: general1 Introduction
Cyg X-1 was the first established black-hole binary (BHB; Webster & Murdin 1972; Bolton 1972), and it is so far one of 18 known BHBs and one of three persistent ones. In the X-ray band, BHBs usually exhibit five distinct spectral /temporal states: low/hard (LH), high/soft (HS), very high, intermediate and quiescent (see a recent review by McClintock & Remillard 2003). Cyg X-1 itself exhibits strong variability on all time scales ranging from millisecond to years, and it is mostly in the LH state. During transitions between the LH and HS states, both gradual and rapid variations in the hardness ratio have been observed.
The LH state is characterized by a low flux in soft X-rays and strong hard X-ray and soft -ray flux. Its spectral variability on the time scale of days is then weak, while the 50 keV flux changes by a factor of a few (e.g., Gierliński et al. 1997). The X-ray spectrum in the LH state is well described by the sum of an intrinsic power law with the photon spectral index, –2, which is then cut off at energies keV, and a Compton reflection (Magdziarz & Zdziarski 1995) component. The intrinsic spectrum is due to thermal Comptonization in a plasma with an electron temperature of keV and a Thompson optical depth of (Gierliński et al. 1997), similarly to the case of other BHBs in the LH state (e.g., Zdziarski et al. 1998).
Recently, Zdziarski et al. (2002, hereafter Z02) presented an analysis of CGRO/BATSE and RXTE/ASM observations of Cyg X-1. One of their most interesting results in the X/ range is that most of the LH variability on time scales of hundred of days and longer can be explained by varying the slope of the overall spectrum with a pivot energy between 20 and 100 keV. The pivoting can be due to either variable plasma temperature or variable optical depth (Z02). Broad-band X/ observations are crucial in providing constraints on the nature of the variability, and, in particular, on the role of the soft photons in cooling the X-ray emitting plasma and the role of Compton reflection. Here, we present results from the IBIS instrument (Ubertini et al. 2003) on board of INTEGRAL (Winkler et al. 2003).

2 Observation and data analysis
Given the INTEGRAL launch date, Sun aspect constraints led to Cyg X-1 being chosen as the first strong -ray target for the initial calibration of the instruments during the Performance Verification (PV) Phase. The observations of the Cygnus region in general allowed for verification of the imaging performance and the Point Spread Function of IBIS as well as its cross-calibration with SPI and JEM-X. The PV phase consisted of a staring, on-axis, observation lasting ks, and ks of dithering observations to test the SPI performance. Also, 68 ks were devoted to calibration of the JEM-X with pointings of – off axis. In addition, contemporaneous observations of Cyg X-1 with RXTE were performed (Pottschmidt et al. 2003).
The IBIS instrument (Ubertini et al. 2003) is a coded-mask imaging telescope with a large field of view () based on two detector layers, ISGRI (Lebrun et al. 2003) and PICsIT (Labanti et al. 2003) operating in the ranges 15 keV–1 MeV and 175 keV–10 MeV, respectively. It provides fine imaging ( FWHM) for source identification and good spectral sensitivity in both continuum and broad lines over its operative range. During the observations, IBIS was still undergoing fine-tuning. Therefore, we studied only the staring, on-axis, observations performed by IBIS in a stable configuration, which correspond to revolutions 15 to 18, and use the consolidated data reprocessed by the INTEGRAL Science Data Center (Courvoisier et al. 2003). We use the offline scientific analysis (OSA) software v. 1.1. Details and procedures on the IBIS software developed by the IBIS Consortium are described in Goldwurm et al. (2003). We have analyzed ISGRI single interaction events for which arrival time, energy deposition and interaction pixels are known. Most of the time, PICsIT was in its standard configuration that provide images at time interval of the order of several minutes (1750–3600 s).
We produced the countrate, , lightcurves during 2002 Nov. 27–Dec. 8 binned by the pointings (science windows, hereafter scws) in the ranges of 20–40, 40–60, 60–120, 120–220 and 220–350 keV. The typical duration of a scw is s, which allows us to study variability on the time scales ranging from that time to days. The highest of the above energy channels has not been used due to low statistical significance of its single scw.
The lightcurves in the four energy bands are shown in Fig. 1. We see that they are rather similar to each other. This is confirmed by calculating the fractional rms variability (after subtracting the variability due to the measurement errors), which is found to be , , , for channels with the increasing energy, respectively.
Fig. 2 shows the corresponding evolution of the hardness ratio in adjacent channels. As expected by the similarity of the lightcurves, variability of the hardness ratios is much weaker, with the values of the fractional rms of , , and (with increasing energy). Interestingly, the spectral variability is strongest at the highest observed energies, keV. There is small, but statistically significant, increase and decrease of the first and second hardness with time. Formally, the best exponential fits give the e-folding times of days and days, respectively. On the other hand, there is a strong drop in the emission keV from rev. 15 to 16 followed by a slow decrease during rev. 16, and a slow increase during rev. 18. A time scale for significant changes of that emission is days.

3 Hardness-flux correlations
Most of the information on the long-term characteristics of Cyg X-1 in hard X-rays/soft -rays to date comes from the BATSE detector. In the LH state, the 20–300 keV data show a positive correlation between the ratio of the 100–300 keV and 20–100 keV fluxes and the 100–300 keV flux. On the other hand, the correlations of the opposite sign are seen in the range of the ASM detector, 1.5–12 keV. Together, the data show the presence of a pivot in the –100 keV range (Z02). This is also supported by the fractional variability as a function of the energy which has a minimum in the 20–100 keV range. As pointed out in Z02, the pivoting variability appears only on very long time scales, of the order of days. In addition, there is a second variability pattern, in which the broad-band spectra move up and down with a little change of the spectral shape. The presence of both patterns is also confirmed by analysis of individual pointed observations (Z02, Gierliński et al. 1997).
The pivoting variability pattern is explained by Z02 as caused by a variable luminosity in the soft seed photons irradiating the plasma. If the plasma is not dominated by e± pairs, the variable irradiation results in the plasma temperature adjusting itself to satisfy the energy balance. As a consequence, softer spectra are expected to correspond to a lower electron temperature. This appears to be confirmed by a BeppoSAX observation in 1996 September (Frontera et al. 2001), as pointed out by Z02. On the other hand, variations of the local accretion rate in an a flow of a constant geometry may be responsible for the variable amplitude with the constant spectral shape. In summary, Z02 found strong changes in the hardness on long time scale, whereas variability was dominated by changing the total luminosity on shorter time scales.

Following the above suggestions, we consider here correlations between the spectral hardness and count rates. Our results are shown in Fig. 3, showing the three ratios (Fig. 2) each vs. their defining count rates. All the hardnesses and count rates are correlated at a very high statistical significance (see below). We find a new and unexpected result that while the 40–120 keV hardness ratio decreases with their defining count rates (top panels in Fig. 3), consistent with the pivoting variability of Z02, the 20–60 keV hardness increases with the corresponding count rates. (Note that such a behaviour could not be found by Z02, who used only two rather broad BATSE channels, 20–100 keV and 100–300 keV.) The change of the sign of the hardness-flux correlation in the 40–60 keV channel cannot be due to pivoting variability, as hardness decreases with flux below a pivot and increases above it, just opposite to our result.
The observed behaviour has to be due to a variable spectral curvature, with a hump around keV appearing in the spectrum at high fluxes. Such a hump is very likely to be due to Compton reflection, well known to be present in the spectra of Cyg X-1 (e.g., Gierliński et al. 1997; Gilfanov, Churazov & Revnivtsev 1999). A spectrum from reflection of an intrinsic BHB LH-state continuum is very hard below its peak at several tens of keV and very soft above it (e.g., Magdziarz & Zdziarski 1995). Thus, its addition hardens the total spectrum below the peak and softens it at higher energies, entirely consistent with our results. A quantitative study of this effect would require data at energies keV, not available to us at this time, as well as spectral fits by each scw, which is beyond the scope of this Letter. However, we point out that Compton reflection is known to be variable in Cyg X-1, and in particular it correlates with the X-ray spectral index (Zdziarski, Lubiński & Smith 1999; Gilfanov et al. 1999).
Going to higher energies, we also see that the hardness-flux correlation continues to be negative up to keV, but it becomes again positive at keV. This, on the other hand, is consistent with the findings of Z02 (see their fig. 6) and may indeed be due to spectral pivoting.
Fig. 3 also shows the best fit power-law dependencies, corresponding to the count rate ratio . The values of the exponent are , , , , , and , for the six consecutive correlations. The small relative uncertainties demonstrate the high significance of the correlations. This is also confirmed by the Spearman rank correlation test, which gives relatitvely high correlation coefficients of 0.29, 0.43, , , , and 0.24. The corresponding probabilities of the absence of a correlation are very low, with the highest value of for the last correlation and than that for all others.
4 Spectral evolution
We clearly see in Fig. 1 a number of short flares and dips (note that those are not absorption dips). To study in detail evolution of the spectra, we have selected the scws corresponding to the two of the flares and one of the dips. For reference, we used stable periods containing 9 and 21 scws during the rev. 16 and 18, respectively. The log of the selected periods is given in Table 1.
| Rev. | scw | type | IJD | exposure |
|---|---|---|---|---|
| 16 | 6–14 | stable | 1064.6263–1064.9927 | 25269 s |
| 16 | 26–27 | peak | 1065.4406–1065.5220 | 5428 s |
| 18 | 2–21 | stable | 1070.4397–1071.2539 | 59816 s |
| 18 | 26–28 | peak | 1071.4167–1071.5389 | 8491 s |
| 18 | (2)22–24 | dip | 1072.5997–1072.7224 | 9557 s |
At this stage of the IBIS programme a detailed and accurate deconvolution matrix is still under finalisation and a spectral analysis has to be carried out with caution. In this work we have analysed the spectral data using a Crab-calibrated matrix with 64 energy channels. This matrix represents the Crab data well for integration times not exceeding 100 ks and energies keV. We have added a 5% systematic error to each PHA channel of the spectra analyzed below. Spectral fitting was performed with the standard XSPEC v. 11.2 tools.
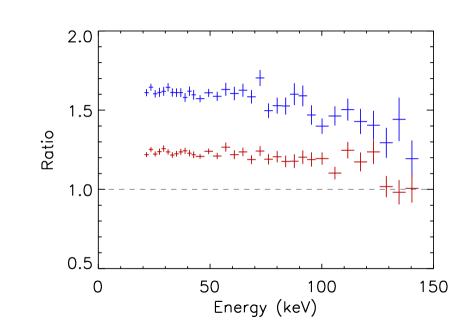
To study the short term spectral evolution of Cyg X-1, we have selected three spectra at the highest observed peak and just before it. This corresponds to the day 1071.5 during rev. 18 and scw 25, 26 and 27 (the last one at the maximum of the flare), see Fig. 1 and Table 1. The three data sets have been fitted to look for spectral evolution on the time scale of s over a wide energy range. A good fit (–1.1) has been obtained with a thermal Comptonization model (comptt of Hua & Titarchuk 1995) at the electron temperature of keV, the optical depth of , and the seed photon temperature constrained only to keV. Nevertheless, the model parameters are not well constrained due to the relatively short exposure, which causes the photon statistics to be poor at high energies, keV. To overcome this problem, we have tried a simpler model, namely, a power law. This yielded the spectral indices of , , for scw 25, 26, 27, respectively. Although are always worse than those of the comptt fits, the above numbers clearly show a softening of the spectrum with the increasing flux. Fig. 4 confirms this results by showing the ratios of the count rate spectra at scw 26 and 27 to that at the scw 25. We see that the softening takes place mostly at the highest energies, keV.

Given the above problems with photon statistics, we have obtained a spectrum from an uninterrupted period of 105 ks during rev. 18 (scws 1–33, IJD 1070.4019–1071.7310) during which the source did not show significant spectral variation. A power law model does not provide any good fit, and we used the comptt model, as above. The obtained parameters are keV, and the seed photon temperature constrained to keV, which yields with 51 d.o.f.. For comparison, the Crab fit with a power law yields at the 1 keV normalization of cm-2 s-1 at for 56 d.o.f. The average physical spectrum is shown in Fig. 5.
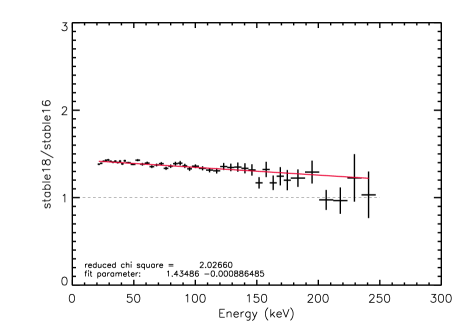
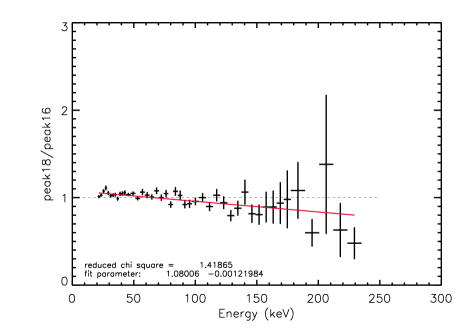
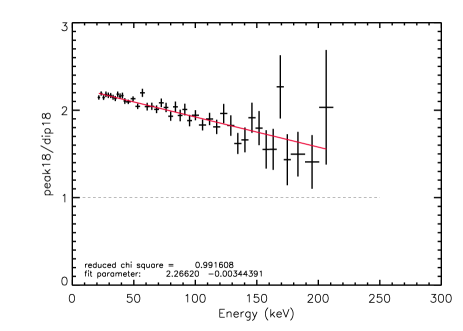
To further study correlations between the flux and the spectral hardness, we have measured the count-rate ratios between the five spectra listed in Table 1. This method allows us to eliminate possible uncertainties due to spectral deconvolution. In Fig. 6, we plot the ratio between two stable periods, two peaks, and between a peak and a dip. The first two ratios show no obvious trends, with the pairs of spectra just slightly differening in the slope. On the other hand, we clearly see a significant softening with the increasing flux in the peak-to-dip ratio (the bottom panel of Fig. 6). However, none of the chosen spectra has allowed us to measure any dependence of the high-energy cutoff (that would measure the plasma temperature) on the flux.
5 Conclusions
We have shown that the long, almost uninterrupted, observation of Cyg X-1 performed during the PV phase with the IBIS broad-band imager represents an invaluable database to deeply understand the nature of Cyg X-1 at high energies. The presented IBIS data cover the energy range from 20 keV to a fraction of 1 MeV and a period of 12 days with interruptions of 7 hours every 3 days due to the Earth radiation belt passage.
During that period, the flux varied by a factor of 3, including periods of stable emission, flares and dips. We have first studied correlations between the spectral hardness and the flux. Over the studied photon energy range, the correlation was found to change the sign twice over the 20–220 keV; first from positive to negative at 50 keV, and then back to positive at 120 keV. The former change appears to be due to the spectral curvature introduced by variable Compton reflection. The latter may be due spectral pivoting.
The characteristic time scale for changing spectral hardness is the shortest, 3 days, at the highest energies, keV. Most of the spectral variability is, in fact, taking place at those energies. The dependence of the high-energy emission on the overall spectral properties is relatively complex. In addition to the hardness-flux correlations mentioned above, we have found a spectral softening with the increasing flux during flares.
Acknowledgements.
We wish to thanks all the IBIS team whose effort made the instrument working. A particular thanks to G. La Rosa (IASF/Pa) and R. Much (ISOC), without them the Performance Verification phase could not be successful and to M. Federici for the long and valuable job to make the scientific analysis possible at IASF/Roma. We also like to thank the ESOC Team for the continuous support and kind hospitality. AAZ has been supported by KBN grants 5P03D00821, 2P03C00619p1,2, PBZ-054/P03/2001, and the Foundation for Polish Science. The IBIS programme has been funded in part by the Italian Space Agency.References
- Bolton (1972) Bolton, C. T. 1972, Nature, 240, 124
- Courvoisier (2003) Courvoisier, T., Walter, R., Beckmann, V., et al. 2003, A&A, this issue
- Frontera (2001) Frontera, F., Palazzi, E., Zdziarski, A. A., et al. 2001, ApJ, 546, 1027
- Gierliński (1997) Gierliński, M., Zdziarski, A. A., Done, C., et al. 1997, MNRAS, 288, 958
- Gilfanov (1999) Gilfanov, M., Churazov, E., & Revnivtsev, M. 1999, A&A, 352, 182
- Goldwurm (2003) Goldwurm, A., David, P., Foschini, L., et al. 2003, A&A, this issue
- Hua (1995) Hua, X., & Titarchuk, L. 1995, ApJ, 449, 188
- Labanti (2003) Labanti, C., Di Cocco, G., Ferro, G., et al. 2003, A&A, this issue
- Lebrun (2003) Lebrun, F., Leray J. P., Lavocat, P., et al. 2003, A&A, this issue
- Magdziarz (1995) Magdziarz, P., & Zdziarski, A. A. 1995, MNRAS, 273, 837
- McClintock (2003) McClintock, J. E., & Remillard, R. A. 2003, astro-ph/0306213
- Paciesas (1997) Paciesas, W., Robinson, C. R., McCollough, M. L., et al. 1997, AIP 410, 834
- Pottschmidt (2003) Pottschmidt, K., Wilms, J., Chernyakova, M., et al. 2003, A&A, this issue
- Ubertini (2003) Ubertini, P., Lebrun, F., Di Cocco, G., et al. 2003, A&A, this issue
- Webster (1972) Webster, B. L. & Murdin, P. 1972, Nature, 235, 37
- Winkler (2003) Winkler, C., Courvoisier, T. J. L., Di Cocco, G. et al. 2003, A&A, this issue
- Zdziarski (1998) Zdziarski, A. A., Poutanen, J., Mikołajewska, J., et al. 1998, MNRAS, 301, 435
- Zdziarski (1999) Zdziarski, A. A., Lubiński, P., & Smith, D. A., 1999 MNRAS, 303, L11
- Zdziarski (2002) Zdziarski, A. A., Poutanen, J., Paciesas, W. S., & Wen, L. 2002, ApJ, 578, 357 (Z02)