Structure and Dynamics of Stellar Winds in High-mass X-ray Binaries
Abstract
A review of spectroscopic results obtained from Chandra High Energy Transmission Grating Spectrometer (HETGS) and XMM-Newton Reflection Grating Spectrometers (RGS) observations of several wind-fed high-mass X-ray binaries (HMXBs) is presented. These observations allow us to study the structure of the stellar wind in more detail and provide, for the first time, a dyanmical view of the X-ray photoionized wind that surrounds the compact object. At the same time, however, they are also providing us with numerous puzzles that cannot be explained in terms of simple models. For example, simple spherically-symmetric wind models cannot explain the observed orbital-phase variability of the line intensities and shapes, which may be caused by intrinsic asymmetries due to the presence of the compact object and/or more complicated radiative transfer effects. The observed line shifts are smaller than those expected from extensions of simple wind models of isolated OB supergiants. In addition, several novel spectroscopic discoveries have been made, including: (1) P-Cygni lines from an expanding wind, (2) detection of multiple Si K fluorescent lines from a wide range of charge states, (3) Compton scattered Fe K lines from a cold medium. We discuss how these spectroscopic diagnostics can be used to understand some of the global properties of stellar winds in HMXBs.
1 Introduction
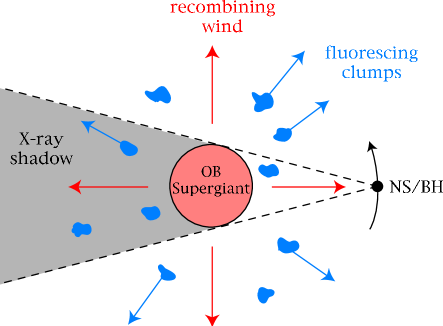
In wind-driven high mass X-ray binaries (HMXBs), a neutron star or a black hole sweeps up a small fraction of a stellar wind lost by a massive O- or B-type companion star. As matter is accreted onto the compact object, a fraction of the gravitational potential energy is converted into X-rays, which then ionizes and heats the surrounding gas. The wind reprocesses hard X-rays from the compact object, resulting in discrete emission lines and continuum radiation that carries a wealth of information about the physical state of the reprocessing medium. The compact object can, therefore, be used as an illuminating source to probe the structure of the stellar wind and derive the physical parameters that characterize its nature.
In addition to heating and ionizing the stellar wind, the X-ray source is also responsible for dynamically affecting the wind through its intense gravitational field and by destroying ions with strong UV resonance transitions that drive the stellar outflow. These effects, in combination with the orbital motion of the binary system, also produce a “wake” that trails behind the compact object. In low-luminosity HMXBs, however, the degree of stellar wind disruption by the compact object is expected to produce only a minor perturbation to the observed X-ray spectrum. This is especially true when observed during eclipse, since many of the dynamical effects are produced primarily in the vicinity of the compact object.
ASCA observations of several HMXBs have shown that their X-ray spectra exhibit both soft X-ray emission from highly ionized ions and fluorescent lines from cold, less ionized material (Vela X-1 – Nagase et al. 1994; Cen X-3 – Ebisawa et al. 1996; GX301-2 – Saraswat et al. 1996). Although the dominant excitation mechanism (i.e., collisional or photoionization-driven) that is responsible for producing the soft X-ray lines cannot be determined unambiguously from these observations, cascades following recombination seemed to be the most natural candidate given the presence of an intense X-ray continuum radiation field. Subsequently, Liedahl & Paerels (1996) and Kawashima & Kitamoto (1996), for the first time, detected a narrow radiative recombination continuum (RRC) of S XVI in the ASCA spectrum of Cyg X-3, which provided unequivocal evidence that the lines from highly-ionized gas in Cyg X-3, and most likely in all HMXBs, are driven almost exclusively through photoionization.
The first physically-motivated modeling of the X-ray spectrum was presented by Sako et al. (1999) using the same ASCA spectrum of Vela X-1 originally published by Nagase et al. (1994). Sako et al. (1999) have argued that the presence of emission lines from both high-ionized and cold near-neutral material can be understood only if the wind is structurally inhomogeneous, consisting of cool dense clouds embedded in a hot, highly ionized medium. They characterized the wind velocity profile as derived by Castor, Abbott, & Klein (1975; hereafter, CAK),
| (1) |
where is the radius of the companion star and is the terminal velocity and is a number that typically lies in the range (Abbott 1986; Pauldrach, Puls, & Kudritzki 1986). The particle density is, then, uniquely specified everywhere in the wind for an assumed , mass loss rate , and according to,
| (2) |
and, hence, the ionization parameter is also uniquely determined for a given X-ray luminosity. Here, is measured from the center of the companion star and is the average atomic mass unit of the constituent particles ( for solar abundances). Using this relatively simple model for the wind dynamics, they were able to infer the velocity structure of the hot medium and the mass-loss rate associated with that component. They also estimated the total mass in the clouds through measurements of fluorescent line intensities, and concluded that the cold fluorescing material contains a large fraction of the total wind mass (), while most of the wind volume () is occupied by highly ionized matter. According to this picture, the stellar wind in Vela X-1 is driven by UV radiation from the star that provides a driving force on the clumpy material, while the hot, ionized component is essentially transparent to UV radiation. Subsequently, Wojdowski, Liedahl, & Sako (2001) presented a detailed analysis of the X-ray spectrum of Cen X-3, which is on average more luminous than Vela X-1 by roughly an order of magnitude, and showed that the dense clumps that produce fluorescence lines in Vela X-1-like systems are more highly ionized in Cen X-3. The mass loss rate inferred from H- and He-like ions alone was consistent with those of normal isolated O stars.
While the most general characteristics of stellar winds in HMXBs were revealed using moderate spectral resolution data acquired with ASCA, there are still many outstanding issues that can only be addressed with high resolution spectroscopic data available from Chandra and XMM-Newton. The most significant improvement perhaps is the ability to study the dynamics of the X-ray emitting gas, which cannot be studied with the ASCA detectors, because line shifts and widths due to typical wind velocities of require a spectral resolving power an order of magnitude higher than that of CCDs ( of at least ). Accurate column density measurements are also possible through measurements of line ratios of the He-like triplets and other transitions (Kinkhabwala et al. 2002). In the following sections, we discuss some of the recent advances made with observations of HMXBs with the grating spectrometers on Chandra and XMM-Newton.
2 Some General Spectral Properties of Individual Sources
Shown in Figure 2 are the Chandra HETGS spectra of four objects Cen X-3, Cyg X-3, Vela X-1, and GX301-2. As immediately evident from the figure, the general properties of both the continuum and line emission are vastly different among each of the sources. The spectrum of Cen X-3 (1st panel in Figure 2), which is a relatively high-lumonisity system () containing a pulsar with a O 6-8 III companion, is completely dominated by continuum emission with a relatively low line-of-sight column density of cold material (). The spectrum exhibits very weak absorption lines mostly from H-like ions with column densities of . During eclipse, however, the spectrum is dominated almost entirely by line emission as presented by Wojdowski et al. (2003).
In Cyg X-3 (second panel in Figure 2), the emission line equivalent widths are larger (see, Paerels et al. 2000). This suggests that a substantial fraction of the continuum radiation is reprocessed by the wind, which implies that the product of the covering fraction and the column density of highly ionized material () is higher. Since the X-ray luminosities of Cyg X-3 and of Cen X-3 during these observations were similar, the observed differences in the line spectrum also suggest that the average density of the X-ray emission line regions in Cyg X-3 is higher. This is in qualitative agreement with the high mass-loss rate of the Wolf-Rayet companion and the compacteness of the binary system (van Kerkwijk 1995).
Local anisotropies in the distribution of absorbing material around the X-ray source can also affect the line equivalent widths. In the Vela X-1 spectrum (third panel in Figure 2), the observed continuum is highly absorbed while the lines longward of Å have high equivalent widths. This implies that the emission line regions are illuminated by a continuum that is less absorbed than what we observe. In other words, the absorber that covers the continuum source along our line of sight does not block the emission line regions. As in Cen X-3, the spectrum of Vela X-1 during eclipse is also dominated by emission lines produced through photoionization of the extended stellar wind, as shown by Schulz et al. (2002).
The soft X-ray photons of GX301-2 (last panel in Figure 2) suffers extremely high intrinsic attentuation (). The weaknesses of the soft X-ray lines here suggest that both the line and continuum emission regions are absorbed, most likely by the same material. Also note the differences in the iron K line equivalents widths. The more luminous systems (Cen X-3and Cyg X-3) with show much weaker lines compared to the less luminous systems (Vela X-1 and GX301-2), which have .


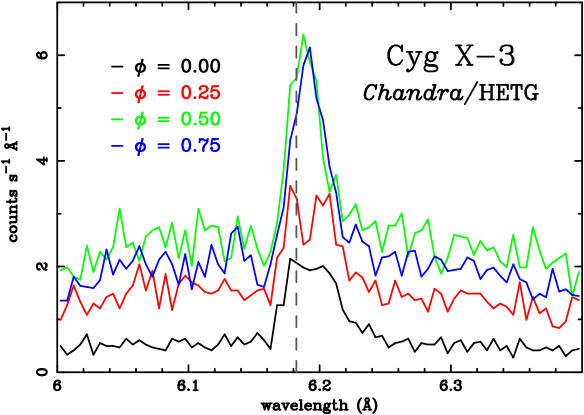
The X-ray light curves differ substantially among the various systems as well. Many sources contain pulsars, which show periodic modulations of with pulsed fractions of % and higher. These systems also show flare-like events during which the luminosity variabilies by more than a factor of few on timescales as short as tens of seconds, mostly due to accretion instabilites as well as variable absorption on longer timescales (see Figure 3). On the other hand, there are systems like Cyg X-3, a black hole candidate, which generally exhibits a smooth X-ray light curve. The accretion behavior, therefore, appear to be significantly different from source to source.
3 Wind Dynamics
One of the most important improvements made by observations of HMXBs with Chandra and XMM-Newton is the ability to measure velocities down to a fraction of the terminal wind velocity. In many cases, the observed lines are resolved and show complex detailed structure as well as temporal behavior.
3.1 Line Profiles and P-Cygni Lines
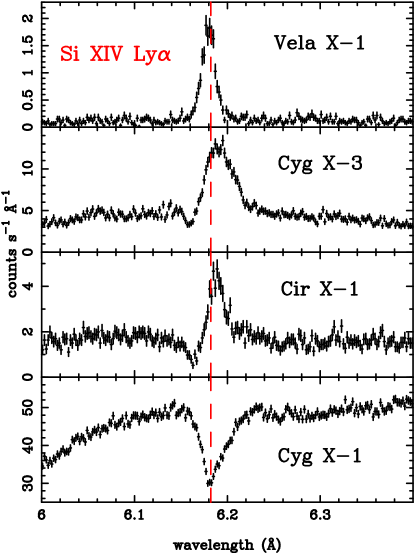
The observed line profiles come in many different types as shown in Figure 4, and they provide valuable information not only about the dynamical properties of the emission line regions, but they are also sometimes useful for determining the dominant excitation mechanism as well. The top panel shows a pure emission profile as observed in Vela X-1. On the panel below is a P-Cygni line, which shows a broad emission feature with a weak absorption trough towards the blue. The emission component is much stronger than the absorption component, suggesting that recombination is the dominant line formation mechanism, since there is not enough continuum radiation to account for all the observed line photons via resonant fluorescence scattering. In the third panel111Cir X-1 is classified as a LMXB. We, however, show the spectrum here since it is the only LMXB system known that shows strong P-Cygni lines., however, the emission and absorption equivalent widths are comparable, which suggests that the emission component probably comes mostly from scattering of the continuum. This interpretation, however, can be ambiguous since similar profiles can also be generated in a recombination-dominated medium with a small covering fraction, thereby reducing only the emission component. The last panel, finally, shows a pure absorption line profile with very little re-emission. In this case, the absorber, which happens to lie along the observers’ line-of-sight, subtends only a small fraction of the sky as viewed from the X-ray continuum source.
3.2 Orbital-phase Variability
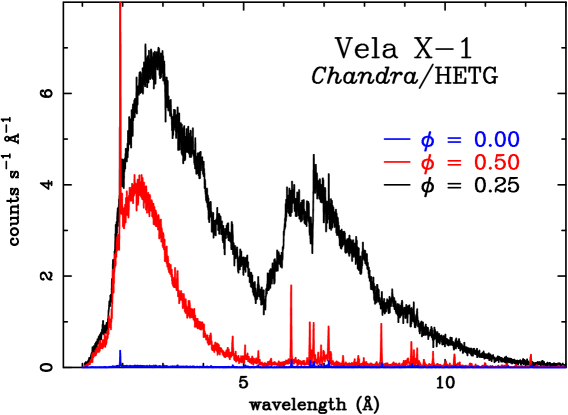
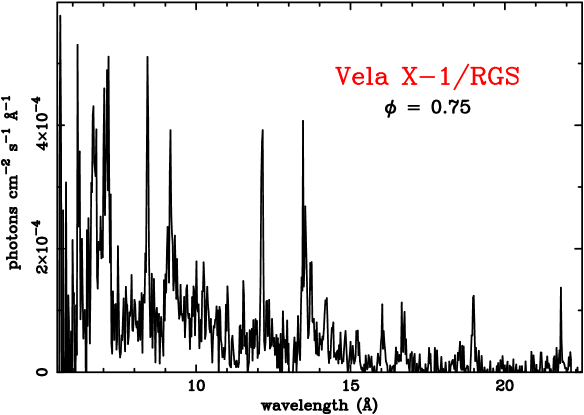
Vela X-1 was observed during three different orbital phases centered on , and with the Chandra HETGS and during with XMM-Newton. The HETGS spectra shown in Figure 5 are easily compared with one another. The RGS spectrum is shown separately for clarity.
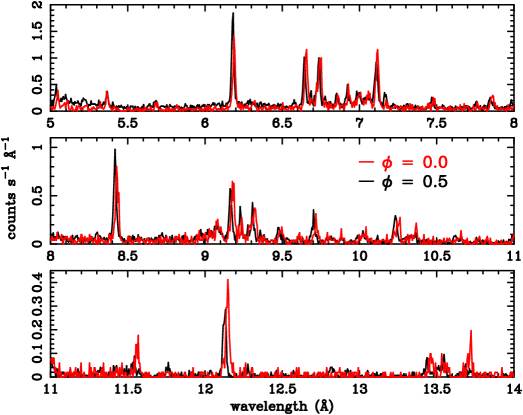
A comparison of the observed line spectra at and is particularly interesting. Shown in Figure 6 are the spectra normalized to the peak of the Si XIII forbidden line and overlaid on top of each other. Apart from the velocity shifts (see Figure 7), the spectra look nearly identical with % difference in the fluxes of most of the lines. If anything, the spectrum appears more highly-ionized as the Si XIV Ly line is stronger and the Si near-neutral line complex is weaker. This is in direct contradiction to the spherically-symmetric wind model presented in Sako et al. (1999), who predicted that the differential emission measure distribution at would be much softer (i.e., lower ionization) than during eclipse due to photoionization of more dense material near the stellar photosphere. The Chandra data instead show that there is a large difference only in the overall normalization of the distribution by roughly an order of magnitude with very little difference in the actual shape. However, this is not a surprising result, as disruption of the stellar wind is expected to be most significant near the compact object, where both the gravitational and X-ray radiation field are high. A simple isolated wind model, therefore, are not applicable in these regions.
Geometrically, the fact that the emission line ratios at and are similar implies that the spectrum emitted in the region blocked by the companion during eclipse (a cylinder roughly along the line of centers) is nearly identical to that of the rest of the wind. A smooth wind model characterized by a CAK velocity profile is ruled out for reasons stated above. Several simple models for the clump distribution can be ruled out immediately as well. First of all, a population of identical clumps distributed uniformly throughout the wind cannot explain this behavior, since clumps near the compact object will be more highly ionized. In addition, a distribution of clumps, whose densities are proportional to the surrounding local wind density (i.e., higher density clumps closer to the stellar surface; see Equ. 2), cannot reproduce the data either. In this case, we would expect to detect higher line fluxes from lower ionization species during , contrary to what is observed.
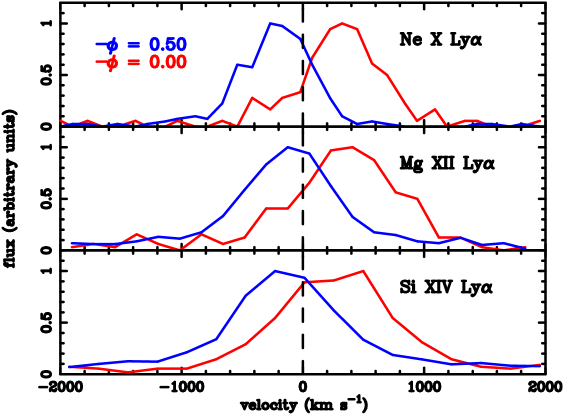
Assuming that the wind in the shadow cone does not emit a significant amount of X-ray line radiation, one expects that most of the wind as seen at would be moving away from the observer emitting lines shifted towards the red. Similarly, then, lines observed during should be blueshifted. Qualitatively this appears to be consistent with what is observed in Vela X-1 as shown in Figure 7. Quantitatively, however, they are inconsistent — the measured line shifts and widths are too small. First of all, the average line shifts of correspond to wind velocities at approximately % of the stellar radius from the photosphere, assuming a CAK profile given by Equ. 1 and ignoring projection effects. Second, the lines have widths of and are only marginally resolved with the Chandra HEG. Finally, since most of the line photons observed during come from a cylindrical region along the line of centers, the magnitude of the observed velocity shifts should have been larger than that at , because the wind material in this cylinder is moving right towards the observer at . In other words, the observed projected velocity of is probably close to the true wind velocity of this material. One possibility is that X-ray photoionization inhibits UV driving of the wind and reduces the terminal velocity, in which case the wind is accelerated only up a certain velocity and coasts at a constant velocity (Hatchett & McCray 1977). Another possibility is that most of the emission does, in fact, come from a narrow radius interval near the surface of the companion. In either case, the similarity in the line ratios between the two phases is very difficult to understand.
Similar puzzling behavior has also been observed in a triple star system Ori A (O9.5 II + B0.5 III + early B; Miller et al. 2002) as well as in the isolated B0.2 star Sco (Cohen et al. 2003), which show X-ray line broadening only on the order of . These are again a few times smaller than the terminal wind velocity, and are also smaller than those seen, for example, in a younger O4f star Pup (Kahn et al. 2001; Cassinelli et al. 2001).
Miller et al. (2002) also report evidences against a simple spherically-symmetric wind through absorption line measurements in Cyg X-1. Using several orbital-phase resolved spectra of the source obtained with Chandra, they were able to qualitatively infer the mass distribution in the system that led them to conclude that the wind is focused along the line of centers, most likely through gravitational attraction by the compact object.
4 Fluorescence Line Spectroscopy
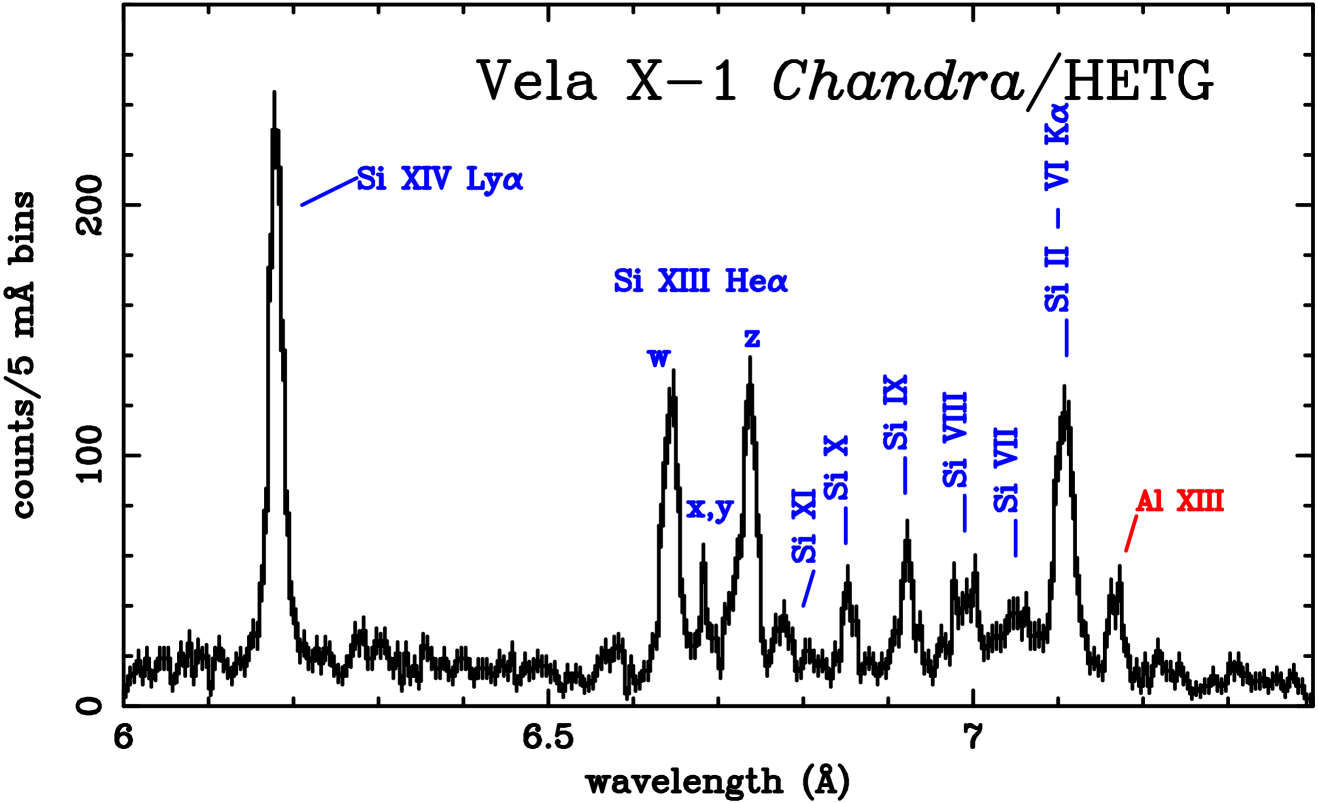
Another very important discovery that resulted from the availability of high resolution data is the detection and identification of K-shell silicon fluorescent lines from a wide range of charge states. Shown in Figure 9 is the HETG spectrum of Vela X-1 observed during . K-shell fluorescent lines from essentially all charge states are detected in this narrow wavelength range, which covers only a few resolution elements of a CCD spectrum. This forest of lines would appear as one narrow (Si XIV) and one broad feature (Si II - XIII) as seen, for example, in the ASCA spectrum of Vela X-1 (see Sako et al. 1999).
Atomic calculations show that the strong line at Å is an unresolved blend of K lines from Si II to Si VI (fluorine-like). The first few charge states (Si II and III), however, probably do not exist in the wind of Vela X-1 due to the presence of a strong ionizing UV field from the companion star. From Si VII (oxygen-like) and higher, the K line complex shifts by mÅ per charge state until Si XII (lithium-like), and, therefore, are well-resolved with the Chandra spectrometers.
Although detailed modeling of the Vela X-1 spectrum is still underway (Liedahl et al. 2003), it is already clear that this provides an extremely powerful spectroscopic tool for studying the structure of stellar winds. Since essentially all of the possible charge states are observed, the sum of the ion column densities yield the absolute total column density through the wind, which is sensitive to the total mass loss rate of the companion star. The column density distribution and the variability with orbital phase also allows us to infer the density spectrum and the clumping properties of the wind.
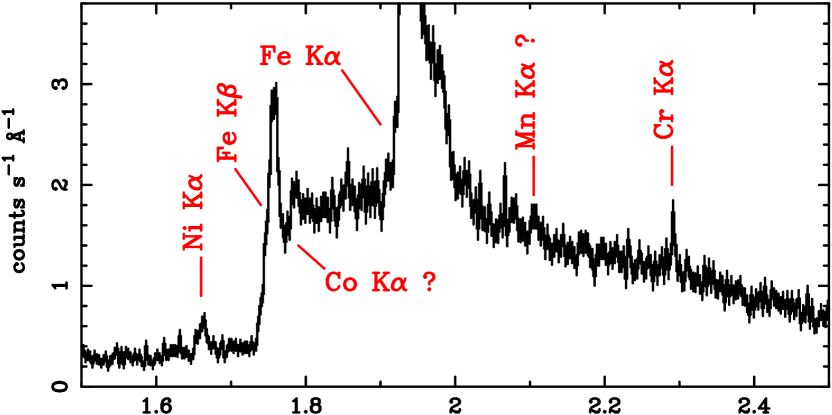
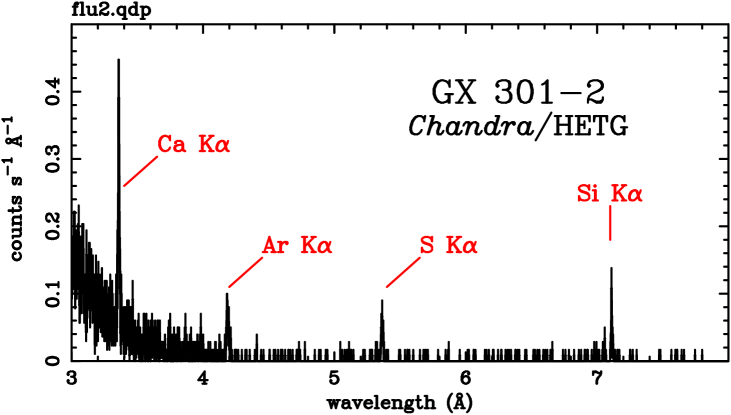
Finally, we note that accurate elemental abundance measurements are also possible with a well-exposed high-resolution spectrum. As shown in Figure 10, for example, emission lines produced under similar physical conditions (neutral fluorescence, in this case) are detected from multiple elements. Although the properties of the foreground as well as the embedded absorber may be rather complex, abundance ratios of elements with similar atomic number can nevertheless be constrained to within reasonable accuracy (%).
5 Compton-scattered Iron Line
The spectrum obtained during the PP observation of GX301-2 shows a spectacular broad feature that extends towards the redward side of the iron Kline, which is identified as a Compton-scattered iron line in a low temperature medium. Compton-scattered iron lines have also been observed in the spectra of several Seyfert galaxies (references) but with much lower statistical significance. The spectrum of GX301-2 shown in Figure 11 contains iron K counts in the narrow component and counts in the Compton shoulder.
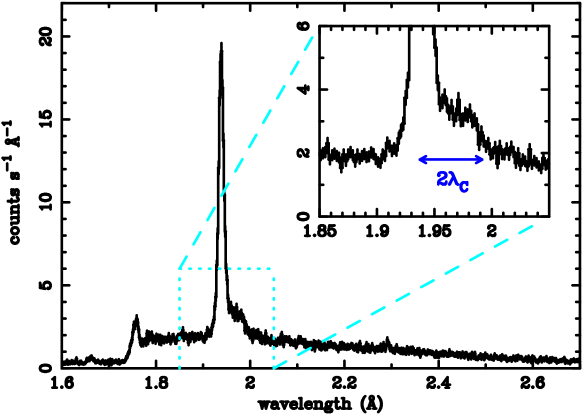
The shape and flux of the Compton profile is sensitive to the electron column density and temperature of the scattering medium. The profile exhibits a rather sharp drop at from the center of the narrow line, which implies that the temperature cannot be much higher than .
A detailed analysis of the spectrum and its temporal variation is presented in Watanabe et al. (2003) using detailed Monte Carlo simulations of the line profile. It is found that the K lines are scattered in the same medium where they are produced. The similarity in the column density inferred from both continuum absorption and the Compton profile suggests that this medium surrounds the X-ray source. The covering fraction of this medium with respect to the neutron star is estimated to be fairly large () from the measured equivalent widths of the emission line and the depth of the corresponding K-shell absorption edge.
Compton broadening can, of course, occur not only in emission lines, but in absorption lines as well. As in the emission line case, an intrinsically narrow absorption line produced in a Compton-thick medium will exhibit a broad red wing down to roughly twice the Compton wavelength. This effect might be relevant for understanding the absorption lines observed in Cyg X-1, which show asymmetric wings towards the longer wavelengths (see, bottom panel of Figure 4).
6 Future Work
High resolution spectroscopic data obtained with the grating spectrometers onboard Chandra and XMM-Newton have provided a dynamical view of the ionized stellar wind in HMXBs. It is clear, however, that much work remains to be done. In particular, detailed physical modeling of each of the individual sources is likely required to understand the wide variety of phenomenology observed in the data. Radiative transfer effects coupled with the wind dynamics may be relevant for interpreting the orbital phase variability of the line spectra seen in some sources. Other purely spectroscopic issues, such as the properties of the Si K fluorescent lines and the Compton recoil spectrum, must be studied in more detail to fully exploit the diagnostic capabilities of high resolution X-ray spectroscopy. Despite the different excitation mechanisms that dominate in HMXB systems and isolated OB stars, comparative studies of their X-ray spectra, particularly between similar spectral types, will be helpful for understanding the wind dynamics and how they are affected by the presence of the orbiting X-ray source. Although additional data will also certainly be helpful for understanding some of the questions raised with the present data, exploratory modeling will likely provide new insight into the physical nature and geometry of the circumsource media in HMXB systems.
References
- [1] Abbott, D. C. 1980, ApJ, 242, 1183
- [2] Brandt, W. N., & Schulz, N. S. 2000, ApJ, 544, 123
- [3] Castor, J. I., Abbott, D. C., & Klein, R. I. 1975, ApJ, 195, 157
- [4] Cassinelli, J. P., Miller, N. A., Waldron, W. L., MacFarlane, J. J., & Cohen, D. H. 2001, ApJ, 554, L55
- [5] Cohen, D. H., de Messières, G. E., MacFarlane, J. J., Miller, N. A., Cassinelli, J. P., Owocki, S. P., & Liedahl, D. A. 2003, ApJ, 586, 495
- [6] Dupree, A. K., Gursky, H., Black, J. H., et al. 1980, ApJ, 238, 969
- [7] Ebisawa, K., Day, C. S. R., Kallman, T. R., Nagase, F. Kotani, T., Kawashima, K., Kitamoto, S., & Woo, J. W. 1996, PASJ, 48, 425
- [8] Hatchett, S., & McCray, R. 1977, ApJ, 211, 552
- [9] Kahn, S. M., Leutenegger, M. A., Cotam, J., Rauw, G., Vreux, J.-M., den Boggende, A. J. F., Mewe, R., & Güdel, M. 2001, A&A, 365, L31
- [10] Kawashima, K., & Kitamoto, S. 1996, PASJ, 48, 113
- [11] Kinkhabwala, A., Sako, M., Behar, E. et al. 2002, ApJ, 575, 732
- [12] Liedahl, D. A., Kahn, S. M., Osterheld, A. L., & Goldstein, W. H. 1990, ApJ, 350, L37
- [13] Liedahl, D. A., & Paerels, F. 1996, ApJ, 468, L33
- [14] Liedahl, D. A., et al. 2003, in preparation
- [15] Lucy, L. B., & Solomon, P. M. 1970, ApJ, 159, 879
- [16] Miller, J. M., Wojdowski, P., Schulz N. S., Marshall, H. L., Fabian A. C., Remillard R. A., Wijnands R., & Lewin, W. H. G. 2002, astro-ph/0208463
- [17] Miller, N. A., Cassinelli, J. P., Waldron, W. L., MacFarlane, J. J., & Cohen, D. H. 2002, ApJ, 577, 951
- [18] Moffat, A. F. J., & Robert, C. 1994, ApJ, 421, 310
- [19] Nagase, F., Zylastra, G., Sonobe, T., Kotani, T. & Inoue, H. 1994, ApJ, 436, L1
- [20] Paerels, F., Cottam, J., Sako, M., Liedahl, D. A., Brinkman, A. C., van der Meer, R. L. J., Kaastra, J. S., & Predehl, P. 2000, ApJ, 533, 135
- [21] Pauldrach, A., Puls, J., & Kudritzki, R. P. 1986, A&A, 164, 86
- [22] Sako, M., Liedahl, D. A., Kahn, S. M., & Paerels, F. 1999, ApJ, 525, 921
- [23] Saraswat, P., Yoshida, A., Mihara, T., et al. 1996, ApJ, 463, 726
- [24] Sato et al. 1986, PASJ, 38, 731
- [25] Schulz, N. S., Canizares, C. R., Lee, J. C., & Sako, M. 2002, ApJ, 564, 21
- [26] van Kerkwijk, M. H., van Paradijs, J., Zuiderwijk, E. J., Hammershlag-Hensberge, G., Kaper, L. & Sterken, C. 1995, A&A, 303, 483
- [27] Watanabe, S., Sako, M., Ishida, M. et al. 2003, ApJL, in press
- [28] Wojdowski, P. S., Liedahl, D. A., & Sako, M. 2001, ApJ, 547, 973
- [29] Wojdowski, P. S., Liedahl, D. A., Sako, M., Kahn, S. M., & Paerels, F. 2003, ApJ, 582, 959
ACKNOWLEDGEMENTS
MS was supported by NASA through Chandra Postdoctoral Fellowship Award Number PF1-20016 issued by the Chandra X-ray Observatory Center, which is operated by the Smithsonian Astrophysical Observatory for and behalf of NASA under contract NAS8-39073. Work at LLNL was performed under the auspices of the U. S. Deparment of Energy by the University of California Lawrence Livermore National Laboratory under contract No. W-7405-Eng-48. SW is grateful for the support by research fellowships of the Japan Society for the Promotion of Science for young Scientists.