Lyman alpha emission in starbursts:
implications for galaxies at
high redshift111Based on observations with the NASA/ESA Hubble
Space Telescope, obtained at the Space Telescope Science Institute, which
is operated by the Association of universities for Research in Astronomy,
Inc., under NASA contract NAS 5-26555
Abstract
We present the results of a high resolution UV 2-D spectroscopic survey of star forming galaxies observed with HST–STIS. Our main aim was to map the profiles to learn about the gas kinematics and its relation with the escape of photons and to detect extended emission due to scattering in gaseous halos. We have combined our data with previously obtained UV spectroscopy on other three star-forming galaxies. We find that the P-Cygni profile is spatially extended, smooth and spans several kiloparsecs covering a region much larger than the starburst itself. We propose a scenario whereby an expanding super-shell is generated by the interaction of the combined stellar winds and supernova ejecta from the young starbursts, with an extended low density halo. The variety of observed profiles both in our sample and in high redshift starbursts is explained as phases in the time evolution of the super-shell expanding into the disk and halo of the host galaxy. The observed shapes, widths and velocities are in excellent agreement with the super-shell scenario predictions and represent a time sequence. We confirm that among the many intrinsic parameters of a star forming region that can affect the properties of the observed profiles, velocity and density distributions of neutral gas along the line of sight are by far the dominant ones, while the amount of dust will determine the intensity of the emission line, if any.
1 Introduction
Galaxies with ongoing star formation display characteristic emission lines whose strength often dominates the appearance of the optical spectrum (Kennicutt, Kobulnicky & Pizagno, 1998). The ionizing radiation from newly formed stars and its interaction with the surrounding gas generate collisionally excited and recombination lines which become detectable at the highest observable redshifts (Melnick, Terlevich & Terlevich, 2000). Model spectra of young populations predict to be the strongest emission line in the optical/near-infrared (IR) spectral range for the simplified assumption of Case B recombination and low metal content (see Schaerer (2002) for a very recent set of model calculations). Therefore Partridge & Peebles (1967) suggested the line as an important spectral signature in young galaxies at high redshift as the expected luminosity could amount to a few percent of the total galaxy luminosity.
Typical fluxes of erg s-1 cm-2 are expected for galaxies at redshifts around 3 with star-formation rates of order M. Such values have been within the reach of even relatively modest-sized instruments for several decades. Major observational efforts were undertaken to search for emission from such galaxies (Djorgovski & Thompson, 1992). Although quite a few emitters powered by starbursts have been found (e.g., Kudritzki et al. (2000), Rhoads et al. (2000), their numbers are generally much lower than expected from the observed star-formation rates and Case B recombination conditions.
The assumption of the intensity as produced by pure recombination in a gaseous medium may be too simple. Meier & Terlevich (1981), Hartmann et al. (1988), Neufeld (1990), and Charlot & Fall (1993) considered the effects of dust on . photons experience a large number of resonant scatterings in neutral atomic hydrogen, thereby increasing the path length and the likelihood of dust scattering and absorption. This process can be very efficient in removing photons from the line of sight to the observer, leading to much lower line strengths in comparison with the idealized Case B. Depending on the aspect angle of the galaxy as seen from the observer, this may lead to a decrease of the equivalent width. On the other hand, may actually be enhanced due to the presence of many supernova remnants which form during the starburst (Shull & Silk, 1979). The net result is controversial. Bithell (1991) finds supernova remnants to be an important contributor to the strength whereas Charlot & Fall (1993) reach the opposite conclusion.
The theoretical situation is sufficiently complex that observational tests are required. The most obvious test are measurements of in local starburst galaxies whose redshifts are sufficiently large to permit observations of their intrinsic outside the geocoronal and Galactic interstellar . Observations of local starbursts have indeed been performed with the IUE satellite (Meier & Terlevich (1981); Hartmann et al. (1988); Calzetti & Kinney (1992); Terlevich et al. (1993); Valls-Gabaud (1993)). Again, the results are controversial. For instance, Calzetti & Kinney and Valls-Gabaud find strengths in agreement with pure recombination theory whereas Hartmann et al. and Terlevich et al. conclude that significant dust trapping of photons must occur.
The superior spectral and spatial resolution of HST’s ultraviolet (UV) spectrographs has allowed new insight into the formation process of . HST–GHRS spectroscopy of eight gas-rich irregular galaxies by Kunth et al. (1998) indicates yet another, and most likely the dominant parameter governing emission: neutral gas kinematics. Kunth et al. found emission with blueshifted absorption in four of the galaxies. In these objects the OI and SiII absorption lines are also blueshifted, suggesting an outflow of the neutral gas with velocities around 200 km s-1. The other four galaxies show broad damped absorption profiles centered on the wavelength of the ionized gas with no detection of emission. The observed galaxies span a metallicity range of more than a factor of 10 and display no correlation between metal abundance and emission strength, a correlation that had been postulated on the basis of the IUE spectra and on theoretical grounds due to the appearance of dust. The velocity structure of the neutral gas in these galaxies is the driving factor that determines the detectability of in emission. When most of the neutral gas is velocity-shifted relative to the ionized regions, the photons can escape, a suggestion supported by recent models of Tenorio-Tagle et al. (1999). Nevertheless, while the velocity structure of the neutral gas is the driver for the detectability of the emission, we want to stress that the amount of dust will still be responsible for the intensity of the line, when observed. The photons not affected by resonant scattering will still be strongly affected by dust extinction, which has a maximum in the UV range, around the wavelength. The properties of the neutral gas (density, kinematics, covering factor) determine thus the shape of the profile and the equivalent width of the line, while the amount of dust drives only its intensity. The implication is that feedback from the massive stars via ionization and the creation of superbubbles and galactic-scale outflows lead to the large variety of profiles. The escape of photons depends critically on the column density of the neutral gas and dust, the morphology of the supershells, and the kinematics of the medium. Since these effects can be highly stochastic, theoretical predictions for the strength are quite uncertain, and empirical guidelines are called for.
A similar pattern seems to apply to high redshift galaxies. At , about half of the galaxies found show in emission (Steidel et al. (1999); Rhoads et al. (2000); Frye, Broadhurst & Benítez (2002)). At the same time, the line is asymmetric, displaying an extension towards larger wavelengths. The blue “edge” of the line could be described as showing a P-Cygni profile, and the centroid of the line is redshifted by some hundred km s-1 with respect to the metallic absorption lines. This is consistent with gas outflows, breakout of the gas bubble produced by the star forming region, and results in the escape of emission.
In order to analyze the spatial (kinematical) structure of the emission in nearby star forming galaxies, we used the Space Telescope Imaging Spectrograph (STIS) on board HST to reobserve three galaxies of the Kunth et al. (1998) sample, two of which clearly showed with GHRS a P-Cygni profile (Haro 2 and IRAS 0833+6517) and a third one that only presented a broad absorption (IZw18). We aimed also to analyze whether could be leaking in external regions, while being completely absorbed around the starburst itself.
The data and data analysis technique are presented in Section 2; the expected structure of an HII region and subsequent effects on the resulting profiles follow in Section 3; the superbubble generated by the HII region and their time evolution are analyzed in Section 4, together with the expected effect on the observed line profile. The general discussion is presented in Section 5, and the particular implications for high redshift galaxies, in Section 6. Finally, Section 7 of the paper presents the summary and conclusions of our work.
2 HST–STIS observations
We list in Table 1 the basic data for the galaxies observed with HST–STIS. The journal of observations is summarized in Table Lyman alpha emission in starbursts: implications for galaxies at high redshift111Based on observations with the NASA/ESA Hubble Space Telescope, obtained at the Space Telescope Science Institute, which is operated by the Association of universities for Research in Astronomy, Inc., under NASA contract NAS 5-26555. We will complement our discussion with some data presented by Thuan & Izotov (1997). These autors analyzed a sample of 3 compact galaxies experiencing strong starbursts. They found emission in only one case, Tol 1214-277. The line was very strong and rather symmetric with no evidence of blueshifted absorption. They concluded that in this case the line was visible because the covering factor of the neutral cloud was small, leaving photons able to escape through paths relatively free of HI gas.
Previous GHRS spectra were taken through the Large Science Aperture (LSA), comprising roughly 17 17 (2″2″for the pre-Costar IZw18 data), centered on the maximum UV continuum. STIS data have been obtained through the 52″05 slit on the FUV MAMA and optical CCD detectors.
In the FUV range the G140M grating was used. The data have been extracted with standard STSDAS procedures. The different integrations obtained were combined and averaged with the MSCOMBINE task to improve the signal to noise ratio. The detector and geocoronal background was removed averaging 100 rows on areas below and above the stellar continuum. While the detector background was negligible for Haro 2 and IRAS 0833+6517, it affected significantly the bluest continuum of IZw18.
Low resolution optical spectra were taken with the STIS CCD using the G430L grating, in order to compare locally the extension and intensity of and optical emission lines, namely [OII], [OIII] and . The optical spectrum of IZw18 was underexposed, but we could clearly detect the extension of the optical lines for Haro 2 and IRAS 0833+6517.
The UV spectral images have a spatial scale of 0029 and a spectral dispersion of 0.053 Å/pix, giving a spectral resolution around 0.15 Å, translating to 37 km s-1 at the wavelength. The optical images have correspondingly scales of 005 and spectral dispersion of 2.7 Å/pix (spectral resolution 6.7 Å). We have multiplied the resulting fluxes by the STIS parameter diff2pt (diffuse to point source conversion factor for absolute photometry), as required for non-extended sources - although resolved, the objects are indeed rather compact.
In the next section we describe in detail the observations object by object.
2.1 Haro 2
We show in Fig. 1 the STIS spectral image of Haro 2 with different scales. The slit is oriented along the minor axis of the galaxy (during a first observation with the slit along the major axis the aperture was unfortunately misplaced due to an observer error). It can be seen that the UV continuum is very compact, extending over only around 09 (corresponding to pc). There is a very strong, quite extended and spatially asymmetric emission line. emission is detected over 7″, 6″ of which are located to the upper (SW) part of the slit. There are hints that the nebulosity is even more extended, at a fainter level, to this direction. The peak of the emission is slightly offset (by 02 or 19 pc) from the peak of the UV continuum. A spatial profile of the emission and the UV continuum is shown in Fig. 2. In Fig. 3 we display the extracted spectrum of the central region of this galaxy.
The most striking result from these data is that the conspicuous and completely black absorption edge affects the blue wing of the profile over the whole region where is detected, at essentially the same velocity. This implies that the neutral gas that causes the resonant scattering is approaching us at around 200 km s-1 and extends over at least 8″(750 pc) with no hint of any velocity structure. We show in Fig 4 the profile at different positions over the slit. The zero in the velocity scale corresponds to the centered at the redshift of the central HII region determined from the optical emission lines. These plots confirm that the blue edge of the profile always appears at basically the same velocity, with variations smaller than 30 km s-1. Note as well that the red wing of the emission profile extends essentially to the same velocity ( km s-1) all along the slit, independently of the peak intensity of the line. As we will discuss later the emission from this wing originates from a receding shell far from the central HII region.
The optical spectral image is shown in Fig. 5. The optical continuum, from 3000 to 5000 Åis very blue and appears to be dominated by very young stars, as illustrated in Fig. 6. The already known Wolf-Rayet feature at around 4686 Å is clearly detected in the spectrum. Emission lines are detected over 15 extent, which corresponds to the core of the line. The optical lines show some asymmetry at the upper part of the slit. The spectrum has enough signal-to-noise so as to measure the total flux of and the OII+OIII lines; these are listed in Table 3, together with the flux. It is important to note that these fluxes are integrated over the same area (1505) hence their ratios reflect the intrinsic local ratios in the gas. The observed ratio is only 2.1, much below the theoretical value 33. Mas-Hesse & Kunth (1999) measured an extinction of =0.22, as derived from the Balmer lines observed through a rather large aperture containing the whole ionized region. With this extinction, the expected ratio would be around 3.4 (assuming a Large Magellanic Cloud (LMC) extinction law in the UV - see Mas-Hesse & Kunth (1999)). This implies that the effect of resonant scattering has lowered the intensity by at least 40%. Nevertheless, we stress that this extinction value represents an average over a large region. Since the Balmer line ratio is not measured with the same spectral resolution as the line, it is not possible to disentangle effects due to dust extinction with those of resonant scattering.
This galaxy exemplifies the paradigm defining the detectability of the emission line: while most of the line emission has been destroyed in this case by dust absorption, the line is still detectable, and indeed quite prominently, due to the kinematical configuration of the neutral gas surrounding the HII region. If there were no dust at all, the line would remain undetectable unless the neutral gas were expanding. On the other hand, if there were not neutral gas at all, both the emission line and the surrounding continuum would experience roughly the same absorption, so that the equivalent width of the line would remain unaffected, independently of the amount of dust. Only the absolute line intensity would be strongly dependent on the presence of dust.
The evolutionary synthesis modelling by Mas-Hesse & Kunth (1999) yielded an age for the starburst episode around 4.8 Myr and more than M⊙ of gas having been transformed into stars. As cited by these authors, there is evidence in Haro 2 of previous recent starburst episodes, which could have taken place in the last 50 Myr.
2.2 IRAS 0833+6517
The STIS spectral images of IRAS 0833+6517 reveal a much more complex structure than Haro 2 (see Fig. 7). The UV continuum shows a patchy distribution, and is extended over 3″ (1.2 kpc) – its limits are diffuse: the UV continuum seems to be even more extended at a lower brightness level. There is also a strong, quite extended and spatially asymmetric emission line. emission is detected over at least 10″ (4.1 kpc). emission shows 2 main peaks: the brightest is slightly offset with respect to the center of the UV emission, 03 (124 pc) to the upper (S) part of the slit. The second peak is also offset, 12 (496 pc) to the lower (N) part of the UV continuum. Some weaker peaks can also be identified on the image. This is shown in Fig. 8, where we plot the spatial profile of the emission, on top of the continuum profile. The extracted spectrum in the region is given in Fig. 9, showing the asymmetric emission line with a broad absorption to the blue.
We show in Fig. 10 the emission profile across different regions. As already found in Haro 2, the blue absorption edge has no any significant velocity structure over at least the 10″ (4.1 kpc) along the slit where emission is detected (the velocity at which the profiles go to zero in the different regions is within the range – km s-1. Here again, the neutral gas in front of the HII region, within at leat 4.1 kpc, is approaching us at basically the same velocity, 300 km s-1. Moreover, the red wing of the emission profile extends to roughly the same velocity, around 700 km s-1, as also found on Haro 2.
We confirm the detection made on the GHRS spectrum of a secondary emission line, blueshifted by around 300 km s-1 with respect to the HII region velocity determined from the optical emission lines. This secondary emission shows some interesting features:
-
•
It is clearly offset from the continuum, peaking at 09 (370 pc) from the UV continuum, to the upper (S) part of the slit. The emission, at a weaker level, extends clearly to the lower (N) part of the slit, at least over the region where there is some UV continuum.
-
•
Although the signal to noise is low, this secondary emission peak shows some velocity structure, with components redshifted by 100 km s-1 from its average centroid. In general, the profile is not a gaussian one and seems to be the convolution of various emissions at different velocities.
We show in Fig. 5 the spectral image of IRAS 0833+6517 taken in the optical range. The continuum has a narrow peak about 03 wide (124 pc), on top of a weaker extension over 2″(826 pc). There is a region to the upper part of the slit which is clearly more conspicuous in the UV than in the optical. It is here where and the forbidden oxygen lines peak. This region is offset by 12 (496 pc) from the optical continuum maximum. We show in Fig. 11 the optical spectra of the bright nucleus and of this region.
We believe that the maximum of the optical continuum is due to relatively older stars, with a weak contribution to the UV and to the ionization. Indeed, coincident with the optical continuum maximum there is a local minimum in all emission lines strengths. The optical continuum shows a very prominent Balmer decrement, as well as Balmer absorption lines of stellar origin, but only in the central region (see Fig. 11). The optical continuum in the upper part, where the emission lines peak, is much bluer and with weaker Balmer decrement and Balmer stellar absorptions, as shown on the figure. González Delgado et al. (1998) presented a detailed analysis of the massive young stellar population in this galaxy based on evolutionary synthesis models. They derived a relatively old age for the burst between around 6 and 7 Myr. These authors concluded that there was a significant dilution by an underlying older stellar population, which we identify indeed with the population producing the maximum of the optical continuum.
Finally, [OII], [OIII] and are detected over 35 (1.4 kpc) and coincide again with the core of the emission. The measured ratio is 2.1, indeed similar to the value measured in Haro 2 (see Table 3). González Delgado et al. (1998) quote a large range of extinction values for this galaxy, with between 0.17 and 0.52. According to these authors, the value derived from the Balmer lines ratio is = 0.52. Assuming this extinction and an LMC law, the expected ratio would be only around 0.28, much smaller than the value measured by us. On the other hand, if we consider the extinction value derived from the continuum fits, with = 0.17, and the same LMC law, the expected ratio would be much higher, 7, indeed significantly higher than the measured value. We conclude again that although the effects of extinction and scattering can not be disentangled, our results show clearly that both effects must significantly affect the observed properties of the emission line.
2.3 IZw18
We show in Fig. 12 the STIS UV spectral image of IZw18. The UV continuum is quite extended (over 2″, corresponding to 97 pc). The total flux within the STIS aperture is around a factor 4 lower than within the GHRS aperture (2″2″, pre-Costar data), which is consistent considering the extension of the source.
A very broad and damped absorption is detected, with complete blackening at the center of the line, as shown in Fig 13. The longer wavelength range of STIS allows for a more complete coverage of the absorption red wing, as compared to the GHRS data from Kunth et al. (1998), confirming the properties of the damped absorption profile reported there. No emission is seen at any position along the slit and regardless the intensity of the continuum. This is clearly understood if the neutral gas covers the whole ionized region with a large column density. This neutral gas must be static with respect to the central HII region all along the region covered by the slit, so that resonant scattering affects all photon emitted by the central HII region. The complete blackening of the absorption profile indicates that essentially all photons have been finally destroyed, most likely by dust absorption.
3 The structure of an HII region and effects on the resulting profiles
An HII region surrounding a cluster of massive newly formed stars should produce an intrinsic emission line with a ratio around 11 and an intrinsic velocity dispersion () similar to the optical Balmer lines one. Nevertheless, there are several factors affecting significantly both the intensity and the profile of the line as observed from outside the HII region. We will discuss the different effects in this section aiming to explain the observed profiles.
The main effects contributing to modify the emission line are the following:
-
•
Absorption by dust. The known extinction curves peak in the far UV range (around 1000 Å), so that the interstellar extinction will be maximum around . As an example, an of 0.2 will yield the absorption of 38% luminosity, but of 96% of the emission – according to the Small Magellanic Cloud law, generally valid in these environments (Mas-Hesse & Kunth, 1999).
As a first approximation, the line and the surrounding continuum should experience the same extinction by dust (assuming there is no neutral gas along the line of sight), so that the equivalent width of the line would not be affected. Therefore, in regions where the continuum is well detected, dust absorption alone could not explain the weakness or even absence of in emission.
Nevertheless, we want to remind that the spatial distribution of stellar continuum sources, ionized gas and dust clouds might be very different, as found in nearby starburst galaxies (see for example the analysis of NGC 4214 by Maíz et al. (1998)). This spatial decoupling might lead to very different extinctions affecting the UV continuum and the emission lines, as discussed by Mas-Hesse & Kunth (1999).
-
•
Scattering by neutral hydrogen. photons travelling through neutral hydrogen will suffer resonant scattering which will re-distribute them within the cloud. This effect dramatically increases the sensitivity of photons to dust absorption. In the presence of neutral hydrogen we therefore expect the complete destruction of photons by dust absorption, even in environments with relatively low dust abundance.
-
•
Presence of expanding shells. The presence of an expanding shell around the HII region can dramatically affect the shape and intensity of the emission line. We have identified 4 major elements:
-
–
If the expanding shell is sweeping the neutral gas, the resonant scattering will affect photons with energy slightly higher than those of the central emission line. As a result, only part of the emission will be able to go through the neutral medium and become visible. P-Cygni like profiles will be expected in these cases, as we will show later.
-
–
If a fraction of ionizing photons escapes the central HII region, the ionization front could reach the internal layers of the shell. We would expect to detect then a redshifted emission component originated at the inner surface of the receding shell.
-
–
In addition, part of the photons produced in the central HII region could be backscattered by the neutral layers of the receding shell to the obsever’s line of sight, appearing also redshifted (with respect to the HII region systemic velocity) by the shell expansion velocity.
-
–
Finally, a recombining region, behind the leading shock, could cause a secondary emission component, which would be observed blueshifted by the shell expansion velocity. Since this component originates outside the neutral shell, it wouldn’t be affected by resonant scattering by the neutral layers.
-
–
We will analyze in the next sections in more details effects related to resonant scattering and the presence of an expanding shell.
3.1 Effect caused by resonant scattering
Neutral hydrogen will scatter resonantly the photons inside the cloud. In Fig. 14 we show the expected absorption profiles produced by a layer of neutral hydrogen with different column densities. Profiles have been computed using the XVoigt code (Mar & Bailey, 1995), assuming a thermal broadening of the neutral cloud with km s-1. The Figure shows how huge are the effects of resonant scattering by neutral hydrogen: for relatively small column densities ( cm-2) the center of the line reaches total absorption. For column densities higher than cm-2, the line becomes damped and the full saturation (hence no transmission) spreads rapidly towards both sides. Remark from the Figure that for cm-2 all photons emitted by particles within a range in velocity of 1000 km s-1 will be completely absorbed. This not only affects the emission line photons, but also those photons from the surrounding continuum emitted by the central cluster of massive stars. Moreover, the wings of the absorption would affect photons at energies corresponding to 4000 km s-1 from the line center.
In principle resonant scattering by neutral hydrogen does not destroy the incident photons. In a completely dust-free cloud, photons would be internally scattered until they reach the external surface of the cloud from where they are able to escape. We would expect photons to leak from the overall surface of the neutral cloud surrounding the HII region, producing a very low surface brightness. Ahn, Lee, & Lee (2001, 2002) have discussed the effects of photons scattering by neutral Hydrogen in a dustless and static medium. They assume that no photon become destroyed (in absence of dust) and then analyze the redistribution in frequencies of the escaping radiation. They predict the formation of a rather narrow absorption trough at the line center, with extended red and blue wings but their profiles differ significantly from the observed ones basically because the effect of dust was not considered in these works. Indeed Kunth et al. (1998) showed that when a static cloud of neutral gas is surrounding the HII region the resulting profile corresponds to a typical Voigt-like absorption line. We stress again that even very small amounts of dust completely destroy all scattered photons via multiple scattering events. Our simulations consider that all photons affected by scattering, according to the corresponding Voigt function, will be finally absorbed by dust and will not be re-emitted.
3.2 Effects caused by an expanding shell
According to the profiles shown in Fig. 14 it would become nearly impossible to detect in emission from starburst galaxies, since they are usually immersed in rather dense neutral clouds. However, we argue that the presence of an expanding shell, with properties evolving concurrently with the central cluster of massive stars, allows for an explanation of the various profiles actually detected in most objects, as discussed in Tenorio-Tagle et al. (1999). In the following discussion the expansion velocity of the shell, , will refer to the velocity of the shell with respect to the central static HII region.
We first show in Fig. 15 the expected profiles when the neutral gas surrounding the HII region is expanding at a certain velocity (), for different HI column densities along the line of sight. As explained above, resonant scattering in the expanding neutral gas affects photons with higher energies than those emitted in the line by the central HII region. As a result, the absorption of photons mostly affects the blue wing of the emission profile producing a classical P-Cygni shape. The damped part of the absorption profile remains completely black and the emission line becomes strongly asymmetric. If the HI column density is high enough (in our example, above around cm-2), the absorption is total and only a broad damped profile would be detected. The resulting spectrum will nevertheless depend on the convolution of different parameters: expanding velocity of the shell, HI column density along the line of sight, intrinsic intensity and width of the central emission line, etc… so that we expect to detect the different cases presented in Fig. 15 almost randomly.
Note that P-Cygni emission profiles show a peak which appears redshifted with respect to the intrinsic line by up to several hundred km s-1. This is shown as an example in Fig. 16. The broader the intrinsic emission line, the redder the peak can appear after partial absorption by an expanding shell. Clearly, the effect of resonant scattering within a dense, expanding neutral shell leading to a redshifted emission peak, should not be taken as evidence for the presence of outflowing ionized gas.
In the presence of a neutral expanding shell we expect to detect interstellar absorption lines associated to the neutral or weakly ionized gas. These will appear blueshifted with respect to the systemic velocity by , as indeed found by Kunth et al. (1998).
If the expanding shell remains symmetric, the internal surface of the receding section of the shell will also affect the observed profile: a fraction of the ionizing photons can ionize this internal surface of the shell. The photons produced by the approaching section of the shell would be immediately scattered by the neutral gas. Since both the ionized and neutral layers are expected to expand at the same velocity, the absorption would be very efficient and no photon can escape. On the other hand photons originated at the receding section of the shell would be emitted with a redshift corresponding to and will be able to travel freely through the approaching neutral layers of the expanding shell.
Moreover, a fraction of the photons scattered by the neutral layers on the receding shell will end being re-emitted on the direction of the line of sight, also with a redshift of , and able to go through the neutral layers of the approaching shell. As a result, we expect to detect an additional emission component peaking at . This component should be broader than the intrinsic line, since the resonant scattering affects photons over a rather wide range of energies. Nevertheless, we expect this component to be rather weak (at a level of few percent of the intrinsic line) producing just a broadening at the red wing of the resulting emission profile since most of the photons affected by scattering would be destroyed by dust. This effect is shown in Fig. 17, where we have plotted the expected resulting profile assuming a component originated at the receding shell (both by photoionization and backscattering) amounting to 10% of the intrinsic emission line.
Ahn, Lee, & Lee (2003) have extended their models Ahn, Lee, & Lee (2001, 2002) to a spherical, expanding supershell. As discussed in Sect. 3.1, these models do not consider the effects of dust absorption, and only allow for multiple backscattering events on the internal layers of the expanding neutral shell, both on the approaching and on the receding sides. After each backscattering photons get an additional redshift of but since no photon destruction is considered several redshifted emission peaks are produced by multiple backscattering. However we argue that when absorption by dust is taken into account, multiple peaks anticipated by these authors would disappear. Moreover, the intensity of the single redshifted peak would be much weaker than their prediction since most photons affected by scattering are destroyed before being back-emitted. We have not performed a line transfer model to reproduce this effect. We just qualitatively show that both backscattered photons and the ones originating at the internal, ionized layers of the expanding shell, will produce an additional weak and broad emission component centered at around .
Finally, an ionized region can develop at the external shock front of the shell. The recombining medium immediately behind the shock front would produce an additional emission line unaffected by resonant scattering. This emission line observed at a blueshift corresponding to the expansion velocity of the shell, , if present, would fill partially the damped absorption profile. Its redshifted counterpart, on the other hand, will be scattered and fully absorbed within the large column density of neutral matter in the receding part of the shell.
The above discussion aims to confront the reader with the view that there are many parameters related to the structure of the HII region that affect the resulting profile. In particular, the velocity and density structure of the neutral gas along the line of sight seems to be a dominant factor for the visibility of the line.
4 emission in starburst galaxies: an evolutionary view
In realistic cases, bubbles and superbubbles generated around an HII region will evolve with time, in parallel with the evolution of the massive stars themselves. As a result, the physical conditions that the photons experience when escaping from the HII region will differ drastically. Therefore the expected profiles will be strongly dependent on the geometry and evolutionary state of the starburst.
We show in Fig. 18 the predicted evolution of the expanding shells generated by an HII region as they interact with the disk and the halo of the host galaxy. The figure makes use of the results from the numerical calculations presented in Tenorio-Tagle et al. (1999), and illustrates in a simplified way the different elements that determine the properties of the emission profile. We have identified 6 basic steps, as follows:
-
i)
Initially, when a star-forming episode starts, a central HII region begins to develop. At this phase, if the neutral gas surrounding the starburst region has HI column densities above 1014-15 cm-2, an absorption line centered at the systemic velocity of the galaxy will be visible, independently on the viewing angle. If the total HI column density along the line of sight is higher than around 1018 cm-2, a damped absorption profile will be detectable. It is important to stress that during this early phase the Balmer lines will be strongest, due to the high ionizing flux produced by the most massive stars.
-
ii)
The situation changes drastically and becomes a strong function of viewing angle, once the mechanical energy released by the starburst is able to drive a shell of swept up matter to exceed the dimensions of the central disk. Then, upon the acceleration that this shell experiences as it enters the low density halo, it becomes Rayleigh–Taylor unstable and fragments. This event allows the hot gas (composed basically by matter recently processed by the starburst), to stream with its sound speed between fragments and follow the shock which now begins to form a new shell of swept–up halo matter. Another consequence of blowout is the fact that the ionizing photons from the recent starburst are now able to penetrate into the low density halo, and manage to produce an extended conical HII region that reaches the outskirts of the galaxy. Given the low densities in the halo it is likely that this matter will remain ionized for a time that well exceeds the duration of the starburst activity. This also implies that some UV photons are at this stage able to stream freely into the inter galactic medium. The predicted expansion speed of this second shell formed in the halo would be around several hundred km s-1.
An observer looking then at the starburst through the conical HII region will be able to detect the strong emission line produced by the central HII region, centered at the systemic velocity of the galaxy. On the other hand, an observer looking outside the conical HII region will still detect a broad absorption profile at any evolutionary state.
-
iii)
Sooner or later, recombination will begin to be frequent enough in the expanding shell. This will cause a strong depletion of the ionizing radiation which formerly was able to escape the galaxy after crossing the extended conical HII region. Recombination in the expanding shell will produce an additional component, which the observer will detect blueshifted according to the expansion velocity of the shell, . Clearly, if the shell were symmetrical and one could see the emission coming from the whole of it, a top-hat line profile would have to be added to the central HII region emission line. If only a fraction of the shell is observed, we would expect to see 2 additional emission peaks centered at .
-
iv)
There are three efects that eventually lead to the trapping of the ionization front within the expanding shell.
-
–
The first one is the increasingly larger amount of matter swept into the expanding shell, as this ploughs into the halo.
-
–
The growth of the shell dimensions also implies less UV photons impinging, per unit area and per unit time, at the inner edge of the shell.
-
–
Finally, in the case of a nearly instantaneous starburst, the production of UV photons starts to decrease drastically (as ) after the first 3.5 Myr of evolution.
The trapping of the ionization front will yield the formation of a neutral layer at the external side of the expanding shell. All these effects lead then to an increasingly larger saturated absorption, as the external neutral layer will resonantly scatter the photons. As discussed above, this absorption will be blueshifted with respect to the photons emitted by the central HII region by , leading to the formation of a P-Cygni profile with a fraction of the intrinsic emission beeing absorbed.
In addition, the profile will be contributed by the radiation arising from the receding section of the shell, both by recombination on the ionized layer, and by backscattering of the central photons by the neutral layer. Since this contribution will be redshifted by 2 with respect to the absorbing layer, it will be essentially free from resonant scattering and will be able to escape the region almost unaffected.
Under such circunstances the resulting emission line will be strongly depleted, showing a very asymmetric profile with a sharp blue edge and a line centroid shifted towards the red at a different from the rest velocity of the host galaxy. The red wing of this profile will be furthermore broadened by the contribution from the receding shell.
-
–
-
v)
Under some conditions (for specific values of the shock velocity and halo density ), the leading shock front may become radiative. An additional component would thus arise as the shocked gas undergoes recombination. This should happen after a cooling time (); where , is the cooling rate and the Boltzmann constant). Thus a combination of shock speed and density of the background halo may lead to a smaller than the dynamical time and at that moment emission will be produced as the shocked gas recombines. This additional emission component would appear blueshifted at , and wouldn’t be absorbed being ahead of the HI layers.
-
vi)
At a later phase, the shell will be completely recombined and have already substantially slowed down its expansion. will show a broad absorption with only a small blue shift. The recombination lines from the HII region will be very weak.
The scenario here presented assumes a non-steady state of the star formation process. It implies therefore either a (nearly) instantaneous starburst or the first phases of a star formation episode extended in time. In the case of a continuous star formation regime, a steady state where the birth and death of massive stars balances, so that the ionizing flux remains basically constant, is achieved only after the first 15 Myr of evolution (Cerviño & Mas-Hesse, 1994). If the process is active for much longer periods of time, the shell will finally blowout in the intergalactic medium, and no emission lines with P-Cygni profile would be expected, but pure emission or absorption, depending on the orientation.
5 General discussion
Fig. 19 shows three GHRS low resolution examples corresponding to typical cases as described above. T1214-277 shows a prominent and symmetric emission line. The large equivalent width of the line ( Å) points to a very young starburst. We postulate that this object would correspond to steps ii–iii above. In IRAS 0833+6517 the ionization front has already been trapped, so that a neutral layer has already developed, giving rise to a blueshifted absorption and the corresponding P-Cygni profile (step iv). Moreover, an additional blueshifted emission component can be easily identified in higher resolution images (see Fig. 9), as proposed in step v. Finally, SBS 0335-052 shows a very broad, damped absorption line. This could hint to a very young object (step i), or to a geometrical effect, if we were observing from outside the ionization cone and through dense layers of static neutral gas.
In this section we discuss in more detail the observed properties of the different objects considered, and how they fit within the proposed scenario.
SBS 0335-052: SBS 0335-052 is a metal-deficient blue compact galaxy which is hosting a very strong star-forming episode. Its morphology and properties were described by Thuan, Izotov & Lipovetsky (1997). They identified 6 super star clusters containing an equivalent of 4500 ionizing O7 stars. This galaxy is embedded in a large HI cloud with a mass of . The HI column density along the GHRS aperture measured by these authors is very large, N(HI) = cm-2. The observational properties of SBS 0335-052 would be consistent with step i: a very young starburst starting to ionize the surrounding medium while a significant amount of HI gas remains in front of the massive stars and is still static with respect to the central HII region. As a result, while a strong emission line spectrum is seen in the optical, the spectral region around is completely absorbed, showing a damped absorption profile, similar to the ones computed in Fig. 14.
Kunth et al. (1998) identified the OI and SiII absorption lines attributed to the neutral gas at the same redshift than the central HII region. Thuan & Izotov (1997) postulated the presence of two additional OI and SiII absorption systems blueshifted by 500 and 1500 km s-1, which might indicate that some layers of HI could be starting to be accelerated by the release of mechanical energy from the starburst, as expected in step i (see Fig. 18a).
Fig. 20 shows the presence of a marginal excess emission in the wings of the Voigt profile, suggesting an intrinsically very strong emission line. We have fitted the intrinsic profile that would produce such an excess, after convolution with the absorption expected by the large amount of neutral gas, deriving a very strong emission with Å, consistent with a very young and powerful starburst.
IZw18: The GHRS high resolution spectrum of IZw18 was first discussed by Kunth et al. (1994) and reanalyzed by Kunth et al. (1998). It ressembles very much the spectrum of SBS 0335-052, with a broad, damped absorption profile corresponding to an HI column density cm-2. IZw18 is also a metal deficient blue compact galaxy surrounded by a dense cloud of neutral hydrogen. Kunth et al. (1998) showed that the OI and SiII interstellar absorption lines were at the same redshift than the central HII region, indicating that the neutral gas is unperturbed and mostly static with respect to the starburst region.
As discussed above, no emission is detected along the STIS slit, suggesting that a static neutral gas cloud completely covers the ionized region with a large column density along the line of sight. This case seems in principle to be similar to SBS 0335-052. Nevertheless, while the starburst in this latter galaxy seems to be very young, there are hints for a continued massive star formation activity in IZw18 over the last 10–15 Myr (Mas-Hesse & Kunth, 1999), although at a rather weak rate. Moreover, large supershells and ionized filaments have been identified in this galaxy by Martin (1996). The observer might be looking in this case through the large amounts of static neutral gas expected outside the conical HII region, which could be located along the supershells detected in the optical.
T1214-277: The low resolution GHRS spectrum of T1214-277 has been described in detail by Thuan & Izotov (1997). This very low metallicity galaxy () hosts a very young and massive starburst. As these authors quote, this galaxy has a large equivalent width (70 Å). Campbell, Terlevich & Melnick (1986) measured also a very large equivalent width ( Å within a aperture). No any intrinsic extinction was measured by these authors from the Balmer lines ratios (but note that the Galactic extinction alone, with = 0.06, destroys around 45% of photons in the region). The high equivalent widths and the absence of WR features (Pagel et al., 1992) indicate that the starburst in T1214-277 has to be younger than 3 Myr, time at which the first massive stars enter the WR phase at low metallicities (Mas-Hesse & Kunth, 1999).
These observational results indicate that T1214-277 could be at the end of step ii, as explained above: a conical HII region would have already developed, so that an observer looking through it could detect the strong emission produced by the central HII region without significant distortion.
In Fig. 21 we show a detail of the emission profile in velocity scale. The profile is broadened, with 2 symmetric secondary peaks located at km s-1 from the central emission peak. We postulate that the starburst in this galaxy may be indeed already entering step iii, so that recombination within the expanding shell produces the additional components. Since only a fraction of the shell is seen through the GHRS aperture, the observer detects only 2 additional peaks centered at . The velocity derived for the shell (300 km s-1) is within the expected range (few hundred km s-1) and is similar to velocities measured in the other starburst galaxies with P-Cygni profiles.
Haro 2: Haro 2 is a well studied, rather metal-rich blue compact galaxy. As described by Lequeux et al. (1995) and Kunth et al. (1998) Haro 2 shows a prominent emission line, with a clear P-Cygni profile. The metallic OI and SiII interstellar absorption lines are detected at around -200 km s-1 with respect to the central HII region, without any significant absorption feature detected at the redshift of the HII region. Haro 2 would be the prototype of our step iv, with a shell of neutral gas expanding at around 200 km s-1 with respect to the central HII region, ploughing into a low density, ionized halo without a screen of static neutral gas.
From the STIS long slit spectral images (Fig. 1) we can identify all the features expected in step iv:
-
•
The emission decreases rapidly bluewards of the velocity at which the emission peak originated from the central HII region. The flux goes to zero at basically the same velocity all along the slit. As discussed in Sect. 2, this is consistent with an expanding shell of neutral gas which has to be much more extended than the 8″ over which the absorption is detected in order to behave as a plane-parallel slab. From the analysis of long-slit spectroscopy Legrand et al. (1997) found evidence for the presence of an ionized expanding shell over a region around 25″ in diameter (nearly 2.4 kpc). The lateral edges of the shell appeared at the same systemic velocity than the central HII region, decoupled, as expected, from the disk rotation. The line is also clearly broadened at the edges, in good agreement with what would be expected from an expanding shell.
As explained above, step iv foresees that as the starburst evolves, the trapping of the ionization front will yield the formation of a neutral layer at the external side of the expanding shell, with no static neutral gas inside the shell. This would produce the kind of profile we detect on the central region of Haro 2 (see Figs. 3 and 15).
-
•
At the same time, recombination on the internal layers of the shell produces additional emission components at , in this case at 200 km s-1. While the blueshifted emission component produced in the internal layers will be destroyed by resonant scattering on the external neutral layers (both expanding at the same velocity), this blueshifted emission should be detectable in . Legrand et al. (1997) concluded indeed that the emission profile (when looking straight into the starburst region) showed evidence for two additional weak components at 200 km s-1.
These results indicate that a section of the shell receding at the same velocity should also be present. The internal part of the receding shell would produce photons, as it generates ones. And the neutral layers of the receding shell would backscatter in addition some photons produced at the central HII region. Since the receding neutral gas lies at - with respect to the central HII gas it scatters the blue wing of the intrinsic emission profile. A key point is that this receding shell lies at with respect to the approaching shell, so that the photons emitted or backscattered there traverse unaffected the approaching neutral layers and reach the observer redshifted by . As a result, we expect an extended, broad and weak component of photons centered at around +200 km s-1 in the case of Haro 2 (see the example in Fig. 17).
This is exactly what we detect in our spectral images (Fig. 1). A weak extended emission is detected at both sides of the central HII region on the slit, but especially to the upper side. It results from the photons originating from or backscattered by the receding shell. We show in Fig. 4 the profiles of this emission at several arcseconds from the central HII region. The profiles show:
-
–
In both parts of the slit, SW and NE of the central HII region, the blue edge of the emission profile lies at the same velocity: the approaching neutral shell is destroying all photons blueshifted with respect to the velocity of the central HII region.
-
–
Broad extentions up to around km s-1. Profiles are more symmetric than the central emission line and their peaks are clearly redwards of the peak. Both profiles show quite extended red wings at basically the same velocity. These wings originate by recombination and backscattering in the ionized and neutral layers of the receding shell, respectively. Since the scattering process affects photons within a high range of velocities, as shown in Fig. 4, the backscattered component should cover basically the same velocity range measured on the absorption profile. We consider indeed that the good agreement between the terminal velocity of the P-Cygni profile (around 500 km s-1) and the terminal velocity of the extended emission profile (around 500km s-1) supports our interpretation.
-
–
IRAS 0833+6517: As discussed in Sect. 2, emission in IRAS 0833+6517 has a more complex structure than in Haro 2 (see Fig. 7). In addition a secondary emission is conspicuous on top of the damped absorption. Nevertheless, the overall properties of the emission are very similar between both galaxies:
-
•
The flux vanishes bluewards of the same wavelength along the slit (hence the same velocity) whenever emission is detected (10″, 4.1 kpc). The extension of the neutral gas shell has to be very large in this galaxy, reaching a diameter close to 10 kpc.
-
•
S and N of the central region where is in emission, we detect again an extended broad and weak component redshifted with respect to the central HII region by around 300 km s-1. The terminal velocity of the profile all along the slit is at around 700 km s-1. As in Haro 2, we associate this component to the emission originated at the receding shell, both by the ionized inner layers and by backscatter in the neutral external layers.
We therefore argue that the superbubble phase in IRAS 0833+6517 corresponds to step iv in our model. The presence of an additional emission component on top of the absorption profile blueshifted by around 300 km s-1 with respect to the central HII region, supports our interpretation that an expanding shell is moving towards the observer at this velocity. As explained in step v, the leading shock in this galaxy should have become already radiative, undergoing recombination and originating the secondary emission line we detect at the velocity of the shell. The fact that this secondary emission does not appear affected by neutral gas scattering indicates that the HI column density in front of the expanding shell (either static or also expanding) has to be rather small, as expected in our model. The smaller spatial extension of this secondary emission indicates that only a fraction of the whole surface of the leading shock is undergoing recombination. Conditions given in step v strongly depend on the density of the halo, which is most likely not uniform, explaining the patchiness of this emission.
We have overplotted in Fig. 22 our high resolution STIS spectrum of IRAS 0833+6517 over the lower resolution GHRS one presented by González Delgado et al. (1998). This comparison exemplifies how the analysis of P-Cygni profiles at low resolution may yield misleading results. The asymmetry of the intrinsic profile translates into an artificial redshift of the emission line peak when observed at low resolution (in addition to the effect discussed in Sect. 3, Fig. 16). This effect might be especially severe when analyzing galaxies at high redshift with medium or low resolution spectra. Furthermore, the lower resolution does not allow to identify the damped, black absorption plateau (which in this case is partially filled by the secondary emission peak), preventing an accurate derivation of the intervening HI column density.
We want to remark that our model provides a simplified scenario for the formation of P-Cygni profiles in starburst regions. The actual geometry and kinematical structure of some objects, like IRAS 0833+6517, might be significantly more complicated, although the overall view should still be valid. Let us highlight some observational properties that may be relevant:
-
•
Kunth et al. (1998) were not able to detect the interstellar OI 1302.2 and SiII 1304.4 lines in their high resolution GHRS spectrum. The analysis of the lower resolution data from González Delgado et al. (1998) shows that both lines are blended within a very broad absorption profile, which in fact was extended over most of the Kunth et al. (1998) GHRS wavelength range. González Delgado et al. (1998) report also very broad profiles on other interstellar lines, with FWHM up to around 1000 km s-1. They interpret these broad absorption profiles as evidence of large-scale motions of the interstellar gas around the starburst region.
-
•
The SiIII 1206 absorption line detected bluewards of 1230 Å is split into two components (see Figs. 7 and 9). While the weakest component is centered at the redshift of the central HII region, the strongest one appears blueshifted by around 470 km s-1, which is higher than the expansion velocity attributed to the shell. González Delgado et al. (1998) also found from lower resolution GHRS spectra that the interstellar SiII1260 and CII 1335 were blueshifted by 450 – 520 km s-1 with respect to the central HII region. We want to stress that no emission at around 500 km s-1 can be detected. Therefore the high velocity gas has to be contained within the expanding shell.
We conclude that while the bulk of the neutral gas shell seems to be expanding at around 300 km s-1, some gas might be moving within the shell in a rather chaotic way at significantly higher velocities.
Other galaxies: The model we have proposed could also explain the observational properties of the line in other starbursts studied up to now. IIZw70 and Mrk36, discussed by Kunth et al. (1998), and Tol 65, presented by Thuan & Izotov (1997), would be similar to IZw18 and SBS 0335-052: they show a damped broad absorption profile, and their interstellar absorption lines appear at the redshift of the central HII region. The HI gas is therefore static along the line of sight with respect to the HII region, either because their starburst episodes have not been able to accelerate the gas (being very young or weakly energetic compared to the amount of neutral gas surrounding them), or because we are observing them through the densest part of the HI disk. In this latter case emission could possibly leak from other regions (for instance if an ionizing cone is allowing the photons to escape) and they might be scattered to our line of sight.
We are presently performing a survey with HST–ACS looking for regions in this kind of galaxies where photons could be leaking. Preliminar results appear in Kunth et al. (2003).
Other galaxies studied by Kunth et al. (1998), like ESO 400-G043 and ESO 350-IG038, showing P-Cygni absorption and blueshifted interstellar lines, would also be in the state described by our step iv, which seems to be the most frequent one among the galaxies showing emission.
We want finally to stress that the expanding layer causing the typical P-Cygni line profile in starburst galaxies is extended and can span several kpc across a galaxy. As discussed above, in some objects this can be traced across several hundreds of pc away from the main burst of recent star formation. In the case of IRAS 0833 this spans more than 2.2 kpc across the galaxy. Our observations thus prove that this is not a well localized phenomenon, but rather a large scale one affecting the whole central region of these galaxies. Nevertheless, to explain the properties of this emission (lack of structure and clumpiness, velocity dispersion and intensity) the low density medium or halo of the host galaxy, into which the shell propagates, has to be very extended so as to allow for the existence of a continuous shell with similar properties (column density, velocity, etc…) over dimensions 1 kpc. If this were not the case and the expansion had reached the galaxy edge, upon blowout the shell would have become Rayleigh-Taylor unstable and would have rapidly broken while destroying the absorbing layer. Thus, although the asymmetric line profiles are indicative of strong outflows, these do not certify that supergalactic winds, venting the metals from the newly formed starbursts into the inter-galactic medium, have already developed. In fact if the expanding shell could reach the edge of its host galaxy, becoming Rayleigh-Taylor unstable and fragmenting, the line profile to be observed would be the almost unattenuated line produced by the central HII region, without any absorption by neutral gas but not the kind of profiles generally observed.
6 Implications for galaxies at high redshift
It is expected that all galaxies have undergone a phase of rapid star formation at a certain stage of their evolution. During this phase they should have become very powerful producers of ionizing photons. Very strong emission lines are therefore expected from these objects, and with rather large equivalent widths. For redshifts above , the emission line would be observable in the optical range, making it therefore a priori an optimal tracer of star formation. Nevertheless, the first searches did not detect emitters. It has been only recently that emission from galaxies at redshifts above has been detected, but at average luminosities weaker by 2 orders of magnitude than expected (see Rhoads et al. (2000) for a complete set of references concerning emission at high redshift).
Our analysis of emission line properties in nearby starburst galaxies has shown that there are several issues affecting the shape and intensity of the line, so that only in a small fraction of the cases the full intrinsic emission would be detectable. In this section we will extrapolate our results to high redshift galaxies, aiming to estimate the expected properties of emission in these objects.
Star-forming episodes detected in galaxies at redshift seem to be significantly stronger than those detected in compact galaxies in the nearby Universe (see Shapley et al. (2001), Shapley et al. (2003) and references therein). Nevertheless, the properties of the emission profiles are very similar to those observed in local starbursts. Lyman Break Galaxies exhibit a broad distribution of strengths and profile-types, ranging from damped absorptions to pure emission, including also P-Cygni-like absorption and emission combinations (Shapley et al., 2003). Asymmetric P-Cygni profiles have also been detected by Frye, Broadhurst & Benítez (2002), Pettini et al. (2000, 2001), among other authors (see also Heckman (2001) and Rhoads et al. (2000)).
Pettini et al. (2001) observing Lyman Break galaxies found velocity offsets of the interstellar absorption lines with respect to the velocity of the HII region, assumed to be at the systemic velocity of the galaxy. They found blue velocity offsets between approximately and km s-1, in three-quarters of the objects, with a median value of km s-1. More recently, Shapley et al. (2003) have obtained a composite spectrum by combining the data 811 individual Lyman Break galaxies. This spectrum reveals that the strong low-ionization interstellar features appear blueshifted with respect to the systemic velocity by an average of km s-1. Moreover, the mean velocity of the interstellar SiIV doublet is close to km s-1, indeed very similar to the value measured for low ionization lines. As discussed above, the presence of blueshifted interstellar lines hints directly to the presence of neutral shells expanding at few hundred km s-1, as concluded by Pettini et al. (2001) and Shapley et al. (2003). On the other hand the simultaneous detection of SiIV at roughly the same velocities suggests that the internal layers of the expanding shells are probably ionized, as discussed above. This range of velocities is consistent with the predictions for a wind-blown shell, as we have seen. On the other hand, these authors found the emission lines to be always redshifted with respect to the HII regions. The offsets measured for in the galaxies showing blueshifted interstellar absorptions span a range between around 200 and around 600 km s-1. The composite spectrum of Shapley et al. (2003) gives a mean redshift of km s-1 for the peak with respect to the systemic velocity. As explained above this is exactly what one expects if the central starbursts were driving a neutral (or partially ionized) expanding shell (see Fig. 16).
Pettini et al. (2000) show a high resolution, high signal to noise ratio spectrum of MS 1512–cB58, a galaxy at . They found a weak and asymmetric emission line, redshifted by around km s-1 with respect to the HII region, on top of a damped absorption with (HI) cm-2, blueshifted by km s-1 (in agreement with the interstellar lines). At this rather high HI column densities the absorption profile is very broad, allowing only a small fraction of the intrinsic emission line photons to escape. A careful analysis of their Fig. 4 shows the presence of a broad red wing, extending up to km s-1(velocity measured with respect to the HII region). We postulate that this red wing component might be the emission originated at the receding part of the shell, either by recombination or by backscattering of photons from the central HII region, as discussed above. We expect this component to be broader the higher the HI column density, since backscatter would affect photons at increasingly high velocities. The presence of the broad red wing provides additional support to the existence of a rather symmetrical expanding shell being energized by the central starburst.
Asymmetric emission profiles have also been detected by Frye, Broadhurst & Benítez (2002) on a sample of eight lensed galaxies at high redshift, . Interstellar absorption lines have also been detected in some of these galaxies, but unfortunately the redshift of the central HII region is not available. They found an offset between the redshift of the interstellar lines and that of the emission centroid in the range 300–800 km s-1. If we assume that the interstellar lines are tracing a neutral shell expanding at around 200–300 km s-1 with respect to the central HII region, the lines detected would be redshifted by up to around 400–500 km s-1 at most, in agreement with the predictions and with other galaxies. Note that Frye, Broadhurst & Benítez (2002) always quote the offset between and the interstellar lines as to be the local redshift of the profile, something which is misleading since the shift with respect to the HII region has to be necessarily smaller. Finally, most of the profiles plotted by Frye, Broadhurst & Benítez (2002) in their Fig. 13 show a weak broadening of their red wing, in agreement with the model discussed in this work.
Another important result obtained by Shapley et al. (2003) from their analysis of Lyman Break Galaxies is that the emission strength increases as the kinematic offset between the emission peak and the low-ionization interstellar absorption lines decreases. In addition, the equivalent width in emission increases as the interstellar lines become weaker. We interpret these effects as an evidence that the lower the neutral gas column density, the smaller the relative redshift of the emission peak and, correspondingly, the stronger the emission. This is in very good agreement with our above discussion (see for example Fig 16).
We therefore conclude that the properties of the emission profiles are very similar in local starbursts and in high redshift galaxies. Nevertheless, there are some differences between both kinds of objects, which have to be taken into account for a correct interpretation of the data:
-
•
Since the star-forming episodes observed at high redshift are very powerful ones, we expect intrinsically very strong emission lines, with emission extending over several hundreds km s-1 at the base of the line. Even accounting for HI column densities around 1020 cm-2, photons at the red wing of the emission profile will be able to escape. Therefore, most of these high redshift galaxies experiencing strong starbursts should show emission, albeit reduced by large factors from their intrinsic luminosity. Only galaxies with HI column densities above cm-2 will show a damped absorption.
-
•
For the same reasons we expect the observed emission lines to appear redshifted with respect to the systemic velocity of the galaxies by a broad range of velocities, up to several hundred km s-1. This effect should be smaller in local starbursts, since the emission lines would be intrinsically weaker (and therefore narrower at their base). If no other line is available to measure the redshift, one should bear in mind that the derived value is only an upper limit of the galaxy redshift, and that the real one might be indeed smaller by several hundred km s-1.
-
•
The spectra presented by Frye, Broadhurst & Benítez (2002) show a feature which only appears for galaxies at high redshift: the forest, that significantly lowers the average continuum bluewards of . As a result, the blue wing of the absorption produced by the local expanding shell can not be identified in low resolution data.
On the other hand, the presence of asymmetric profiles together with a discontinuity in the continuum (the average continuum redwards of being stronger than bluewards of the line) should allow to identify in surveys aiming to estimate redshifts of galaxies at high redshift.
-
•
Stellar absorption lines might be important at low resolution, artificially decreasing the observed intensity of the emission line. At high resolution the stellar profiles can be detected and taken into account when measuring the line flux, but at low resolution both profiles might be blended and the emission line substantially hidden (see Valls-Gabaud (1993)).
It is clear from the above discussion that using the emission line as a tracer of star formation episodes might lead to severe errors. We remark that both the measured line intensity, and thus the star formation rate derived from it, as well as its velocity, have to be considered as respectively lower and upper limits only. The problem might be especially significant in the case of star formation rates derived from luminosities, which might be underestimated by more than an order of magnitude.
From the above discussion we see that P-Cygni profiles are predicted only when the supperbubble has entered the phase in which the ionisation front is trapped by the sector of the shell which is evolving into the extended halo. It has been noted in Tenorio-Tagle et al. (1999) that P-Cygni profiles are seen in galaxies that are on the higher luminosity side of the distribution () in their sample. Similarly, at high redshift the Lyman Break Galaxies (hereafter LBG) exhibit similar profiles, as discussed above. Hence despite the much larger strength of the starbursts they are hosting, when compared to local ones, the HI gas is still present between the HII region and the observer. In particular this implies that in all these cases the ionizing radiation has to be trapped, and that a low density halo is surrounding these objects - as discussed above, without this halo the shell would have been disrupted and no P-Cygni profile would be produced.
It is interesting to enlight this result with the constraints on the Lyman continuum (hereafter LyC) radiation from galaxies. Most of the previous observations of galaxies below the Lyman break (Leitherer et al., 1995; Hurwitz, Jelinsky & Dixon, 1997) as well as recent measurements obtained from FUSE observations (Deharveng et al., 2001; Heckman et al., 2001) show that the fraction of ionizing stellar photons that escape the ISM of each galaxy is small, if any. Most estimates led to an escape fraction . However these figures are in constrast with a LyC escape fraction larger than 50% reported by Steidel, Pettini & Adelberger (2001) obtained from a composite spectrum of galaxies at = 3.4. Indeed starburst galaxies at large redshift have a higher UV luminosity than most local starbursts studied so far. This would imply more photons for ionizing the gas and probably an easier escape. However this difference remains a puzzle since one must reconcile two facts that seem to contradict each other. One is the leaking of the UV LyC and the other is the presence of P-Cygni profiles. The very presence of these P-Cygni profiles testifies that a substantial amount of HI is present, and hence should act as a screening agent against the escape of the LyC. One way out would be to assume that the HI layers are very perturbed and chaotic, so that they do not completely cover the massive stellar clusters. However the emission that would escape from regions devoided of neutral gas should be overwhelming, resulting in a symmetric emission profile. We predict therefore that LyC photons would be detected mostly on galaxies showing strong and quite symmetric emission lines, rather than in objects showing typical P-Cygni profiles. As far as we know, no relation has yet been established between the fraction of escaping LyC and the emission profile in galaxies hosting starbursts at any redshift.
There is a final point we want to remark. As discussed at the end of Sect. 4, the detection of P-Cygni favours short-lived (or nearly instantaneous) bursts rather than steady state, long lasting star formation processes. After long-lasting star formation episodes the expanding shell would have finally blown-out in the intergalactic medium, and no P-Cygni profiles would be expected on the lines. We would rather expect to detect pure emission or absorption, depending on the orientation of the line of sight with respect to the disk of the galaxy. In the case of short-lived starbursts, the usual concept of star formation rate (amount of gas mass being transformed into stars per unit time) becomes meaningless: in most starbursts, massive star formation has probably ceased already few Myr ago. It might be therefore misleading to derive the star formation rate density at high redshift from the analysis of galaxies which are forming stars in short bursts. To solve this inconsistency we propose to parameterize the strength of these star forming episodes by the total amount of gas transformed into stars, rather than by the rate of star formation, and to reevaluate accordingly the history of star formation in the early Universe. This analysis is out of the scope of this work, and will be presented in a forthcoming paper.
7 Summary and conclusions
Our findings have important implications for the study of profiles in star-forming galaxies in particular, and for super-bubble evolution and galactic winds in general. We find that the P-Cygny profiles are extended, smooth and span several kiloparsecs covering a region much larger than the starburst and comparable or larger than the host galaxy itself. This strongly suggests the existence of an expanding super-shell generated by the mass and energy loss of the starburst interacting with an extended low density gaseous halo.
We identify six phases in the predicted evolution of a super-shell that correspond to the different types of profiles observed.
-
i)
The early phase. In a very young starburst the recombination lines will be at their maximum strength and will show a broad absorption centered at the systemic velocity of the galaxy. SBS 0335 could be in this stage.
-
ii)
The emission phase. The super-shell breaks, ionizing radiation escapes into the low density halo fully ionizing a “bi-conical” region. is in emission at the systemic velocity of the galaxy.
-
iii)
Late emission phase. Recombination starts to dominate in the expanding shell producing an additional component shifted by the shell expanding velocity. T1214 would be at the end of phase ii, starting already this phase.
-
iv)
Shell recombination phase. Recombination dominates this phase characterized by a strong P-Cygni type profile in . The absorption component is blue shifted by , the expansion velocity of the shell. emission is strongly depleted and the centroid of its profile is shifted toward the red. Backscattering and emission from the receding part of the shell may give raise to an extended red wing in the observed profile.
-
v)
If the leading shock becomes radiative an additional unabsorbed and blue shifted component of may be produced.
-
vi)
Late phase. The shell is almost completely recombined and has substantially slowed down its expansion. will show a broad absorption with only a small blue shift. The recombination lines from the HII region will be very weak.
These 6 phases and the associated 4 different profiles are able to describe, both qualitatively and quantitatively, the variety of observed profiles in both the nearby HST sample and high redshift star–forming galaxies. Given that the probability of occurrence of a given profile depends mainly on the age of the starburst (and also on the orientation) the observed fraction of systems in the different phases will provide important information to critically test the predictions of this scenario.
Our results stress the importance of the density and kinematical structure of the neutral gas surrounding an HII region on the detectability of the emission. The observed properties of the emission line will be a convolution of several effects. While the amount of dust alone determines only the absolute intensity of the emission line, but not affecting its equivalent width, the kinematical configuration of the neutral gas is the driving factor for its final visibility, and its profile shape – from broad absorption to pure emission. The fact that several independent effects play such a significant role on the properties of the observed emission lines explains the lack of correlations established in the past between the emission strength and other properties of different starburst galaxies. The use of as a tracer of star formation rate, and even as a redshift indicator for galaxies at high-z, should be done with care, always being aware of its limitations.
References
- Ahn, Lee, & Lee (2001) Ahn, S., Lee, H., & Lee, H. M. 2001, ApJ, 554, 604
- Ahn, Lee, & Lee (2002) Ahn, S., Lee, H., & Lee, H. M. 2002, ApJ, 567, 922
- Ahn, Lee, & Lee (2003) Ahn, S., Lee, H., & Lee, H. M. 2003, MNRAS, 340, 863
- Bithell (1991) Bithell, M. 1991, MNRAS, 253, 320
- Calzetti & Kinney (1992) Calzetti, D.& Kinney, A.L. 1992, ApJ, 399, L39
- Campbell, Terlevich & Melnick (1986) Campbell, A., Terlevich, R.J. & Melnick, J. 1986, MNRAS, 223, 811
- Cerviño & Mas-Hesse (1994) Cerviño, M.& Mas-Hesse, J.M. 1994, A&A, 284, 749
- Charlot & Fall (1993) Charlot, S.& Fall, S.M. 1993, ApJ, 415, 580
- Davidge (1989) Davidge, T.J. 1989, PASP, 101, 494
- Deharveng et al. (1986) Deharveng, J.-M., Joubert, M., Bixler, J., Bowyer, S. & Malina, R. 1986, A&A, 154, 119
- Deharveng et al. (2001) Deharveng, J.-M., Buat, V., Le Brun, V., Milliard, B., Kunth, D., Shull, J.M. & Gry, C. 2001, A&A, 375, 805
- Djorgovski & Thompson (1992) Djorgovski, S. & Thompson, D.J. 1992, IAUS 149: The Stellar Population of Galaxies, 337
- Frye, Broadhurst & Benítez (2002) Frye, B., Broadhurst, T. & Benítez, N. 2002, ApJ, 568, 558
- González Delgado et al. (1998) González Delgado, R.M., Leitherer, C., Heckman, T., Lowenthal, J.D., Ferguson, H.C. & Robert, C. 1998, ApJ, 495, 698
- Hartmann et al. (1988) Hartmann, L.W., Huchra, J.P., Geller, M.J., O’Brien, P. & Wilson, R. 1988, ApJ, 326, 101
- Heckman (2001) Heckman, T.M. 2001, ASP Conf. Ser. 240: Gas and Galaxy Evolution, 345
- Heckman et al. (2001) Heckman, T.M., Sembach, K.R., Meurer, G.R., Leitherer, C., Calzetti, D. & Martin, C.L. 2001, ApJ, 558, 56
- Hurwitz, Jelinsky & Dixon (1997) Hurwitz, M., Jelinsky, P. & Dixon, W.V.D. 1997, ApJ, 481, L31
- Kennicutt, Kobulnicky & Pizagno (1998) Kennicutt, R.C., Kobulnicky, H.A. & Pizagno, J.L. 1998, Bulletin of the American Astronomical Society, 30, 1354
- Kudritzki et al. (2000) Kudritzki, R.-P.et al. 2000, ApJ, 536, 19
- Kunth et al. (1994) Kunth, D., Lequeux, J., Sargent, W.L.W. & Viallefond, F. 1994, A&A, 282, 709
- Kunth et al. (1998) Kunth, D., Mas-Hesse, J.M., Terlevich, E., Terlevich, R., Lequeux, J. & Fall, S.M. 1998, A&A, 334, 11
- Kunth et al. (2003) Kunth, D., Leitherer, C., Ostlin, G., Mas-Hesse, J.M, Petrosian, A. 2003, ApJ, in press
- Legrand et al. (1997) Legrand, F., Kunth, D., Mas-Hesse, J.M. & Lequeux, J. 1997, A&A, 326, 929
- Leitherer et al. (1995) Leitherer, C., Ferguson, H.C., Heckman, T.M. & Lowenthal, J.D. 1995, ApJ, 454, L19
- Lequeux et al. (1995) Lequeux, J., Kunth, D., Mas-Hesse, J.M. & Sargent, W.L.W. 1995, A&A, 301, 18
- Maíz et al. (1998) Maíz-Apellániz, J., Mas-Hesse, J.M., Muñoz-Tuñón, C., Vílchez, J.M. & Castañeda, H.O. 1998, A&A, 329, 409
- Mar & Bailey (1995) Mar, D.P. & Bailey, G. 1995, Proc. ASA, 12, 239
- Margon et al. (1988) Margon, B., Anderson, S.F., Mateo, M., Fich, M. & Massey, P. 1988, ApJ, 334, 597
- Martin (1996) Martin, C.L. 1996, ApJ, 465, 680
- Martin (2001) Martin, C.L. 2001, ApJ, 558, 56
- Mas-Hesse & Kunth (1999) Mas-Hesse, J.M., Kunth D. 1999, A&A, 349, 765
- Meier & Terlevich (1981) Meier, D.L.& Terlevich, R. 1981, ApJ, 246, L109
- Melnick, Terlevich & Terlevich (2000) Melnick, J., Terlevich, R. & Terlevich, E. 2000, MNRAS, 311, 629
- Neufeld (1990) Neufeld, D.A. 1990, ApJ, 350, 216
- Pagel et al. (1992) Pagel, B.E.J., Simonson, E.A., Terlevich, R.J. & Edmunds, M.G. 1992, MNRAS, 255, 325
- Partridge & Peebles (1967) Partridge, R.B.& Peebles, P.J.E. 1967, ApJ, 148, 377
- Pettini et al. (2000) Pettini et al. 2000, ApJ, 528, 96
- Pettini et al. (2001) Pettini et al. 2001, ApJ, 554, 981
- Rhoads et al. (2000) Rhoads, J.E., Malhotra, S., Dey, A., Stern, D., Spinrad, H. & Jannuzi, B.T. 2000, ApJ, 545, L85
- Schaerer (2002) Schaerer, D. 2002, A&A, 382, 28
- Shapley et al. (2001) Shapley, A. E., Steidel, C. C., Adelberger, K. L., Dickinson, M., Giavalisco, M., & Pettini, M. 2001, ApJ, 562, 95
- Shapley et al. (2003) Shapley, A. E., Steidel, C. C., Pettini, M., & Adelberger, K. L. 2003, ApJ, 588, 65
- Shull & Silk (1979) Shull, J.M.& Silk, J. 1979, ApJ, 234, 427
- Skillman & Kennicutt (1993) Skillman, E.D. & Kennicutt, R.C. 1993, ApJ, 411, 655
- Steidel et al. (1999) Steidel, C.C., Adelberger, K.L., Giavalisco, M., Dickinson, M. & Pettini, M. 1999, ApJ, 519, 1
- Steidel, Pettini & Adelberger (2001) Steidel, C.C., Pettini, M. & Adelberger, K.L. 2001, ApJ, 546, 665
- Tenorio-Tagle et al. (1999) Tenorio-Tagle, G., Silich, S.A., Kunth, D., Terlevich, E. & Terlevich, R. 1999, MNRAS, 309, 332
- Terlevich et al. (1993) Terlevich, E., Diaz, A.I., Terlevich, R. & Vargas, M.L.G. 1993, MNRAS, 260, 3
- Thuan, Izotov & Lipovetsky (1997) Thuan, T.X., Izotov, Y.I. & Lipovetsky, V.A. 1997, ApJ, 477, 661
- Thuan & Izotov (1997) Thuan, T.X. & Izotov, Y.I. 1997, ApJ, 489, 623
- Valls-Gabaud (1993) Valls-Gabaud, D. 1993, ApJ, 419, 7
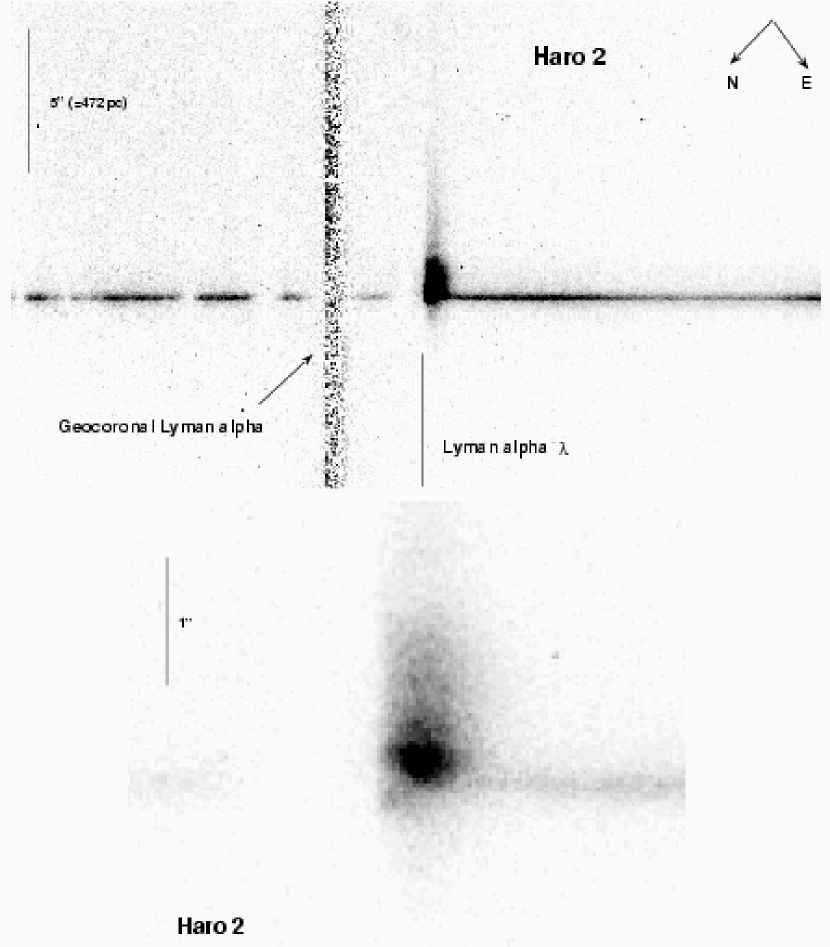
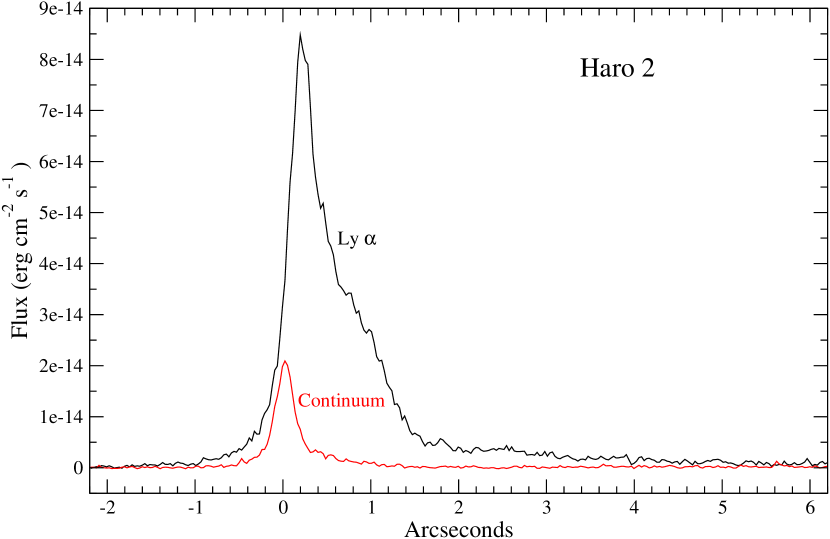
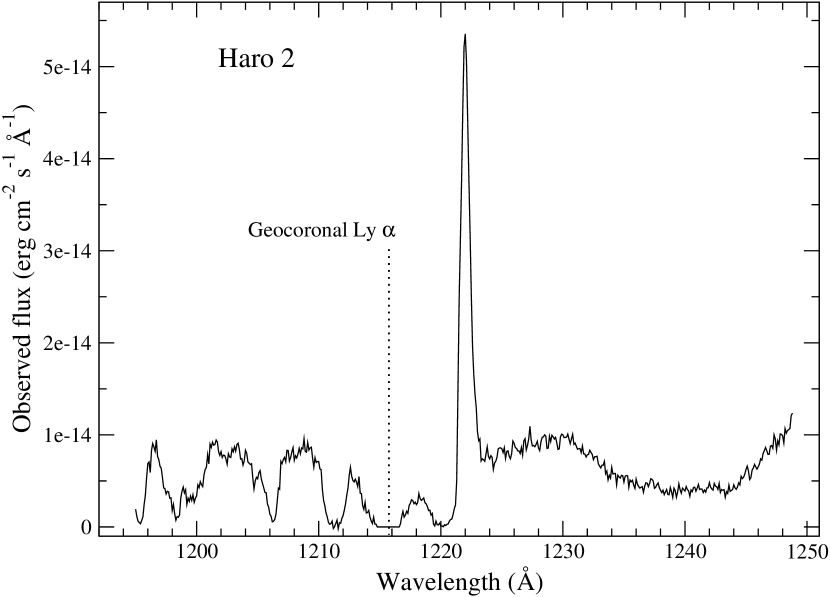
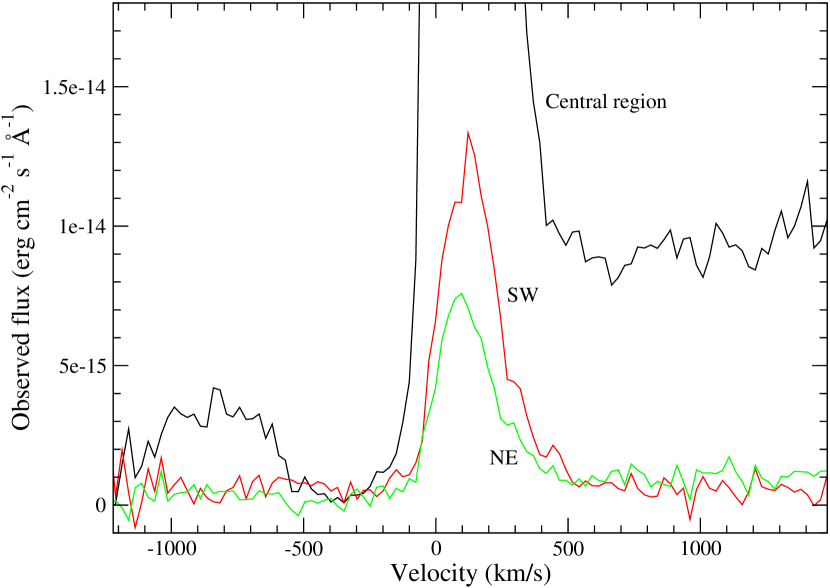
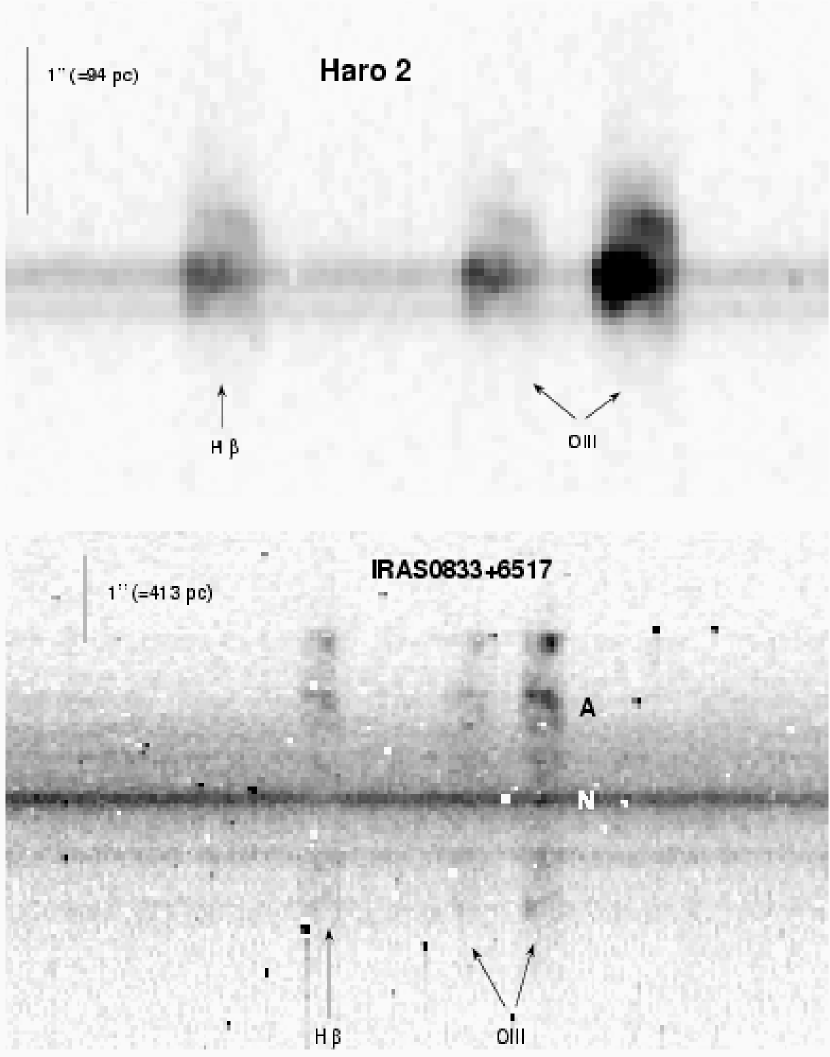
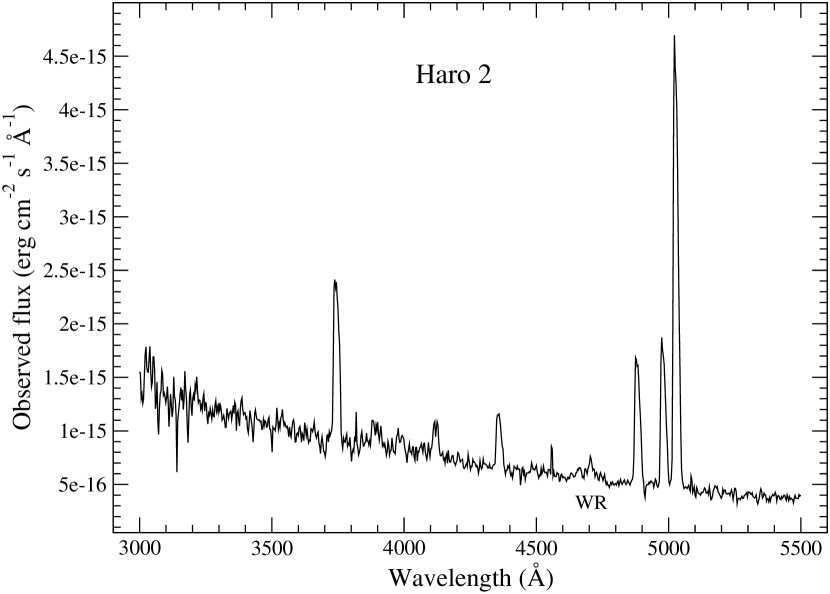
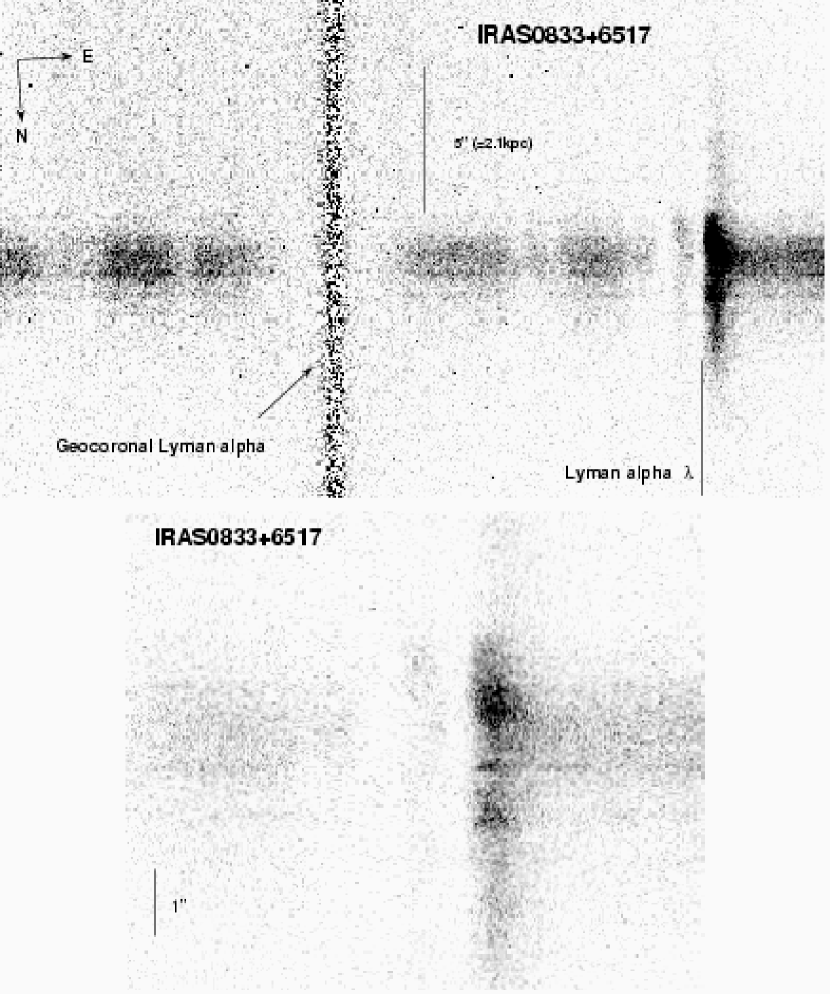
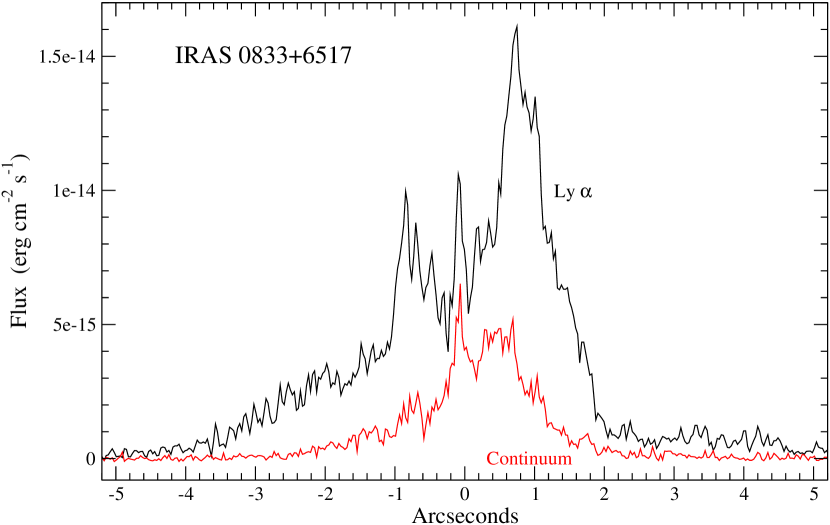
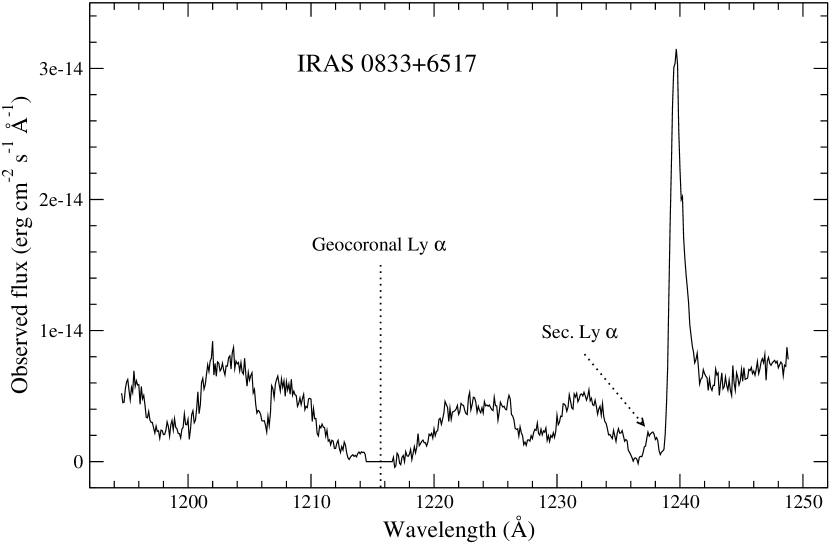
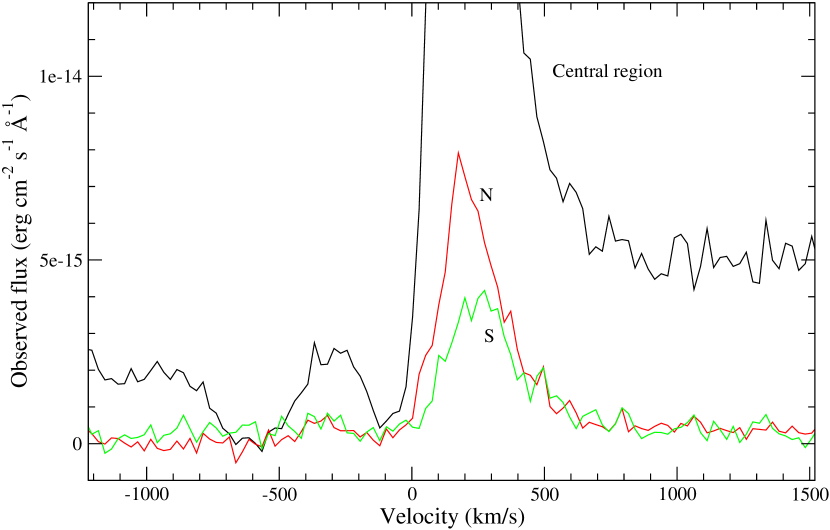
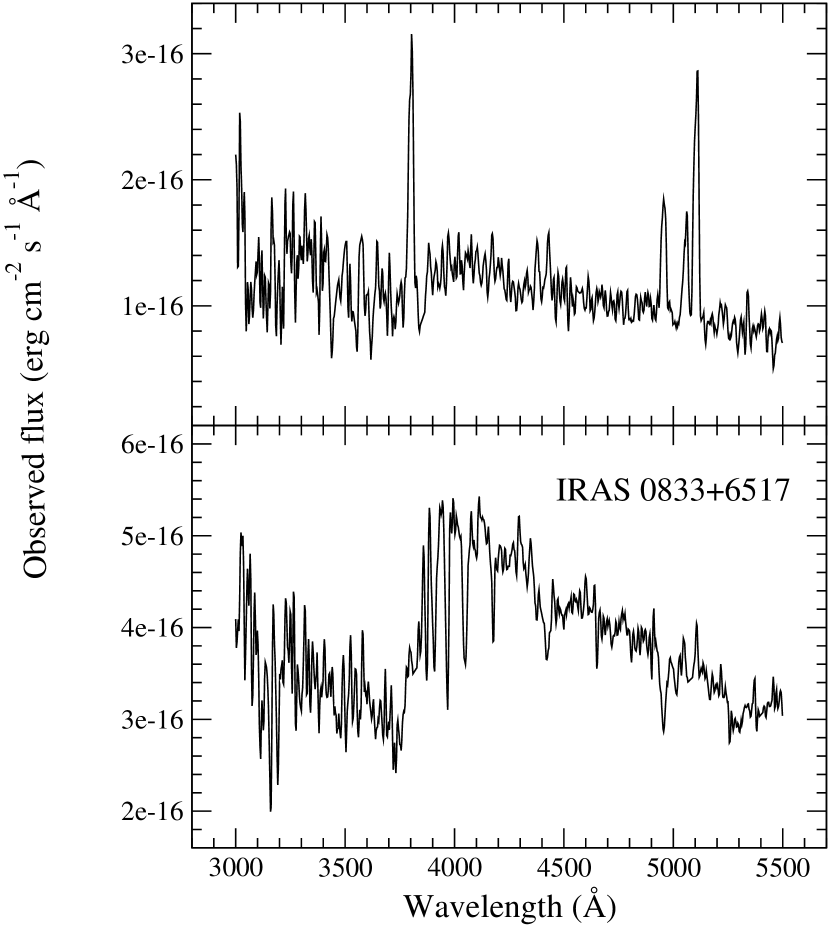
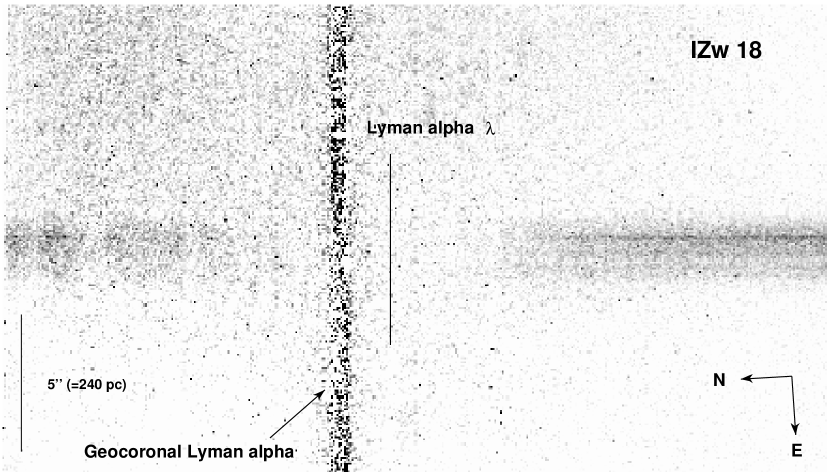
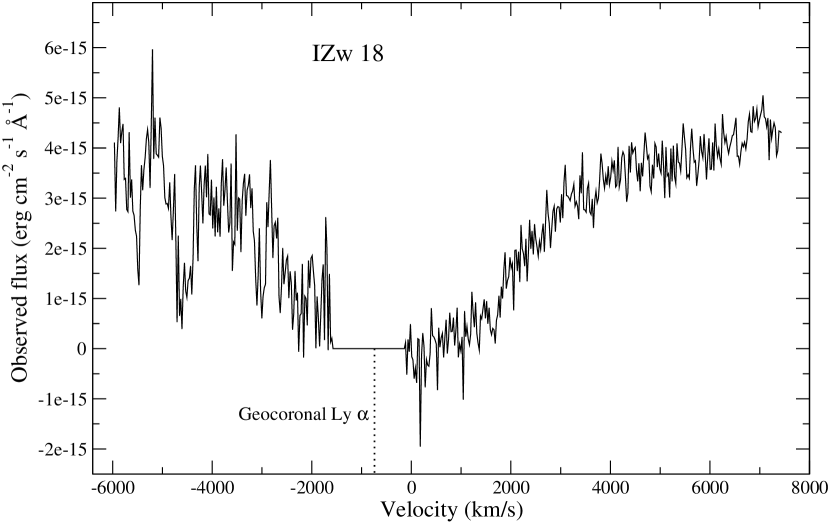
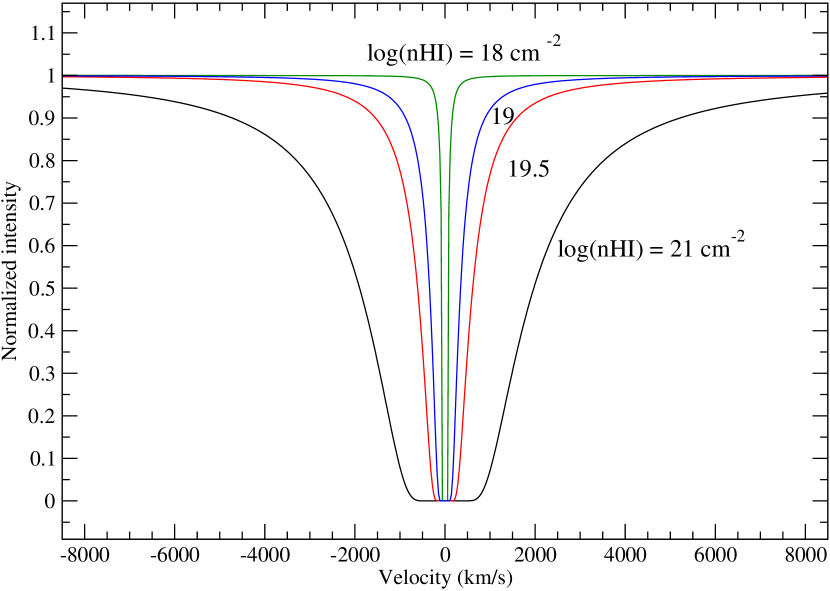
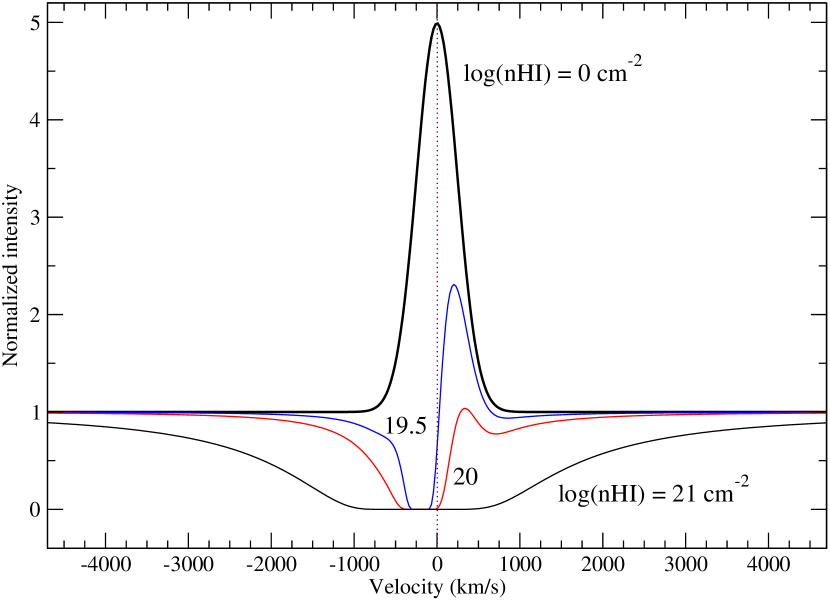
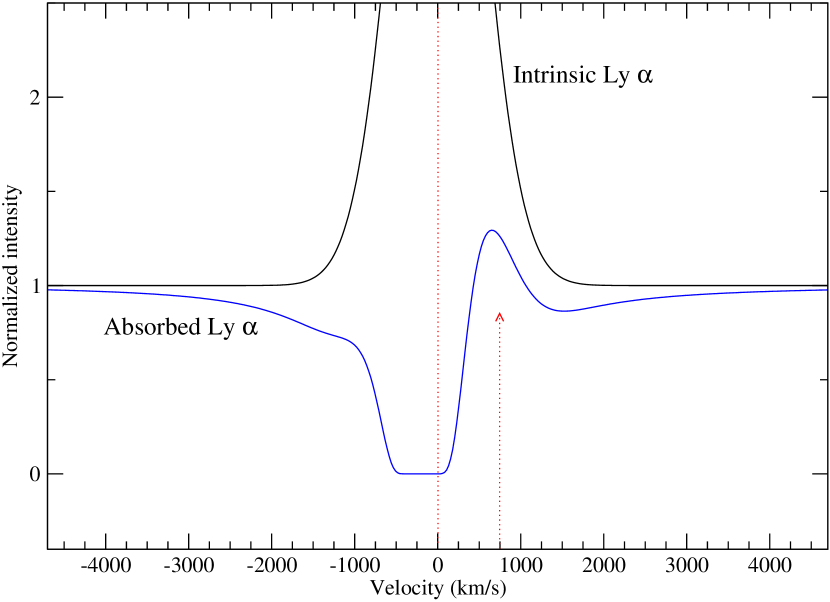
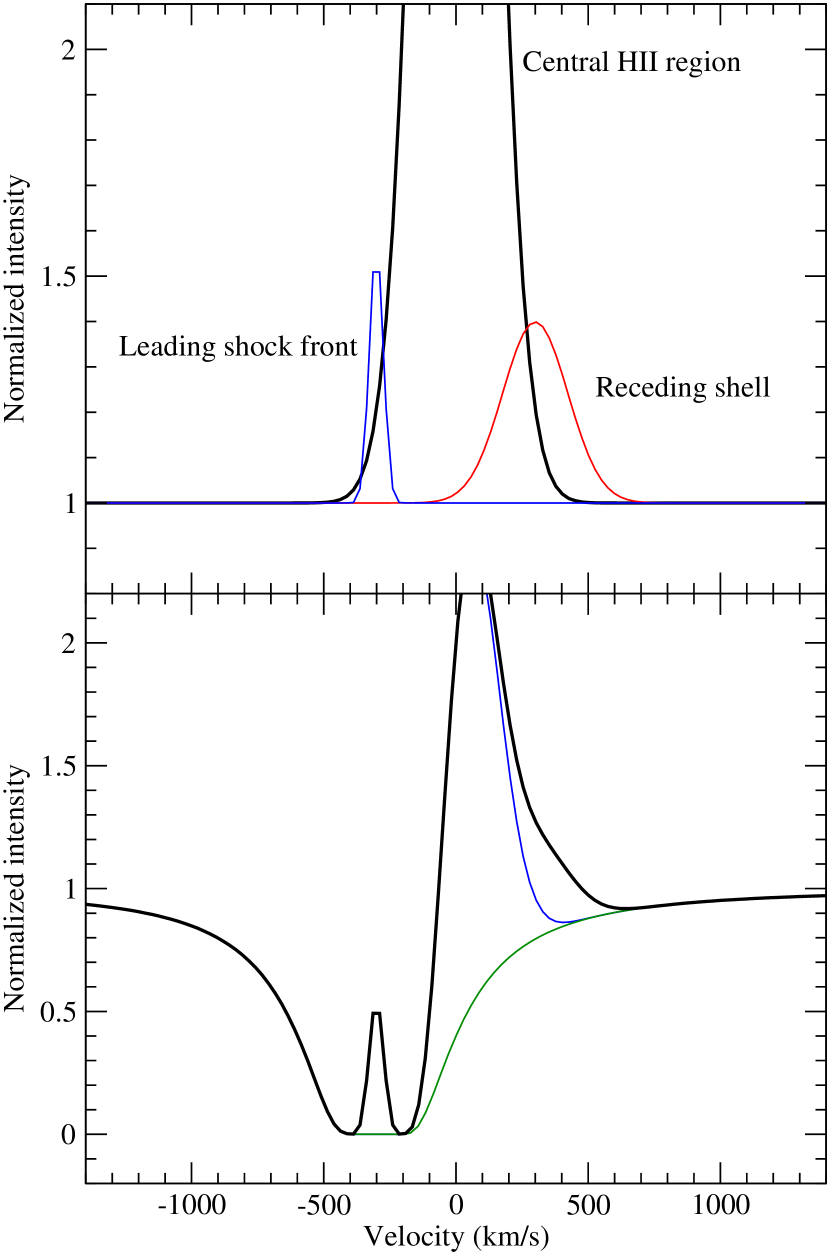
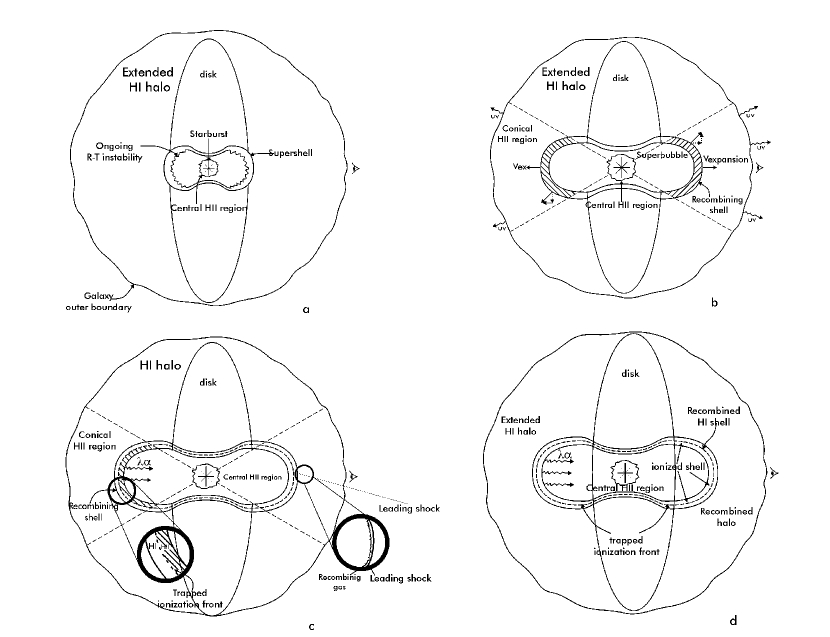
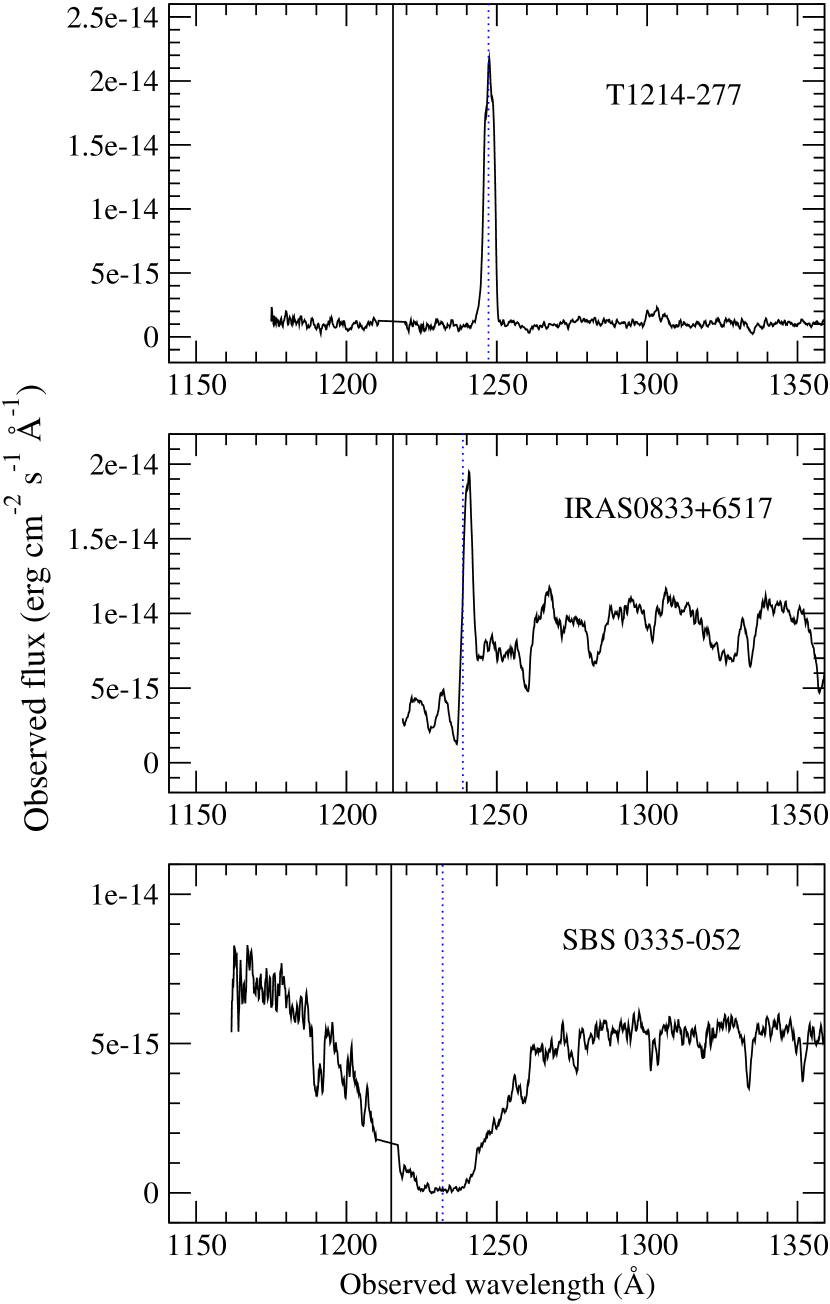
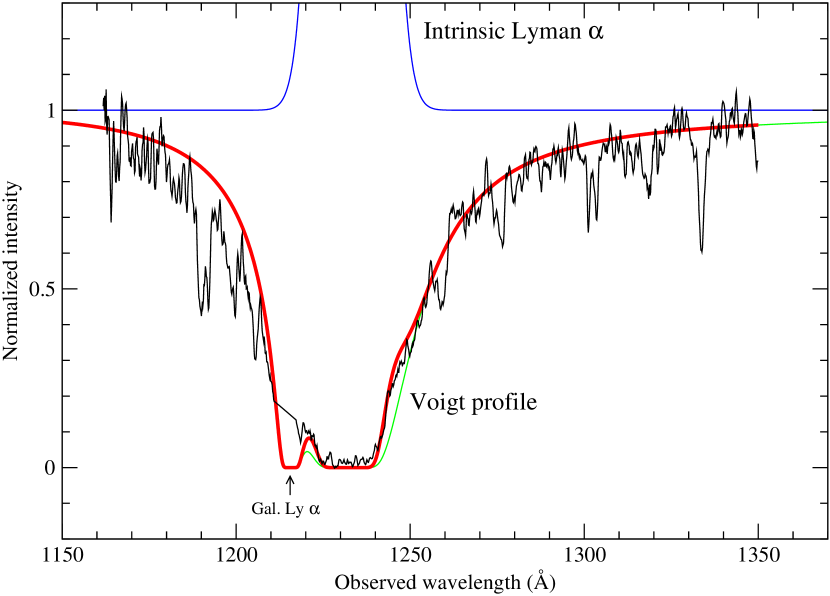
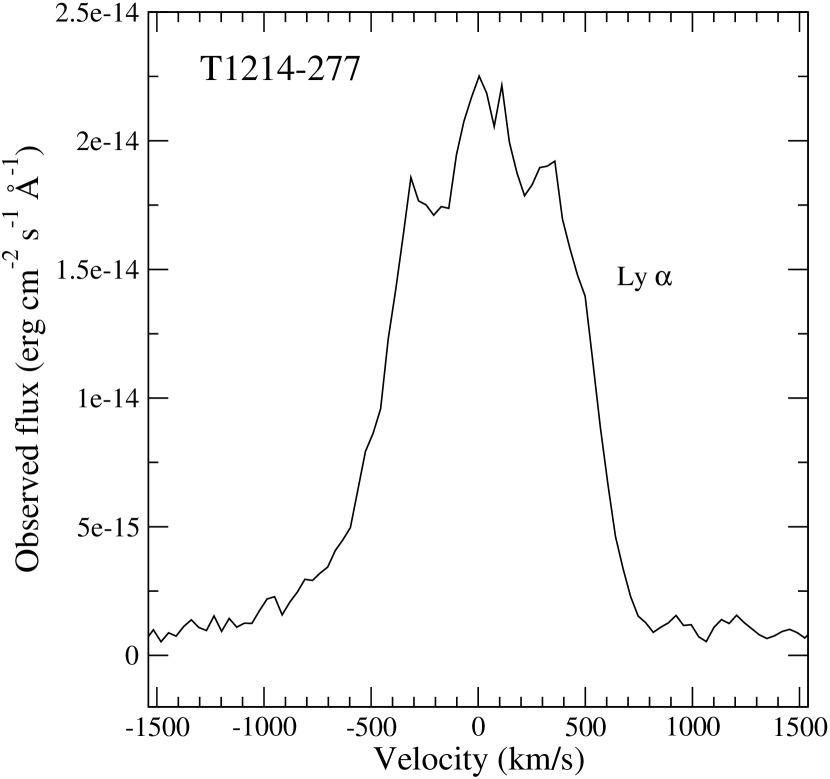
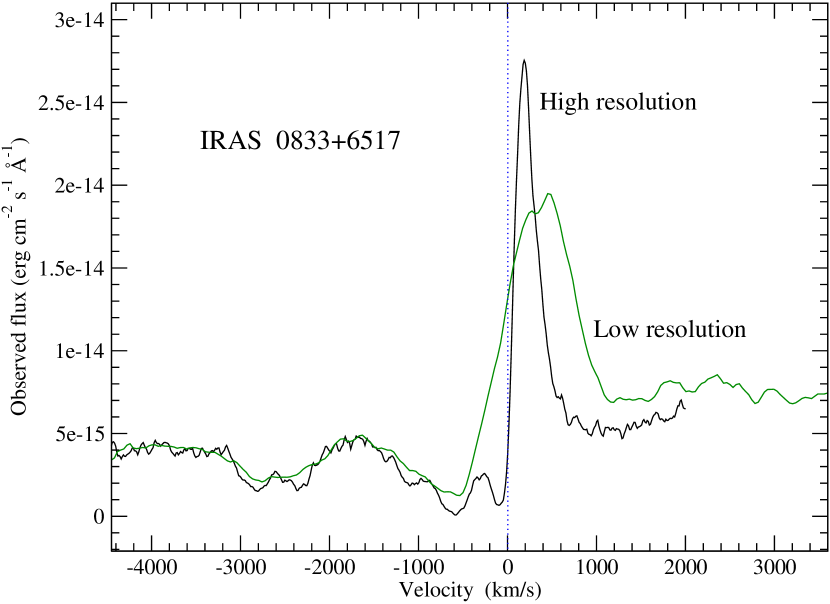
| Object | RA(2000) | Dec(2000) | M(B) | v(hel) | Distance | Scale | 12+log(O/H) |
|---|---|---|---|---|---|---|---|
| km s-1 | Mpc | pc/″ | |||||
| IRAS 0833+6517 | 08 38 23.2 | 65 07 15 | -20.8 | 5730 | 85.4 | 413 | 7.51 |
| IZw18 | 09 34 02.4 | 55 14 32 | -14.0 | 780 | 10 | 48.4 | 7.22 |
| Haro 2 | 10 32 31.9 | 54 24 03 | -18.2 | 1461 | 19.5 | 94.4 | 8.43 |
| Object | Obs. date | Grating | Integration time (s) | Pos. angle (deg) | Coordinates (RA, Dec – deg) |
|---|---|---|---|---|---|
| IRAS 0833+6517 | 2001-01-15 | G430L | 360 | 171 | 129.59666, 65.12083 |
| IRAS 0833+6517 | 2001-01-15 | G140M | 1320, 3000, 3000 | 171 | 129.59666, 65.12083 |
| IZw18 | 2000-10-04 | G430L | 300 | 143.50833, 55.24094 | |
| IZw18 | 2000-10-04 | G140M | 1764, 3135, 3089, 3089 | 143.50833, 55.24094 | |
| Haro 2 #1aaDue to an error, the center of the slit was misplaced 31″ to the N during this visit. (major axis) | 2000-02-21 | G430L | 300 | 150 | 158.13250, 54.40972 |
| Haro 2 #1aaDue to an error, the center of the slit was misplaced 31″ to the N during this visit. | 2000-02-21 | G140M | 1724, 3111, 3065 | 150 | 158.13250, 54.40972 |
| Haro 2 #2 (minor axis) | 2000-12-01 | G430L | 300 | 158.13250, 54.40097 | |
| Haro 2 #2 | 2000-12-01 | G140M | 1724, 3111, 3065 | 158.13250, 54.40097 |
| IRAS 0833+6517 | Haro 2 | |
| 6.0e-14 | 1.2e-13 | |
| 2.3e-14 | 6.9e-14 | |
| 6.5e-14 | 2.0e-13 | |
| 2.0e-14 | 7.7e-14 | |
| W() (Å) | 8 | 75 |
| 4.3e-14 | 1.6e-13 | |
| W() (Å) | 6 | 12 |
| 4.0e-15 | - | |
| Aperture | 3505 | 1505 |