Contribution of the VLBA Network to Geodynamics
Abstract
A decade of observations in geodetic mode with the VLBA network gave valuable results. Approximately 1/5 of all geodetic observations are recorded in VLBA mode and processed at the Socorro correlator. Ten years of observations allowed us to reliably measure slow intra-plate motion of the VLBA stations located on the North-American plate. It also helped us to achieve scientific objectives of geodetic programs: verify models of harmonic and anharmonic site position variations caused by various loadings, improve models of core-mantle boundary, investigate mantle rheology and solve other tasks.
NVI, Inc./NASA GSFC, Code 926, Greenbelt, 20771 MD, USA
1. Introduction
Method of VLBI first proposed by Matveenko, Kardashev and Sholomitsky (1965) is used for two major applications: making images of compact radio sources and measuring antenna’s motion with respect to extragalactic source. Fringe amplitudes and phases measured with precision – are used as primary observables for imaging; group delays measured with relative precision – are used as observables for geodynamics applications. Group delay is sensitive to the projection of the baseline vector to the source direction. Having observed many sources in different directions and different baselines we are able to solve for source positions, site positions, Earth orientation parameters (EOP) and the rate of their changes in a least square solution. The paper of Overs, Fanselow and Jacobs (1998) provides an overview of geodetic VLBI technique.
2. Precision and accuracy
There are several measures of how precise results are. Formal uncertainties, which are calculated according to a law of propagation of errors of an individual observation, are the first measure. This estimate gives us an upper limit of precision, since an estimation model usually does not account correlations correctly. Another measure of precision is repeatability — the root mean square deviation of the series of estimates of the targeted parameter with respect to the average. And the last measure is accuracy: the measure of how far our estimate of the targeted parameter is from the true value. Table 1 summarizes the current level of precision and accuracy of geodetic VLBI.
| EOP | Station coordinates | ||||
|---|---|---|---|---|---|
| One day | All data | ||||
| vert | horiz | vert | horiz | ||
| Precision | 0.3 nrad | 2.0 mm | 1.5 mm | 0.7 mm | 0.2 mm |
| Repeatability | 0.5 nrad | — | — | 8 mm | 2 mm |
| Accuracy | 0.7 nrad | 10 mm | 3 mm | 10 mm | 3 mm |
| Amplitude of coherent signal in site coordinates | ||||
|---|---|---|---|---|
| Periods | Periods | |||
| vert | horiz | vert | horiz | |
| Precision | 1–4 mm | 0.2–0.7 mm | 0.7–1.5 mm | 0.2–0.4 mm |
| Accuracy | 2–5 mm | 0.4–1.2 mm | 1.0–2.0 mm | 0.3–0.6 mm |
3. Scientific objectives
Although site positions and source coordinates are determined in processing VLBI observations, and they can be useful for particular applications, such as source mapping, determination of positions is not the objective per se. The objective of observations is to measure changes in site positions and source coordinates. Investigation of changes in positions of the sites allows us to make judgments about the forces which caused the motion and the response the Earth to external forcing.
When the whole VLBI dataset is analyzed, the following parameters are estimated:
-
•
Secular site velocities. Causes: 1) plate tectonic; 2) po-seismic slips; 3) post-glacial isostatical adjustment; 4) environmental changes 5) ??
-
•
amplitudes of harmonic site position variations. Causes: 1) solid Earth tides; 2) ocean tides; 3) ??
-
•
anharmonic site position variations. Causes: 1) atmospheric pressure loading; 2) hydrology loading; 3) non-tidal ocean loading; 4) ??
-
•
variations in the Earth orientation parameters. Causes: 1) torques exerted by the Sun and planets; 2) exchange of angular momentum with the atmosphere; 3) exchange of angular momentum with the ocean; 4) earthquakes? 5) ??
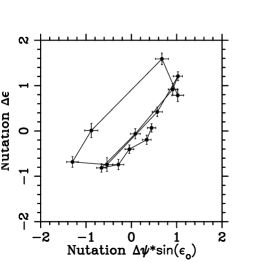
One of the examples of achieving these objectives are results of analysis of the amplitudes of the Earth’s nutation fitted to VLBI data.
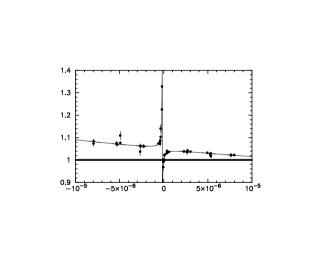
Frequency, rad/sec Frequency, rad/sec
In the case if the Earth responses to external torques as an absolutely rigid body, the complex transfer function would be (1,0). The presence of the liquid core causes the resonance at the retrograde free core nutation frequency. Dissipation in the ocean and in the liquid body causes appearance of the non-zero imaginary part of the transfer function. Fitting empirical transfer function to a model allowed Buffett, Mathews, & Herring, (2002) to estimate so-called basic Earth paramenters which includes the core mantle boundary flattening and the magnitude of the magnetic field at the core mantle boundary (0.7mT).
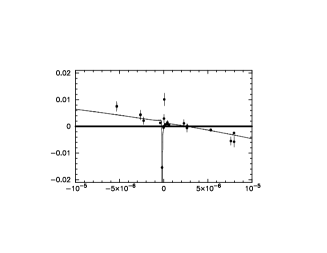
VLBI observations allowed us to detect a secondary tidal effect: site displacements caused by water mass redistribution due to ocean tides. Mass loading results in crust deformation even thousands kilometers away from the mass load. It was found that observed amplitudes are in a rather good agreement with models (fig. 2. Comparison of the observed amplitudes with theoretical amplitudes at many VLBI sites, including VLBA antennas, allowed Petrov and Ma (2003) to discriminate between competing models of ocean tides. It is relatively easy to validate ocean tides models close to the shore where tide gauges are located, but it is a challenge to validate ocean tides models at open ocean.

Frequency, rad/sec Frequency, rad/sec
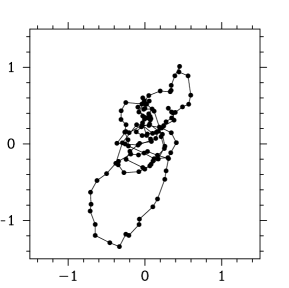
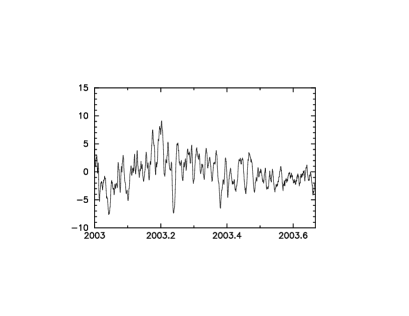
Similarly to mass loading, changes of atmospheric mass above the surface cause crust deformation due to pressure loading. Unlike tides, changes in atmospheric pressure are not predictable. However, global numerical weather models based on past observations of the world meteorological network allow us to compute displacements due to atmospheric pressure loading with latency several days. Examples of the atmospheric pressure loading are presented in fig. 3. Comparison of the admittance factors of the theoretical time series for all sites, including VLBA sites, showed surprisingly well agreement between the theoretical model and observations, even for horizontal loading which does not exceed 1 mm for most of the sites. This allowed Petrov and Boy (2003) to set the upper limit (4%) of possible errors of loading Love numbers which describe elastic properties of the Earth.
4. Contribution of VLBA
VLBA stations started to participate in geodetic program even before construction of the VLBA network has been completed. By June 2003 the total number of observations used in analysis was 4 032 371. The number of observations with at least one VLBA site was . Thus, approximately 1/5 of geodetic observations are done at the VLBA network.
| Station | Up | East | North | Def | |||||||||
|---|---|---|---|---|---|---|---|---|---|---|---|---|---|
| br-vlba | ( | 0.9 | 2.5) | ( | 2.4 | 0.7) | ( | -0.4 | 0.5) | ||||
| fd-vlba | ( | 2.2 | 1.2) | ( | 0.3 | 0.2) | ( | 0.0 | 0.2) | h | |||
| hn-vlba | ( | 0.0 | 0.1) | ( | 0.0 | 0.2) | ( | 0.0 | 0.1) | hv | |||
| kp-vlba | ( | 2.8 | 1.3) | ( | -0.1 | 0.2) | ( | 0.1 | 0.2) | h | |||
| la-vlba | ( | 1.5 | 1.1) | ( | -0.1 | 0.2) | ( | 0.0 | 0.3) | h | |||
| mk-vlba | ( | 5.0 | 3.2) | ( | -57.2 | 1.6) | ( | 57.7 | 3.4) | ||||
| nl-vlba | ( | -1.1 | 0.8) | ( | -0.1 | 0.2) | ( | -0.1 | 0.2) | h | |||
| ov-vlba | ( | 2.7 | 1.7) | ( | -6.1 | 0.5) | ( | 5.4 | 0.5) | ||||
| pietown | ( | 2.5 | 1.2) | ( | -1.2 | 0.3) | ( | -2.1 | 0.3) | ||||
| sc-vlba | ( | -3.8 | 3.4) | ( | 20.2 | 1.3) | ( | 5.0 | 0.6) | ||||
Results of estimation of secular station velocity are presented in table 2. The station of MK-VLBA belongs to the Pacific tectonic plate, SC-VLBA belongs to the Caribbean plate. They move rapidly (in geophysical meaning of this word) with respect to the North American plate where 8 other stations are located. The station of OV-VLBA is located rather close to the plate boundary and this station, and in a lesser degree BR-VLBA, are affected by the plate deformation near the edge of the plate. Peculiar horizontal velocity of Pietown is not yet completely understood. As Gordon (2003) indicated, it may be related to antenna’s tilting. Six other stations do not exhibit relative horizontal motion with respect to each other at the level exceeding 1 mm during entire history of the VLBA.
Exceptionally high precision of the Earth orientation parameters makes 20 station experiments correlated at the VLBA correlator especially attractive for investigation of free core nutation – a poorly understood phenomenon of variable amplitude with the period around 430 days. Unlike forced nutation caused by torques exerted by Moon, Sun and planets, the mechanism of excitation of the free core nutation is not known. Currently it cannot be predicted and should be monitored like polar motion.
References
Buffett, B.A., Mathews P.M., & Herring T.A., 2002, J. Geophys. Res., 107(B4), 10.1029/2000JB000056.
Gordon, D. 2003, this volume.
Matveenko, L.I., Kardashev N.S., & Sholomitsky G.B., 1965, Izvestija Vysshih Uchebnyh Zavedenij, Radiofizika, 8, 651.
Petrov, L., & Ma, C., 2003, J. Geophys. Res., 108(B4), 10.1029/2002JB001801.
Petrov, L., & Boy, J.-P., 2003, Submitted to J. Geophys. Res., 10.1029/2003JB002500.
Sovers, O.J., Fanselow, J.J., & Jacobs, C.S., 1998, Phys.Rev.D, 70(4), 1393.