Joint VLTI/VLBA observations of Mira stars
Abstract
We present preliminary results on a recently started project to perform coordinated observations of Mira stars using near-infrared and radio long-baseline interferometry. We concentrate on recent observations of the Mira star S Ori. Observations with the ESO Very Large Telescope Interferometer (VLTI) were performed to measure the near-infrared diameter of the stellar surface. Concurrent VLBA observations of SiO maser emission towards this Mira star were performed to probe the structure and dynamics of the circumstellar atmosphere. Our near-infrared measurements suggest a diameter change consistent with the photometric period. The SiO maser emission appears to be at a distance of 2 stellar radii ( 10.7 mas, 20 mas, both at stellar phase 0.7), and to show a clumpy distribution within a ring-like structure.
European Southern Observatory, Garching bei München, Germany
U.S. Naval Observatory, Washington, DC, USA
1. Introduction
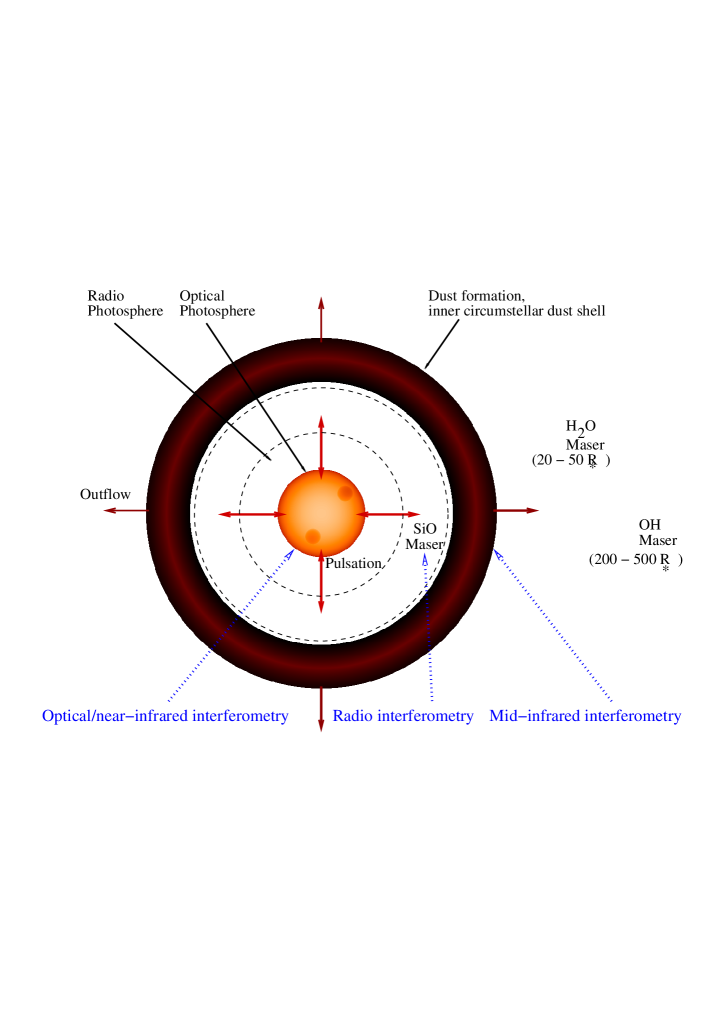
The evolution of late-type stars along the asymptotic giant branch (AGB) is accompanied by significant mass loss to the circumstellar environment with mass-loss rates of up to M⊙/year (see e.g., Jura & Kleinmann 1990, Kemball & Diamond 1997). AGB stars with masses of the order of 1 M⊙ become unstable to large-amplitude radial pulsations and become Mira variable stars. The nature of the mass-loss process of AGB stars, and especially its connection with the pulsation mechanism in the case of Mira variable stars, is not well understood. Joint multi-wavelength studies of the stellar surface and the circumstellar environment at different distances from the stellar surface promise to lead to a better understanding of the nature of the mass-loss process, and thus of the evolution of AGB stars and of the chemical enrichment process of galaxies. Figure 1 shows a scheme of the multi-wavelength view of a Mira star and its circumstellar environment. The conditions on the stellar surface can in principle be studied by means of optical/near-infrared long-baseline interferometry. This technique provides information regarding the stellar diameter, effective temperature, and center-to-limb intensity variations. With multiple epochs, the variability of these parameters as a function of time/stellar pulsation cycle can be studied as well. Interferometry at a more advanced stage can likely probe horizontal temperature inhomogeneities of the stellar surfaces as well (e.g. Wittkowski et al. 2002). Recent results on Mira stars based on near-infrared interferometry are described by e.g. Thompson et al. (2002a/b). The ESO Very Large Telescope Interferometer (VLTI) provides excellent capabilities to observe AGB stars at near-infrared and mid-infrared wavelengths. It is currently in the phase of commissioning. About 20 Mira stars have already been observed with the near-infrared commissioning instrument VINCI (Richichi & Wittkowski 2003). The structure and dynamics of the circumstellar atmosphere of Mira stars at typically 2–3 stellar radii can be probed by mapping the SiO maser emission towards these stars using very long baseline interferometry (VLBI) at radio wavelengths (e.g., Kemball & Diamond 1997, Boboltz et al. 1997, Boboltz & Marvel 2000, Boboltz 2003). The dust formation zone at distances of typically 4–10 stellar radii can be probed by mid-infrared interferometry (see, e.g. Danchi et al. 1994, Townes 2003). The distance of the SiO maser emission relative to the dust zone has been studied by Greenhill et al. (1995).
Here, we report on first preliminary results of a recently started project to combine observations of the SiO maser emission towards Mira stars using the VLA/VLBA and observations of the near-infrared stellar disk using the VLTI, focusing on the Mira star S Ori.
2. Characteristics of S Ori
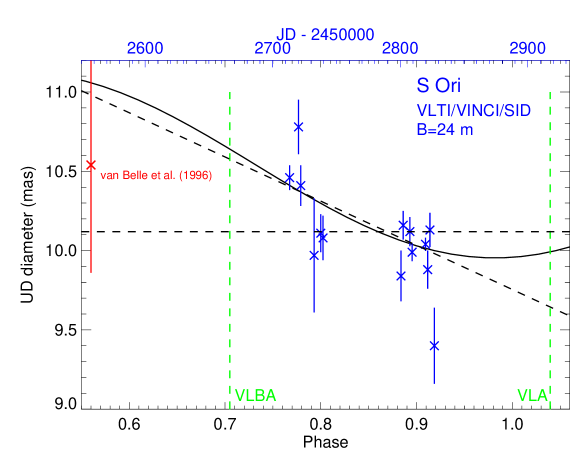
S Ori is a relatively cool Mira star with spectral type M 6.5 e – M 9.5 e and relatively large visual amplitude of 7–13. Merchan Benitez & Jurado Vargas (2000) report on a marked decrease of the stellar variability period, which might be caused by a recent helium-shell flash. The variability period is currently 440 days. The distance to S Ori was estimated by van Belle (1996) to 422 37 pc (based on Wyatt& Cahn 1993 and Young 1995). There is one previous diameter measurement of S Ori by van Belle et al. (1996), who derived a uniform disk (UD) diameter of 10.54 0.68 pc at stellar pulsation phase 0.56. SiO and OH maser emission towards this star has been reported. An interferometric map of this emission has so far not been obtained.
We have chosen the object S Ori for our study because it is known to show a fairly strong (10-20 Jy) SiO maser emission, it has a size and K magnitude which is feasible for observations with the VLTI and the 40 cm test siderostats, and it was available for both facilities, VLTI and VLBA.
3. VLTI and VLBA measurements


.
.
-band interferometric data on S Ori were obtained on 14 days between January and March 2003, corresponding to stellar phases 0.77 – 0.92, using the VLTI with the commissioning instrument VINCI, the 40 cm test siderostats, and a baseline of 24 m. These observations have been coordinated with VLBA observations of the SiO maser emission towards our source, which were obtained on Dec. 29, 2002, at stellar phase 0.7. These observations were carried out for two maser transitions, namely , 42.8 GHz, and , 43.1 GHz.
Figure 2 shows two examples of our preliminary VLTI visibility curves for S Ori, for dates January 25 and March 17. They show that a uniform disk model fits our data. There is no obvious indication of deviations from a uniform disk model at these spatial frequencies which might in principle be caused by contributions from a circumstellar envelope. Figure 3 shows our obtained near-infrared -band UD diameters as a function of date and stellar variability phase. Indicated are also the UD diameter measurement by van Belle (1996), and the date of our coordinated VLBA measurements. Our UD diameter values suggest a decrease of the UD diameter over our time period, which is consistent with the stellar phase. The dotted and solid lines indicate best fits of a linear function and a sine function, respectively.
The obtained uniform disk diameters will be transformed into more physically meaningful Rosseland-mean diameters using stellar atmosphere models (cf. Hofmann et al. 1998, Wittkowski et al 2003).
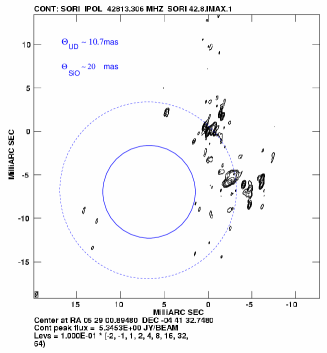
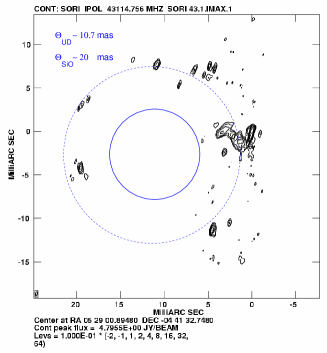
Figure 5 shows our obtained VLBA maps of the SiO maser emissions towards S Ori. Both transitions show a clumpy distribution within a ring-like structure. Indicated are also our obtained near-infrared -band UD diameter at the phase of the VLBA map and an approximate mean distance of the SiO maser emission spots to the center of the star. The relative positions of the near-infrared diameter and the SiO maser emission are arbitrary. The emission from both SiO maser transmissions appear to be at a distance of 2 stellar radii ( 10.7 mas 4.5 AU; 20 mas 8.4 AU). The emissions from the two SiO maser transmissions (42.8 GHz and 43.1 GHz) appear to have a separation of 0.4 AU, which is consistent with predictions by Gray & Humphreys (2000).
Future work on this project aims at obtaining near-infrared visibility values at more stellar phases and spatial frequencies to confirm the UD diameter change with stellar variability phase and to constrain the intensity profile, respectively. Multi-epoch VLBA maps would allow us to correlate the near-infrared diameter change with changes of the distribution of the SiO maser emission. Mid-infrared interferometric measurements could in addition be used to probe the distribution and distance of the dust formation shell.
References
Boboltz, Diamond, Kemball, 1997, ApJ 487, L147
Boboltz & Marvel, 2000, ApJ 545, L149
Boboltz, 2003, this volume
Danchi et al., 1994, AJ 107, 1469
Greenhill et al., 1995, ApJ 449, 365
Hofmann, Scholz, Wood, A&A 339, 846
Jura & Kleinmann, 1990, ApJS 73, 769
Kemball & Diamond, 1997, ApJ 481, L111
Merchán Benítez P., Jurado Vargas M., 2002, A&A 386, 244
Thompson, Creech-Eakman, Akeson, 2002a, ApJ. 570, 373-378
Thompson, Creech-Eakman, van Belle, 2002b, ApJ 577, 447
Townes, 2003, in Reviews of Modern Astronomy 16, E. Schilicke ed., p. 1
Richichi, Wittkowski, 2002, Ap&SS, in press
van Belle, Dyck, Benson, Lacasse, 1996, AJ 112, 2147
Wittkowski, Schöller, Hubrig, Posselt, von der Lühe, 2002, AN 323, 241
Wittkowski, Aufdenberg, Kervella, 2003, submitted to A&A
Wyatt, Cahn, 1983, ApJ 275, 225
Young, 1995, ApJ 445, 872
The VLTI data were taken in the framework of our shared risk program in ESO observing period 70, and are public data released from the ESO VLTI.