Approaching NGC 3079 with VLBI
Abstract
The Seyfert 2 galaxy NGC 3079 is one of the nearest radio-weak AGN. We have carried out multi-frequency, multi-epoch VLBI observations of this object and detected new components, proper motion of the order of , strong spectral variability, and free-free absorption. Based on phase-referenced astrometry, we suggest a new identification of components seen at 1.7 GHz. Our results suggest that the nucleus in NGC 3079 is embedded in a dense medium which strongly affects the radio appearance of the AGN ejecta. We supplement our work with Seyfert VLBI observations taken from the literature.
Max-Planck-Institut für Radioastronomie, Bonn, Germany
1. Introduction
Structure and kinematics in the jets of radio-loud AGNs have been studied for long time spans, yielding discoveries such as superluminal motion, flux density outbursts which mark the ejection of new jet components, and twisted magnetic fields within the jets. Only little is known about the physically less extreme radio-weak objects, and only those few that are strong enough are suitable for detailed VLBI studies. NGC 3079 is one of the brightest Seyfert 2 galaxies, and shows significant changes in radio configuration, component spectra and overall geometry on a timescale of a few years. It can contribute important insights to our understanding of the difference between radio-loud and radio-weak AGN.
2. NGC 3079
NGC 3079 is a nearby Seyfert 2 or LINER galaxy at a distance of 15 Mpc with embedded maser emission. VLA B-array observations at 6 cm show a bright core and two prominent radio lobes. These lobes extend 2 kpc away from the nucleus in P.A. , almost perpendicular to the disc of the galaxy in P.A. (Duric et al. 1983). Pilot VLBI observations by Irwin & Seaquist (1988) resolved the core into two strong components, and , separated by 1.47 pc in P.A. (relative to ). They also found emission along a line between these components, suggestive of a jet-like feature, which they named . These three components do not align with either the kpc-scale lobes or the galaxy disc.
Spectral-line and continuum observations by Trotter et al. (1998) and Sawada-Satoh et al. (2000) (hereafter S00) have resolved the maser emission in NGC 3079 into numerous aligned spots at almost the same P.A. as the galaxy disc and at an angle of with respect to the jet axis. Those authors suggest that the location of the nucleus is on the - axis, where it intersects with the line of masers, although there is no radio emission from that location. Another component, , was found by T98 further down the - axis but was not confirmed by S00. and were found by S00 to separate at , and appeared to be stationary with respect to the brightest maser clumps.
3. Observations and Results
We have observed NGC 3079 at 1.7 GHz, 2.3 GHz, 5.0 GHz and 15.4 GHz during four epochs (Table 1). All observations were made with the VLBA and Effelsberg111The National Radio Astronomy Observatory is a facility of the National Science Foundation, operated under cooperative agreement by Associated Universities, Inc. The Effelsberg 100-m telescope is operated by the Max-Planck-Institut für Radioastronomie., except for the 2.3 and 5.0 GHz observations in 2002-09-22 which were made with the VLBA only. Only the observations of the last epoch included polarization measurements and were phase-referenced to a calibrator. At 1.7 GHz the source is very weak and resolved and was not detected on baselines longer than . Phase-referencing, however, yielded a good () detection. The determination of instrumental polarization did not work at 2.3 GHz, and so polarization information could be obtained only at 1.7 GHz and 5.0 GHz. At 15.4 GHz, NGC 3079 was successfully detected on baselines shorter than .
| Epoch | Freq. | Peak | rms | Int. flux / mJy | Separations / mas | |||||
|---|---|---|---|---|---|---|---|---|---|---|
| GHz | mJy beam-1 | |||||||||
| 1999-11-20 | 5.0 | 20 | 0.08 | 27 | 17 | 4.2 | 26.2 | 26.3 | 17.7 | |
| 15.4 | 45 | 0.33 | 5.7 | 47 | ||||||
| 2000-03-06 | 5.0 | 17 | 0.06 | 25 | 18 | 3.1 | 26.4 | 26.2 | 17.7 | |
| 15.4 | 51 | 0.35 | 5.9 | 54 | ||||||
| 2000-11-30 | 5.0 | 18 | 0.06 | 24 | 18 | 5.2 | 26.5 | 25.9 | 17.6 | |
| 15.4 | 51 | 0.23 | 17 | 62 | ||||||
| 2002-09-22 | 1.7 | 9.1 | 0.06 | 3.1 | 16.7 | |||||
| 2.3 | 20 | 0.13 | 0.57 | 18 | 2.6 | |||||
| 5.0 | 22 | 0.11 | 25 | 21 | 7.1 | 27.2 | 25.5 | 17.7 | ||

The images from 2002-09-22 and the 15.4 GHz image from 2000-11-30 are
shown in Fig. 1. We have detected two new components and at
1.7 GHz to 5.0 GHz in addition to the known components , and
. Two components are visible at 1.7 GHz, a more compact one to the
north-west () and an extended one to the south-east (). Based on
absolute coordinates, we find that these components are not coincident
with and seen at higher frequencies, despite having a similar
separation and relative position angle. They are, instead, coincident
with and seen at 5.0 GHz. At 2.3 GHz, component has
weakened, but has become stronger. South of , component
starts to show up, but is still not detected. Only at 5.0 GHz are
all components visible, including the jet-like feature and a weak
detection of . At 15 GHz, only and are detected. Our
polarimetric observations did not show polarized emission at 1.7 GHz
or 5.0 GHz, the limits being 2.2 % and 1.2 %, respectively.
3.1. Spectra and Spectral Variability
The big spectral differences among the components are illustrated in Fig. 2 (left panel). The graphs show the spectra of (top to bottom) , , and .
Component has a highly inverted spectrum with between 2.3 GHz and 5.0 GHz and a steep spectrum with (2000-11-30). However, this has significantly evolved from in 1999-11-20. Component also has an inverted spectrum with to 1.08 during the first three epochs. was detected only at 5.0 GHz in 2002-09-22, yielding a lower limit of .
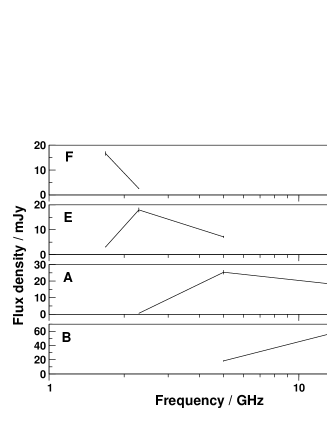
The new component has a very peculiar, narrow-peaked spectrum, with and . Synchrotron self-absorption cannot explain the inverted side with , and free-free absorption (FFA) in a foreground absorber is the most likely cause. If FFA is present, the observed spectrum will be , where , resulting in an exponential cutoff towards lower frequencies. However, fitting a spectrum of this form to the data yields an uncommonly steep intrinsic spectral index (before the absorber) of . A possible explanation could be that the electrons in the source population are not replenished and age, causing a cutoff towards high frequencies. If so, the FFA and electron population cutoffs would need to be very close in frequency. The spectrum of is extremely steep between 1.7 GHz and 2.3 GHz, with . We consider it most unlikely that the extreme spectra of and are due to resolution effects, because we used approximately scaled arrays (i.e., Effelsberg was included at 1.7 GHz only) and the data were calibrated and analyzed in the same manner, using the same tapering, weights, and imaging procedures.
The peak frequencies increase with decreasing RA of the components, suggestive of a gradient in a foreground absorber (in the shape of a wedge?) or, alternatively, an absorber with considerable and clumpy sub-structure on sub-pc scales.
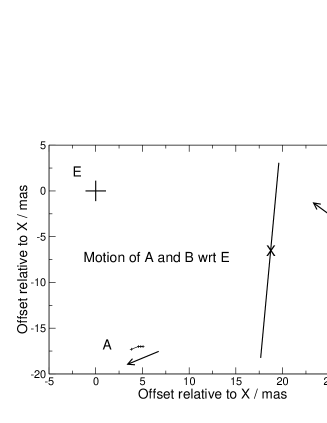
3.2. Proper Motions
As absolute positions are lost in phase self-calibration, the analysis of motions inside NGC 3079 is restricted to relative position changes. The component separations shown in Table 2 yield speeds of , and , where the determination of has been supplemented by literature data. Selecting either , or as the stationary reference point then yields three different scenarios, and we consider the one shown in Fig. 2 ( stationary) the most natural. Although we do not believe that is the nucleus, it might be kinematically disconnected from the AGN and hence be quasi-stationary over the observed epochs. The back-extrapolations of the trajectories of and then intersect in the past, from which point they may have been ejected. However, the nature of remains unclear. It cannot be a starburst due to its high brightness temperature, at 2.3 GHz, but it could be a supernova. In previously suggested scenarios (S00, Greenhill et al. 2003, this conference), was assumed to be stationary. If so, would be moving inwards, perpendicular to the - axis, at . Although the evidence from the maser observations is strong, we consider this situation more difficult to understand than the scenario in which is stationary.
4. Statistics
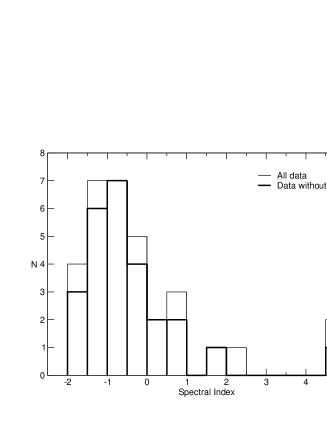

We have searched the literature for VLBI observations of Seyfert galaxies to see how NGC 3079 compares to other objects. We have found 33 spectral indices of components in 13 Seyferts, and 11 Seyferts where a linear structure is seen both on pc and kpc scales (Fig. 3). The spectral indices cluster around , as expected for optically thin synchrotron emission, and then fade into a tail out to +5. The points between and were measured in NGC 3079 (components and ), indicating that this galaxy is a special object. However, 10 out of 13 objects have flat () or inverted () spectra, indicating compact synchrotron emission or free-free absorption.
The pc- and kpc-scale structures in Seyferts show no strong tendency to be aligned: 8 out of 11 are misaligned with angles of between pc and kpc-scale structure. This indicates a difference from powerful radio objects, which show a bimodal distribution, tending to be either aligned or perpendicular (Pearson & Readhead 1988, Conway & Murphy 1993). The frequent misalignment in Seyferts indicates either precession of the jet ejection axis or pressure gradients and interactions with the ISM on scales of tens to hundreds of pc.
References
Conway, J. E., and Murphy, D. W. 1993, ApJ, 411, 89
Duric, N., Seaquist, E. R., Crane, P. C., Bignell, R. C. and Davis, L. E., 1983, ApJL, 273, L11
Irwin, J. A. and Seaquist, E. R., 1991, ApJ, 371, 111
Pearson, T. J., and Readhead, A. C. S. 1988, ApJ, 328, 114
Sawada-Satoh, S., Inoue, M., Shibata, K. M., Kameno, S., Migenes, V., Nakai, N. and Diamond, P. J., 2000, PASJ, 52, 421
Trotter, A. S., Greenhill, L. J., Moran, J. M., Reid, M. J., Irwin, J. A. and Lo, K., 1998, 495, 740