GMRT Observations of NGC 3079
Abstract
We present new observations at three frequencies (326 MHz, 615 MHz, and 1281 MHz) of the radio lobe spiral galaxy, NGC 3079, using the Giant Metrewave Radio Telescope. These observations are consistent with previous data obtained at other telescopes and reveal the structure of the nuclear radio lobes in exquisite detail. In addition, new features are observed, some with HI counterparts, showing broad scale radio continuum emission and extensions. The galaxy is surrounded by a radio halo that is at least 4.8 kpc in height. Two giant radio extensions/loops are seen on either side of the galaxy out to 11 kpc from the major axis, only slightly offset from the direction of the smaller nuclear radio lobes. If these are associated with the nuclear outflow, then the galaxy has experienced episodic nuclear activity. Emission along the southern major axis suggests motion through a local IGM (not yet detected) and it may be that NGC 3079 is itself creating this local intergalactic gas via outflows. We also present maps of the minimum energy parameters for this galaxy, including cosmic ray energy density, electron diffusion length, magnetic field strength, particle lifetime, and power.
keywords:
galaxies: individual: NGC 3079 – galaxies: halos – galaxies: jets – radio continuum: galaxies.1 Introduction
NGC 3079 is unusual amongst spiral galaxies in that it displays two well-defined radio lobes extending 30′′ (2.4 kpc, assuming a distance of 16.5 Mpc as listed in Table 1) from the nucleus (Duric et al. 1983), which are clearly out of the plane of this edge-on (84∘) system. Within the eastern radio lobe is a “bubble” of H emission extending to 550 pc and displaying outflowing velocities up to 1000 km s-1, as shown by Hubble Space Telescope (HST) observations (Cecil et al. 2001 and references therein). Recent Chandra spacecraft images have also revealed X-ray emitting gas that is spatially correlated with the emission line gas (Cecil et al. 2002).
The high IR luminosity (Table 1) and bubble/cone morphology of the emission line gas has led to models of wind-like outflow related to a starburst. However, the galaxy also harbours an active galactic nucleus (AGN) and jet and about half of the IR luminosity could be due to recycled AGN (rather than hot stellar) photons (Iyomoto et al. 2001). The core/jet nature of the nuclear region is confirmed by VLBI detections (Irwin & Seaquist 1988; Trotter et al. 1998) as well as the recent measurement of an increase in separation between the compact components implying a jet outflow velocity of 0.13 0.03 c (Kondratko et al. 2002). H2O maser emission in the disk indicates that a core mass of 106 M⊙ is present within a radius of 1 pc. Recent BeppoSax observations (Iyomoto et al. 2001) show that X-ray emission from the core is highly obscured and that after correction for absorption, the luminosity is 1042 to 1043 ergs s-1. In the inner parsec, this is 1% to 10% of the Eddington luminosity. NGC 3079 is therefore as active as the Seyfert galaxies and quasars. While it is still unclear to what extent the radio core powers the various components of the kpc-scale outflow, the radio lobes themselves appear to be a nearby analogue of the distant, powerful, extra-galactic radio sources, but within the dense, high angular momentum ISM of a nearby spiral.
Given the strength of the radio continuum emission in NGC 3079 and its peculiar nature, this galaxy represented a good target for low frequency observations using the Giant Metrewave Radio Telescope (GMRT) during its commissioning phase. We were particularly interested in searching for broad scale emission, especially as might be related to the nuclear outflow or to some of the other neutral hydrogen (HI) extensions and supershells seen in this galaxy (Irwin & Seaquist 1990). Multi-frequency observations were also important as a means to test for consistency and to enable the determination of minimum energy parameters such as magnetic field strength, cosmic ray energy density, and particle lifetimes. These are presented in Sec. 3. The basic data for NGC 3079 are presented in Table 1.
| RA (J2000)b | DEC (J2000)b | Typec | a bd | Vsyse | if | LFIRg | Dh |
| (h m s) | (∘ ′ ′′) | (′ ′) | (km s-1) | (∘) | (L⊙) | (Mpc) | |
| 10 01 57.798 | +55 40 47.08 | SB(s)c | 7.9 1.4 | 1125 | 84 | 4.1 1010 | 16.5 |
Taken from the Nasa Extragalactic Database, unless otherwise noted. Optical centre coordinates. Morphological type. Optical major and minor axes sizes. Heliocentric systemic velocity. Inclination, from Irwin & Seaquist (1991). Far infra-red luminosity, from the FIR flux listed in Niklas et al. (1995). Distance, from Baan & Irwin (1995), using H0 = 75 km s-1 Mpc-1.
2 Observations and Data Reduction
The GMRT consists of 30 45-m antennas in an approximate ‘Y’ shape similar to the Very Large Array but each antenna cannot be moved from a fixed position. Twelve antennas are randomly placed within a central 1 km by 1 km square (the “Central Square”) and the remainder form the irregularly shaped Y (6 on each arm) over a total extent of about 25 km. Further details about the array can be found at the GMRT website at http://www.gmrt.ncra.tifr.res.in. We present details of the observations in Table 2. The observations were made in the standard fashion, with each source observation interspersed with observations of the phase calibrator. Data are collected in spectral-line mode at the GMRT over 128 channels in 2 Stokes (RR and LL) and one IF. The data are first written in a GMRT-based “lta” format and then converted into FITS format to facilitate processing in the standard fashion using the Astronomical Image Processing System (AIPS) of the National Radio Astronomy Observatory (NRAO).
Because no on-line flagging occurred in real time during GMRT observations, the data were first “pre-edited” using the program, GMRED, written by one of us (JAI) to run within AIPS. The purpose of GMRED is to search through each channel, each stokes and each IF separately and edit out bad data prior to normal editing and calibration. It combines clipping (flagging by a maximum and minimum) as well as median filtering to eliminate gross outliers. The maximum and minimum, the time interval for determination of the median, and the deviation allowed from the median before flagging can all be set by the user after inspection of the raw UV data. This allowed for removal of points such as might be obtained when an antenna is receiving data but is not yet pointed exactly on source, points that might be poor at the beginning of scans, and spikes from interference or electronics. GMRED is freely available with instructions for installation from http://www.astro.queensu.ca/irwin.
We then carried out a calibration in time in the standard fashion but using a single good channel of the phase calibrator rather than the inner 75% of the band. This was possible since the calibrator sources were quite strong at each frequency and avoided potential variations with frequency.
Since the data were acquired in spectral-line mode, we also carried out a bandpass calibration using the phase calibrator. The data from a single good channel were then Fourier Transformed and cleaned, first using a wide field to identify all sources and then of smaller multiple fields so that the outlying sources could be cleaned with a beam for the respective positions. All channels were then self-calibrated several times (and again edited, if required) using the single channel map. Cleaned maps were then made of all channels (i.e. a cube was created) and plots of the source flux density and map rms noise as a function of channel number were made. Loss of signal at the ends of the channels and occasional interference spikes or hardware problems required further editing of a number of channels at this stage. The final edited bandwidths and band centres are given in Table 2.
We then checked for positional offsets and variations in source flux density across the band. We found that the positions of NGC 3079 (central peak) and other point sources within the field agreed in position from one edge of the band to the other to within a single pixel (about 1/4 of a beam). The standard deviation in the flux density of NGC 3079 across the band (measuring all channels) in comparison to the flux density is given in Table 2. These errors can be compared to the bootstrapped flux density error on the phase calibrator as well as the estimated absolute error on the flux density calibrators (the latter, a few percent) to arrive at an estimate of the final calibration error listed in Table 2.
The UV data were then averaged over all good channels to make a single-channel UV data set and various maps were made and cleaned from these data, using a variety of UV weighting functions and tapers. Several maps experienced small improvements from further minor editing and self-calibration at this stage. We then corrected for the primary beam at the various frequencies for all maps. However, after these corrections, the increase in source flux density was much less than the absolute calibration error and the point-by-point change in flux density per beam was less than the rms map noise for all maps. Thus we present the final maps without this correction.
We then checked and made minor corrections to the map registration by comparing the positions of the core of NGC 3079 and point sources around it (via gaussian fits) with those of the NRAO VLA Sky Survey (NVSS) and Faint Images of the Radio Sky at Twenty-centimeters (FIRST) maps (see Figs. 4b and 4c, respectively). We estimate the final positional accuracy to be within 1 arcsec. We also compared our 326 MHz flux densities with those measured from the Westerbork Northern Sky Survey (WENSS, Rengelink et al. 1997) map (Fig. 4a). After smoothing to the same resolution, the WENSS map has a peak and integrated flux density that are 10% lower than our GMRT flux densities. Given the 10% accuracy of our GMRT 326 MHz flux density and the 5% accuracy of the WENSS flux density, these values are in agreement.
| Observing Parameters | 326 MHz | 615 MHz | 1281 MHz |
|---|---|---|---|
| Date | 16 Apr 1999 | 14 Nov 1999 | 03 Dec 2001 |
| Timea (h) | 6.2 | 12.3 | 9.0 |
| Number of antennasb | 18 | 17 | 26 |
| Shortest Baseline (k) | 0.0684 | 0.159 | 0.195 |
| Longest Baseline (k) | 21.8 | 30.9 | 102 |
| Observing Bandwidth (MHz) | 8 | 16 | 16 |
| No. of IFs | 1 | 1 | 1 |
| Flux Density Calibrator(s) | 3C 286 | 3C 48, 3C 286 | 3C 48 |
| Flux Density (Jy) | 25.94 | 29.38, 21.05 | 17.23 |
| Phase/Bandpass Calibrator | 0831+557 | 0831+557 | 0831+557 |
| Flux Densityc (Jy) | 8.98 0.63 | 8.22 0.13 | 8.52 0.16 |
| Flux Error across bandd | 9.7% | 3.3% | 0.9% |
| Final Calibration Error | 10% | 5% | 3% |
| Map Parameters | |||
| Final Bandwidthe (MHz) | 6.2 | 7.75 | 14.0 |
| Band Centre (MHz) | 325.625 | 615.234 | 1280.700 |
| Resolution (low) | 59.16 49.56 @ 24.7∘ | 39.79 29.78 @ 11.3∘ | 23.55 19.75 @ 52.1∘ |
| Taper/weighting | 6 k/NA | 10k/NA | 10k/NA |
| rms map noise (mJy beam-1) | 4.9 | 1.0 | 0.63 |
| Resolution (medium) | 44.08 35.53 @ 19.8∘ | 27.08 19.65 @ 7.7∘ | 7.33 5.21 @ 48.1∘ |
| Taper/weighting | none/NA | none/NA | 50k/NA |
| rms map noise (mJy beam-1) | 3.4 | 0.9 | 0.25 |
| Resolution (high) | 28.45 17.66 @ 18.2∘ | 14.90 7.98 @ 36.5∘ | 3.22 2.24 @ 38.2∘ |
| Taper/weighting | none/UN | none/UN | none/UN |
| rms map noise (mJy beam-1) | 2.1 | 0.74 | 0.12 |
Total observing time, including overheads, before editing. Maximum number of antennas operational at any time during the observations. Flux density and error from GETJY. Standard deviation in flux density of NGC 3079 from measurements of all channels, divided by the mean flux density of all channels, expressed as a percentage. After editing.


| 326 MHz | 326 615 | 615 MHz | 615 1281 | 1281 MHz | |
|---|---|---|---|---|---|
| Flux Density (Jy) | 2.8 0.3 | 1.74 0.09 | 0.85 0.03 | ||
| Spectral Power (1022 W Hz-1) | 9.1 0.9 | 5.7 0.3 | 2.8 0.1 | ||
| Global Spectral Indexa | 0.75 0.10 | 0.98 0.04 | |||
| Mean Spectral Indexb | 0.92 0.04 | 1.02 0.05 |
Spectral index as determined from the total flux densities given in this table.
Mean as determined over a region that is equal in size between the two spectral index maps, i.e. that shown in Fig. 5c. See text for discussion of errors.
3 Results
3.1 Total Intensity Maps
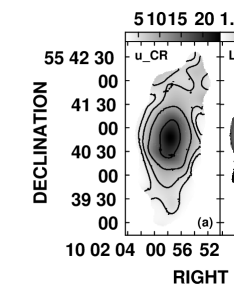
The total-intensity maps, shown over a variety of spatial scales, can be seen in Figs. 1 (326 MHz), 2 (615 MHz), and 3 (1281 MHz). Their map properties are listed in Table 2. In these figures, we show positive contours to low intensity levels (1.5) but caution in the interpretation of the lowest levels and summarize what we consider to be real features in Sect. 3.1.4. Total flux densities from these maps are given in Table 3 and are plotted on the spectrum shown in Fig. 5. The new GMRT flux densities are consistent with the known spectrum at these frequencies. (The one discordant low point at 365 MHz is from the Texas Survey using data taken between the years 1974 and 1983; see Douglas et al. 1996.) The new data are clearly and firmly in the non-thermal part of the spectrum.
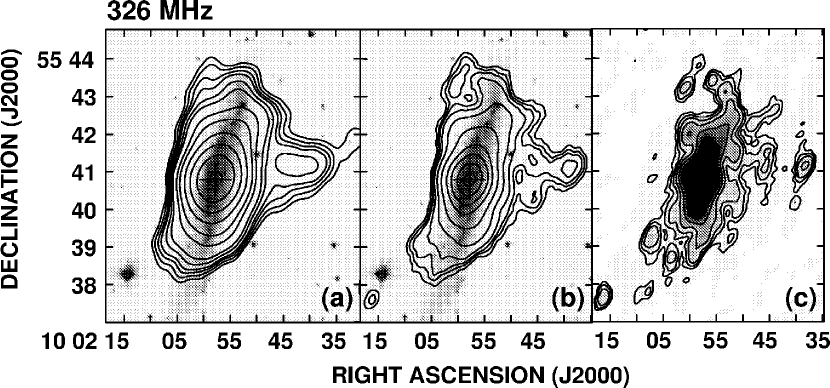
3.1.1 326 MHz
Our low-resolution GMRT image (Fig. 1a) shows strong emission from NGC 3079, but no emission from either of its two companion galaxies, namely NGC 3073 and MCG-9-17-9, the upper limit to their flux densities being 9 mJy and 5 mJy, respectively.
At 326 MHz (Fig. 1) an envelope of emission is seen around the galaxy which is more extensive than previously observed (cf. Duric & Seaquist 1988, Duric et al. 1983, de Bruyn 1977, and Fig. 4) with the possible exception of the low-resolution image of Condon (1987). The emission envelope follows the disk of the galaxy and is likely due to distributed sources in the disk similar to other star-forming spirals.
To determine the vertical scale height of this thick disk, we created a model galaxy with the geometry of NGC 3079, whose projected intensity at any point is proportional to the line of sight distance through the galaxy at that point. The model galaxy was then convolved with a beam equivalent to that of Fig. 1a. We then matched the extent of the model major axis with that of NGC 3079 at the 2 level and varied the vertical height until a match was achieved in the perpendicular direction (the western extension was omitted, see below). The best fit was found for a vertical height of 60′′ (4.8 kpc). Since the intrinsic brightness distribution should fall off with height from mid-plane, the vertical scale height will be larger than 4.8 kpc.
The 326 MHz emission also shows much substructure with improving resolution. The most obvious feature is an extension towards the west which ends in a knot at RA = 10 01 38.1, DEC = 55 41 14. A feature is also seen at a similar position in the WENSS image (Fig. 4a) at the same frequency though with somewhat different structure, given the different uv coverage and spatial resolution. This feature resolves into two distinct extensions (Fig. 1c) which roughly flank the western nuclear radio lobe. These two extensions have counterparts in HI, best seen in the moment map of Irwin & Seaquist (1987).
A large loop of emission is visible at the north end of the galaxy disk extending towards the east of it. The north edge of this loop makes the major axis on the north side appear to bend around to the east. The central minimum is at RA = 10 01 58.3, DEC = 55 43 01 and the loop diameter is 47′′ (3.8 kpc) parallel to the major axis and extends to 90′′ (7.2 kpc) from the major axis. This loop is also coincident with an HI (open-topped) loop seen at a velocity of 1011 km s-1 in Irwin & Seaquist (1991, their Fig. 1).
Another interesting result is the curvature of the emission towards the east away from the optical disk at the southern tip of the major axis. This behaviour again mimics that seen in the neutral hydrogen distribution (Irwin & Seaquist 1991). The NVSS image (Fig. 4b) also hints at an extension in this direction. Since both the radio continuum and HI emission are disconnected from the optical disk, the curvature is not tidal but is likely due to ram pressure affecting only the ISM components. This indicates that there may be more extensive intergalactic gas in this region through which NGC 3079 has some local motion. Such motion would be (in projection) towards the west or south-west or could be rotation (tumbling) with the southern major axis moving towards the west. At the present time, the only extended X-ray emission observed appears to be associated with the nuclear outflow (Pietsch et al. 1998, Cecil et al. 2002). Thus deeper X-ray observations are warranted.
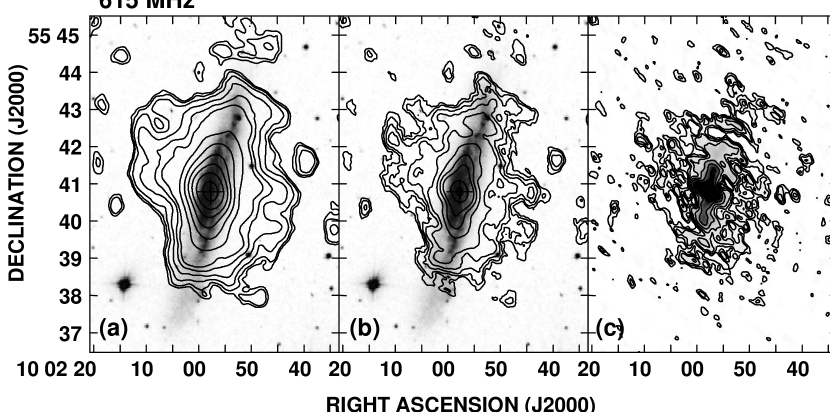
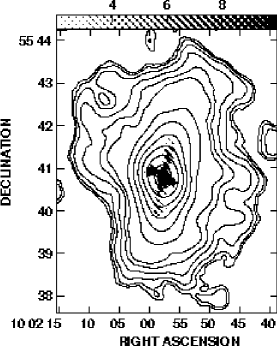
3.1.2 615 MHz
The 615 MHz data (Fig. 2) reveal the largest radio continuum loop which has yet been associated with this galaxy. The loop extends to the east, has a central minimum located at RA = 10 02 07.4, DEC = 55 42 37, has a diameter of 64′′ (5.1 kpc) parallel to the major axis and extends to 2.2′ (11 kpc) from the major axis. This is much farther than the minimum vertical scale height measured from the 326 MHz data and confirms that a very extensive radio continuum halo exists around NGC 3079. The loop is not centered over the eastern nuclear radio lobe, but rather offset from it to the north. However, there is much substructure in the feature, especially on its southern edge which is closer to the position of the radio lobe. It is possible that several features are blended along the line of sight in this edge-on system. Alternatively, the feature may be related to the nuclear outflow but source precession, motion of the galaxy with respect to an IGM, or flows into previously emitted gas may have affected its position over time. This feature is also hinted at in the WENSS image (Fig. 4a).
The same two western extensions on the west side of the disk (as noted from the 326 MHz data) are seen prominently at 615 MHz as well. These (Fig. 2b) reach 2′ (9.6 kpc) from the plane.
The distinctive cross shape and markedly stronger emission of the nuclear region in this galaxy is especially visible in Fig. 2c.
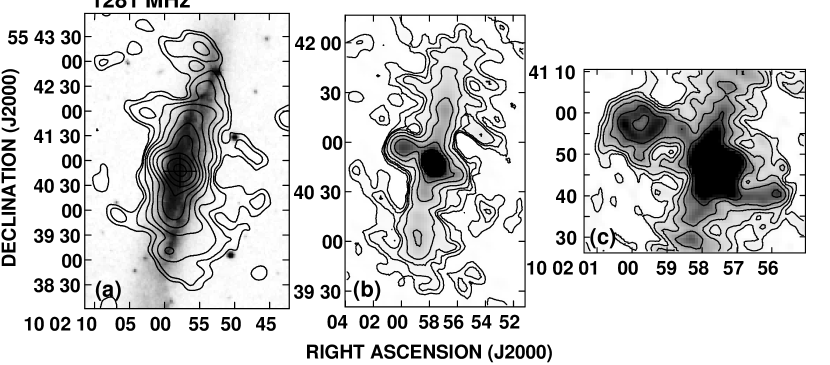
3.1.3 1281 MHz
At the highest frequency (Fig. 3), we again see emission related to the northern loop at RA 10 01 55, DEC 55 43 18, a feature related to the giant eastern loop at RA 10 02 03, DEC 55 42 00, and the two western extensions. At these higher resolutions, we also detect details of the nuclear radio lobes. Fig. 3b, for example, can be compared to the 1420 MHz FIRST image of Fig. 4c which is quite comparable in structure, except that our 1281 MHz image has a slightly lower resolution and shows some additional emission away from the plane. (Note that the FIRST image contains a noticeable stripe.) Fig. 3c reveals the lobes’ substructure in exquisite detail, especially the loop-like nature of the eastern lobe (cf. Duric & Seaquist 1988). The H emission occurs roughly in the region of the gap between the eastern loop and the nucleus (Cecil et al. 2001).
3.1.4 Summary of Radio Continuum Structure
Each data set set has its own limitations, via uv coverage, spatial resolution, and possible residual errors which could not be eliminated. We will therefore consider a feature to be real only if it is observed at more than one frequency (note that all data were taken on different dates, Table 2) or if it is observed in another independent observation using a different telescope. Thus we summarize the structures that we believe to be real as follows:
1. The western extension (Fig. 1a) which resolves into two distinct extensions (Fig. 1c, Fig. 2a, 2b, Fig. 3a, 3b, Fig. 4a, and is also seen in HI, Irwin & Seaquist 1987). These features extend to 10 kpc, roughly flank the western nuclear radio lobe and may be associated with it.
2. The northern loop (Fig. 1b, c, Fig. 3a and HI, Irwin & Seaquist 1991) of 3.8 kpc diameter and extending 7.2 kpc from the major axis. This loop appears to be associated with the disk.
3. The giant eastern radio loop (Fig. 2a, 2b, Fig. 3a, Fig. 4a) of 5.1 kpc diameter and extending 11 kpc from the major axis. It is offset from the eastern nuclear radio lobe but could still be related to larger scale and/or earlier nuclear outflow.
4. The offset, curved emission on the south tip of the major axis (Fig. 1a, 1b, 1c, Fig. 4b and HI, Irwin & Seaquist 1991), suggesting that there may be motion through broader scale IGM gas.
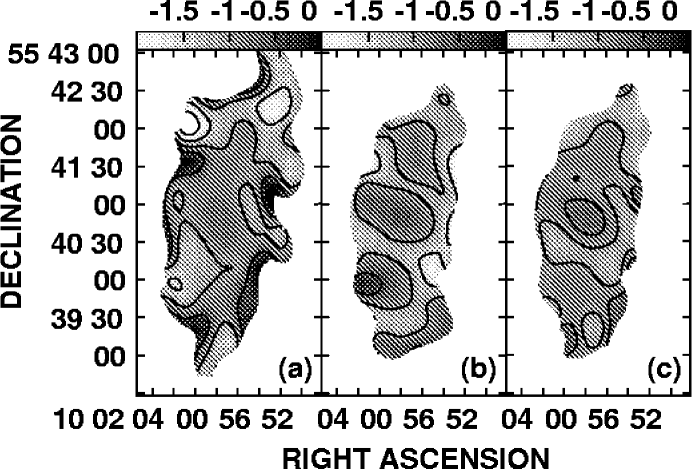
3.2 Spectral Index Maps
To make the spectral index maps, we took Fig. 1c, Fig. 2b, and Fig. 3a, which are all at similar spatial resolutions, smoothed them to a common resolution, and blanked all points below a level of 5 sigma. Spectral index maps () were then formed and are shown in Fig. 6. Fig. 6a shows the 326-615 MHz spectral index and Fig. 6b shows the spectral index map between 615 and 1281 MHz. To estimate the error in the spectral index maps, at each freuency we extracted a map of noise from a region in which there was no emission. We then added this noise map to the map of the emission region of NGC 3079. This resulted in 3 maps of emission with added noise typical of that data set. New spectral index maps were then formed from the noise-added images. We then formed a map of the difference between the noise-added spectral index maps and the original spectral index maps. The rms of these difference maps is typical of the error on any individual point in Figs. 6a and 6b, i.e. 0.1.
In Table 3, we list values of the spectral index, as determined from the total fluxes listed in Table 3 (the Global spectral index) and as determined from the mean of the spectral index maps over equivalent regions (the Mean spectral index). Note that the mean spectral index, which applies to high S/N regions, shows very little change with changing frequency and the global spectral index is consistent with these values between 615 and 1281 MHz ( = 0.92 to 1.02). However, the 326615 MHz global value is flatter at 0.75. This suggests that there may be more faint extended emission at 326 MHz which remained undetected. There may indeed be some trend, however, for stronger changes in spectral index in the high latitude gas than in the disk. For example, extrapolating the 615 MHz emission in the broad extended halo region using = 0.98 to 326 MHz should have revealed as extended a halo in Fig. 1c above the noise. A trend towards a flatter spectral index at lower frequencies can also be observed in the global spectrum (Fig. 5) when other independent data points are considered. Flattening of the spectral index at lower frequencies in the non-thermal domain has been observed before in other galaxies. Israel & Mahoney (1990) attribute such flattening to thermal absorption but this is unlikely to play a major role in our data since the mean spectral index, which applies mainly to the galaxy disk where most of the thermal gas should occur, shows only very minor flattening. Energy losses at the higher frequencies seems more likely (Hummel 1991).
In this regard, it is interesting to examine the distribution of spectral index as shown in Fig. 6a and Fig. 6b for differences. We note that there are differences between the maps that are greater than a typical error on any point. For example, a map of the difference between Fig. 6a and 6b (not shown) has an rms of 0.49 whereas a typical error bar is about 0.2. However, closer examination shows that the larger differences occur near the edges of the maps (where the S/N is lower) or in regions in which there are strong intensity gradients (where 1′′ errors in registration can make larger changes in the measured value of ). Therefore, in the region shown in Fig. 6c, we see no convincing evidence for changes in the spectral index with frequency above the error bars. Therefore, we averaged Fig. 6a and 6b to create a map of the average spectral index, shown in Fig. 6c.
Fig. 6c has a mean of = 0.97 and an rms of 0.18 with a typical error less than 0.1. There are hints that the spectral index may flatten at the bases of extensions (e.g. on the west side). The region centered on the nucleus clearly has a flatter spectral index than in other regions of the disk, e.g. a mean of 0.73 in the central 30′′ diameter region, in agreement with previous observations of this region (Duric & Seaquist 1983). The flatter values near the nucleus are consistent with the fact that this is a region in which cosmic ray acceleration is occurring and particles are younger.
3.3 Computation of Minimum Energy Parameters
From the mean spectral index map (Fig. 6c) and one total intensity map (the 615 MHz map that was used as to create the images of Fig. 6), we can compute the following minimum energy parameters (see Pacholczyk 1970, Duric 1991): the cosmic ray energy density, , the cosmic ray electron diffusion length, , magnetic field strength, , and the particle lifetime, . These quantities are computed for each pixel and represent means along a line of sight. A line of sight distance, and therefore a geometry, is required for these calculations. We also require assumptions regarding the lower and upper frequency cutoffs of the spectrum, and , and the ratio of the heavy particle energy to the electron energy, . (See Irwin et al. 1999 for a previous example.) Values which have been used are specified via several models which are listed in Table 4. In Fig. 7, we show the results for Model 1 which uses an inclined disk, , Hz and Hz. Table 4 lists the means calculated over these maps as well as those of the other models.
The results for Models 1 to 4 (Table 4) show that changes in geometry (inclined disk or oblate spheroid) and changes in the upper frequency cutoff make relatively small differences in the results. The main differences are due to the assumption of heavy particle to electron energy (cf. Model 1, Model 2) which introduce variations in the minimum energy parameters of order a factor of 1.5. Thus, we expect Model 1 (Fig. 7) to be a good representation of the data to within a factor of 2. Note that this choice affects only the absolute scale of the maps of Fig. 7 and not the point to point variation.
The fact that the measured flux densities for NGC 3079 fall within the non-thermal regime of the spectrum (Fig. 5) indicates that the thermal fraction should be very small. However, point to point variation in thermal fraction could change the appearance of the minimum energy parameter maps. Condon (1992) has provided an estimate (thought to be correct to within a factor of 2) of the thermal fraction in spiral galaxies, as measured globally, viz. , where is the non-thermal spectral index, is the total flux density and is the flux density due to the thermal component. Taking to be 0.97 (from the mean spectral index map of Fig. 6c), we find that only 3.6%, 6%, and 11% of the total emission could be due to thermal components at 326, 615, and 1281 MHz, respectively. To see what such a contribution might do to the calculation of the minimum energy parameters, we subtracted the above fractions from the total intensity images at the 3 frequencies, recomputed the spectral index map and recomputed the minimum energy maps. These results are also listed in Table 4 (Model 5) and show that there is a negligible difference in the minimum energy parameters as a result of possible thermal contributions.
In Fig. 7, we also show a map of power, , where is the cosmic ray energy density, (Fig. 7a), integrated along a line of sight and is the particle lifetime (Fig. 7d). The result is identically, , where is the observed luminosity at a point. Thus the map of closely resembles the map of total flux density but does not match it exactly because the computation of requires an integration over frequency which is dependent on spectral index, and the spectral index is different at different points in the map. The map of represents the rate at which cosmic rays must be accelerated in order to maintain equilibrium. Integrated over the map, the total power is ergs s-1. The total energy in cosmic rays is ergs. These values are minima since not all of the galaxy’s emission is represented in the regions shown in Fig. 7. In comparison, the values for the Galaxy are ergs s-1 and ergs (Condon 1992). Thus the cosmic ray energy generation rate and total energy are two orders of magnitude higher in NGC 3079 than in the Galaxy. The spectral power of Table 3 suggests a supernova rate of 0.27 yr-1 (see Condon 1992) if all emission has this origin. This is clearly an upper limit since some of the emission is due to the AGN and associated outflow.
Although the total cosmic ray energy and power are higher than the Galaxy, they are not atypical of spiral galaxies (Duric 1991). Our average magnetic field strength of 10 Gauss, for example, agrees with the 12 Gauss found for NGC 6946 (Ehle & Beck 1993). In addition, the distribution of values is as expected. The magnetic field strength, energy density, and power are all higher near the nucleus where there is much activity and correspondingly, the lifetime of the particles and the diffusion length are shorter. We note, in addition, that the peak power of ergs s-1 is considerably smaller than the power of the X-ray core in this galaxy ( ergs s-1, Sec. 1).
| Modela | ||||
|---|---|---|---|---|
| (eV cm-3) | (Kpc) | (Gauss) | (Myrs) | |
| (1) Inclined Disk (, ) | 8.03 | 1.38 | 9.32 | 88.1 |
| (2) Inclined Disk (, ) | 13.4 | 1.07 | 12.1 | 59.1 |
| (3) Inclined Disk (, ) | 7.82 | 1.40 | 9.21 | 116.3 |
| (4) Inclined Oblate Spheroid (, ) | 8.42 | 1.34 | 9.58 | 82.4 |
| (5) Inclined Disk (, , ‘thermal subtracted’) | 8.28 | 1.36 | 9.47 | 96.7 |
All models adopt a semi-major axis of 131.5′′ (measured to 5 from the 615 MHz map used to create Fig. 6), a semi-minor axis of 60′′, an inclination of 84.3∘ (Irwin & Seaquist 1991), and a lower frequency cutoff of .
4 Discussion
NGC 3079 is a unique nearby laboratory for studying the presence of radio jets in a spiral galaxy and the effect that these might have on the global characteristics of the galaxy. Although little else has been seen in the way of such well-defined radio lobes in a spiral, recent observations of Abell 428 have also revealed a classical double-lobed radio source associated with a disk galaxy (Ledlow et al. 1998, Ledlow et al. 2001), suggesting that NGC 3079 is no longer unique. Our new GMRT observations have revealed not only the details of the nuclear radio structure (e.g. Fig. 3c) at high (3′′) resolution, but broad scale radio continuum emission (e.g. Fig. 1a) at low (55′′) resolution and much substructure.
It appears that much of the extended emission around NGC 3079 is related to the disk. This is seen via the envelope of emission whose morphology follows the disk (Fig. 1a) and also from at least one feature which forms a kpc-scale loop to the east of the northern tip of the galaxy (Fig. 1b) which has an HI counterpart. Thus, the radio continuum features are similar to those found in NGC 5775 in which extraplanar features and supershells are detected in every component of the ISM (Lee et al. 2001) or NGC 2613 in which a large open-topped radio continuum arc with some associated HI spans much of the galaxy (Chaves & Irwin 2001). Neither of the latter two galaxies are known to harbour an AGN.
The nuclear radio emission and radio lobes have been well-delineated by our observations. In addition, large radio extensions and loops are seen which may be associated with it. This includes the two western extensions and possibly the giant eastern loop best seen at 615 MHz which is somewhat offset from a direct extension of the eastern nuclear lobe. Fig. 8 shows the western extensions and eastern loop in relation to the high resolution nuclear radio lobes. Indeed the placement of these features and their similar sizes are suggestive of a nuclear origin. If the two large features on either side of the galaxy are indeed associated with the nuclear outflow then they indicate regions of previous outflow and suggest that the nuclear activity in NGC 3079 is episodic. If we extrapolate a particle lifetime of yrs (Fig. 7d) and use the outer distance of the giant eastern loop (11 kpc, Sect. 3.1.2) then the required average bulk speed of the particles from the disk to this distance is 100 km s-1.
The presence of offset radio continuum and HI emission at the southern tip of the major axis argues for some motion with respect to an IGM and this may also be affecting the location of the eastern loop. However, other effects may also be important. For example, the fact that the VLBI jet direction is offset from the direction of the nuclear radio lobes argues either that the source outflow direction is changing with time or that the nuclear jets are bending through the galaxy’s ISM and being focussed along the minor axis until the outflow moves from an ISM-dominated region to an IGM dominated region. We speculate that the emission around NGC 3079 may be similar to what has been observed at low frequencies around M 87 in which the galaxy is embedded in a complex IGM in its immediate vicinity which is due to its own nuclear outflow (Owen et al. 2000).
5 Conclusions
We have observed the double-lobed spiral galaxy, NGC 3079 using the GMRT at three frequencies and detected structure over resolutions from 3′′ to 56′′. At high resolution, the structure of the nuclear radio emission is shown in exquisite detail (Fig. 3c). In addition, we have detected a number of new intermediate and broad scale features, namely:
1. Two western extensions above and below the western nuclear radio lobe which reach 10 kpc from the galaxy’s disk. These features have associated HI emission.
2. A giant eastern radio loop, best seen in Fig. 2a or Fig. 8, which is slightly offset from a line extending through the nucleus and the eastern radio lobe. The giant loop extends to 11 kpc from the disk.
3. A northern loop, best seen in Fig. 1b. There is a large HI arc at this position. It is 3.8 kpc in diameter and extends 7.2 kpc from the major axis. This loop appears to have originated in the disk.
4. A broad halo of emission with a vertical scale height of at least 4.8 kpc, which follows the disk of the galaxy.
5. Emission at the southern tip of the major axis that is offset from the optical major axis suggesting that there may be motion through broader scale IGM gas.
No emission has been detected from either companion galaxy.
We suggest that Features 1 and 2 above may be associated with earlier nuclear outflow in which case the average outflow velocity would be 100 km s-1. In addition, the IGM that is implied in 5, above, could be a local IGM, formed via outflow from NGC 3079 itself.
We have also computed spectral index maps over a restricted spatial region and have computed maps of minimum energy parameters for this galaxy, including the cosmic ray energy density, the diffusion length, the magnetic field strength, the particle lifetime (each of these representing averages along a line of sight) and finally the power. The total energy content is several orders of magnitude larger than that of our Milky Way but the parameters, in general, are typical of spiral galaxies.
Acknowledgments
JAI wishes to thank the scientists and staff of NCRA, Pune, for graciously allowing her to work at this institute during a sabbatical year. The GMRT is a national facility operated by the National Centre for Radio Astrophysics of the Tata Institute of Fundamental Research. This research has made use of the NASA/IPAC extragalactic database (NED) which is operated by the Jet Propulsion Laboratory, Caltech, under contract with the National Aeronautics and Space Administration.
References
- [1] Baan W. A., Irwin J. A., 1995, ApJ, 446, 602
- [2] de Bruyn A. G., 1977, A&A, 58,221
- [3] Cecil G., Bland-Hawthorn J., Veilleux S., Filippenko A. V., 2001, ApJ, 555, 338
- [4] Cecil G., Bland-Hawthorn J., Veilleux S., 2002, ApJ, 576, 745
- [5] Chaves T. A., Irwin J. A., 2001, ApJ, 557, 646
- [6] Condon J. J., 1983, ApJS, 53, 459
- [7] Condon J. J., 1987, ApJS, 65, 485
- [8] Condon J. J., 1992, ARAA, 30, 575
- [9] Douglas J. N., Bash F. N., Bozyan F. A., Torrence G. W., Wolfe C., 1996, AJ, 111, 1945
- [10] Duric N., 1991, in ASP Conf. Ser. 18, The Interpretation of Modern Synthesis Observations of Spiral Galaxies, ed. N. Duric, P. Crane (San Francisco: ASP), 17
- [11] Duric N., Seaquist E. R., 1988, ApJ, 326, 574
- [12] Duric N., Seaquist E. R., Crane P. C., Bignell R. C., Davis L. E., 1983, ApJ, 273, L11
- [13] Ehle M., Beck R., 1993, A&A, 273, 45
- [14] Hummel E., 1991, A&A, 251, 442
- [15] Irwin J. A., Seaquist E. R., 1987, ApJ, 313, L91
- [16] Irwin J. A., Seaquist E. R., 1988, ApJ, 335, 658
- [17] Irwin J. A., Seaquist E. R., 1990, ApJ, 353, 469
- [18] Irwin J. A., Seaquist E. R., 1991, ApJ, 371, 111; erratum 415, 415
- [19] Irwin J. A., English J., Sorathia B., 1999, AJ, 117, 2102
- [20] Israel F. P., Mahoney M. J., 1990, ApJ, 352, 30
- [21] Iyomoto N., Fukazawa Y., Nakai N., Ishihara Y., 2002, ApJ, 561, L69
- [22] Kondratko P. K., Greenhill L. J., Moran J. 2000, AAS, 197, #108.07
- [23] Ledlow M. J., Owen F. N., Keel W. C., 1998, ApJ, 495, 227
- [24] Ledlow M. J., Owen F. N., Yun M. S., Hill J. M., 2001, ApJ, 552,120
- [25] Lee S.-W., Irwin J. A., Dettmar R.-J., Cunningham C. T., Golla G., Wang Q. D., 2001, A&A, 377, 759
- [26] Niklas S., Klein U., Braine J., & Wielebinski R. 1995, A&AS, 114, 21
- [27] Owen F. N., Eilek J. A., Kassim N. E., 2000, ApJ, 543, 611
- [28] Pacholczyk A. G., 1970, Radio Astrophysics (San Francisco: Freeman)
- [29] Pietsch W., Trinchieri G., Vogler A., 1998, A&A, 340, 351
- [30] Rengelink R. B., Tang Y., de Bruyn A. G., Miley G. K., Bremer M. N., Roettgering H. J. A., Bremer M. A. R., 1997, A&AS, 124, 259
- [31] Trotter A. S., Greenhill L. J., Moran J. M., Reid M. J., Irwin J. A., Lo K.-Y., 1998, ApJ, 495, 740