Detection of a Fully-resolved Compton Shoulder of the Iron K Line in the Chandra X-ray Spectrum of GX 3012
Abstract
We report the detection of a fully-resolved, Compton-scattered emission line in the X-ray spectrum of the massive binary GX 3012 obtained with the High Energy Transmission Grating Spectrometer onboard the Chandra X-ray Observatory. The iron K fluorescence line complex observed in this system consists of an intense narrow component centered at an energy of = 6.40 keV and a redward shoulder that extends down to 6.24 keV, which corresponds to an energy shift of a Compton back-scattered iron K photon. From detailed Monte Carlo simulations and comparisons with the observed spectra, we are able to directly constrain the physical properties of the scattering medium, including the electron temperature and column density, as well as an estimate for the metal abundance.
1 Introduction
When a high energy photon propagating through a low-temperature ( 105 K) medium undergoes Compton scattering with the constituent electrons, the energy of the photon is modified in a way that depends on the scattering angle and the electron velocity distribution. In the limit where the electrons are at rest, a fraction of the photon energy is transferred to the electron according to the Compton formula,
| (1) |
where is the energy of the incoming photon, is the energy of the outgoing photon, is the angle between the incoming and outgoing photons, and is the electron rest-mass energy (= 511 keV). The maximum energy shift per scattering due to the electron recoil is, therefore, for photons that are back-scattered ( = 180∘). An X-ray emission line propagating through a medium with substantial Compton optical depth ( 0.1) has a non-negligible probability of interacting with an electron, resulting in down-scattering of photons and, hence, producing a discernible ”Compton shoulder” between and .
X-ray emission lines at higher energies are ideal for studying the properties of the Compton shoulders, since the Compton scattering opacity relative to that of photoelectric absorption is larger for higher energy photons. The iron K fluorescent line complex at = 6.40 keV, therefore, is particularly promising, and can be produced over an extremely wide range in column density, which makes it ideal for diagnosing the physical properties of a cold medium irradiated by X-rays (Hatchett & Weaver, 1977; Basko, 1978; Illarionov et al., 1979; George & Fabian, 1991; Sunyaev & Churazov, 1996; Matt, 2002). The energy shift of an iron line photon due to a single Compton scattering = 156 eV (see eq.(1) ) is, however, at best, comparable to the spectral resolving power of past X-ray detectors in orbit. Previous detections of the Compton shoulder are unresolved (see, e.g., Molendi, Bianchi & Matt 2003) and, in many cases, they are statistically marginal as well (Iwasawa, Fabian & Matt, 1997; Matt & Guainazzi, 2003). The high spectral resolution of 33 eV (FWHM) at 6.4 keV attained by the High Energy Transmission Grating Spectrometer (HETGS) (Canizares et al., 2000) onboard the Chandra X-ray Observatory (Weisskopf et al., 2000) enables us, for the first time, to resolve the Compton shoulder of the iron K line (see, e.g., Kaspi et al. 2002; Bianchi et al. 2002).
The X-ray binary pulsar GX 3012 is one of the most promising targets for studying the Compton shoulder associated with the 6.4 keV iron K line. The system consists of an accreting magnetized neutron star in a highly eccentric orbit ( = 0.46; Sato et al. 1986; Koh et al. 1997), embedded in the stellar wind from a B2 super-giant companion star (Bord et al., 1976). X-ray continuum photons from the neutron star ionize the K-shell electrons of iron in the wind, a fraction of which is followed by fluorescence emission of the 6.4 keV line. Previous observations of the system have shown an intense iron line with an equivalent width as large as 1 keV (White & Swank, 1984; Leahy et al., 1989; Tashiro et al., 1991; Endo et al., 2002). Given the large mass-loss rate of the companion (Parkes et al., 1980), a substantial fraction of the 6.4 keV photons can subsequently undergo Compton scattering prior to escaping the wind.
In this Letter, we present spectral analysis results of the properties of the iron K line and its Compton shoulder observed in GX 3012 with the Chandra HETGS. As we show, the detection of the fully-resolved Compton shoulder provides a unique opportunity to investigate in detail the physical state and geometrical distribution of cold ( 105 K) material surrounding an X-ray source. In § 2, we describe the observation and the procedures adopted for data reduction. Some basic spectral measurements and observed quantities are also discussed. In § 3, we describe our Monte Carlo simulator used for the spectral analyses. Finally in § 4, we present our measurements and discuss the implications of the results.
2 Observation and Data Reduction
Chandra observed GX 3012 at three different orbital phases: (1) = 0.167–0.179, (2) = 0.480–0.497, and (3) = 0.970–0.982, hereafter referred to as intermediate (IM), near-apastron (NA), and pre-periastron (PP) phases (Pravdo et al., 1995), respectively. We focus primarily on the spectrum of the PP-phase, during which the X-ray luminosity, absorbing column density, and the iron line equivalent width are the highest (Endo et al., 2002). The observation of the PP-phase was performed on 2002 February 3 12:34:10 UT and continued for 40 ksec. All of the data were processed using CIAO v2.2.1. Since the zeroth order image was severely piled-up, the centroid was determined by finding the intersection of the streak events and the dispersed events. We apply a standard spatial filter and an order sorting mask to extract only the first order events. The exposure map and effective area were calculated based on the extraction region described above. Since we are interested mainly in the properties of the iron line, we use data only from the High-Energy Grating (HEG) for the analysis, since it has a higher resolving power ( = 33 eV at 6.4 keV) and larger effective area (20 cm2) in the iron K line region.
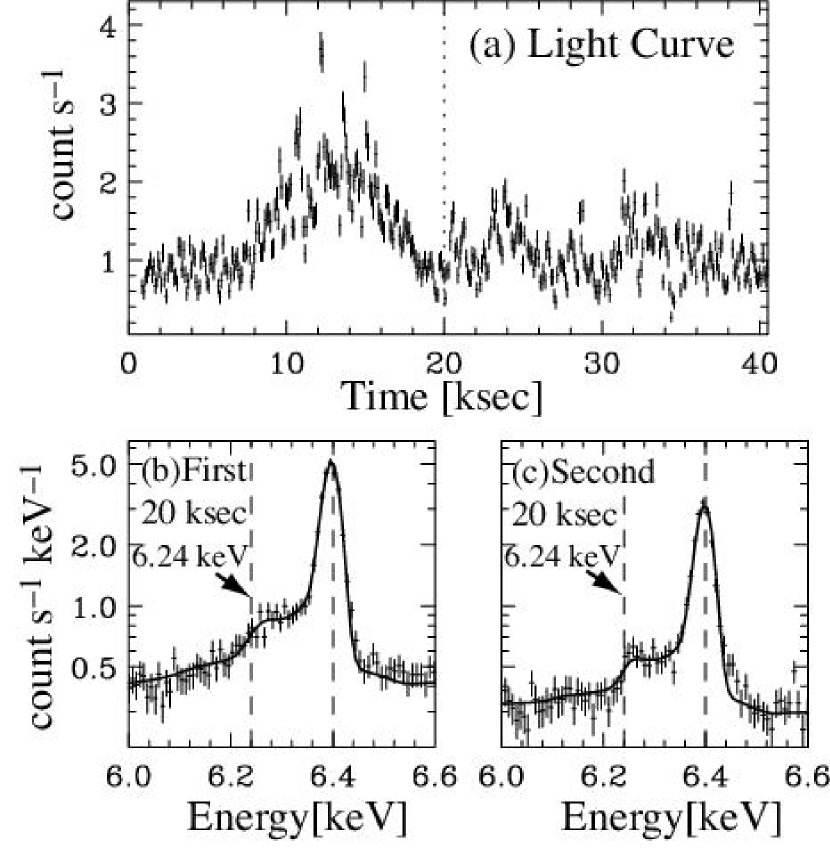
The X-ray light curve in the 1.0–10.0 keV band extracted from the HEG events is shown in the top panel of Fig. 1. An X-ray outburst is seen in the first half of the observation. Hence, we have chosen to divide the data into the first and second halves as indicated by the vertical dotted line, and have extracted spectra from each data segment separately. The observed 2–10 keV fluxes are 13.2 10-10 erg cm-2 s-1 and 9.0 10-10 erg cm-2 s-1 during the first and second halves, respectively. A blow-up of the iron K line spectra are shown in the bottom panels of Fig. 1. In addition to the intense iron K line at 6.4 keV, a shoulder extending towards the low energy side down to 6.24 keV is clearly seen in the data. The equivalent widths of the iron K lines including the shoulders are 643 20 eV and 486 18 eV for the first and second halves, respectively. The width of the shoulder ( 160 eV) precisely matches what is predicted by eq. (1), which strongly indicates that the feature is formed primarily through single Compton scattering of the iron K photons. Changes in the shape of the Compton shoulder as well as in the shoulder flux relative to the un-scattered line flux, can be seen between the spectra of the first and second halves.
3 Monte Carlo Simulation
The Compton shoulder can be used to infer various physical parameters that characterize the scattering medium. The flux ratio of the shoulder to the line is determined by the metal abundance and the optical thickness of the scattering cloud. Its energy distribution, on the other hand, is sensitive to the temperature and the geometrical distribution of the scattering electrons. A discernible change in the profile shown in Fig. 1 implies that these physical parameters are variable between the first and second halves of the observation.
In order to obtain some quantitative information from the spectra, we have constructed a Monte Carlo simulator to compute the emergent spectrum from an X-ray source surrounded by a cloud. We assume a spherical distribution of material motivated by the observed correlation between the iron emission line strength and its corresponding edge depth during the IM, NA, and PP phases. This assumption also significantly simplifies the simulation. The cloud consists of H, He and astrophysically abundant metals (C, N, O, Ne, Na, Mg, Al, Si, S, Cl, Ar, Ca, Cr, Fe and Ni), and all of the metal abundances (Z 2) are allowed to vary together relative to the cosmic values of Feldman (1992). We account for photoelectric absorption and subsequent fluorescent emission, as well as Compton scattering by free electron. The angular-dependence of the Compton scattering cross section is fully accounted for and the electrons are assumed to have a Maxwellian energy distribution. The photons may suffer multiple interactions and are traced until they completely escape the cloud. The energy distribution of the emergent photons are then histogrammed to produce a spectrum.
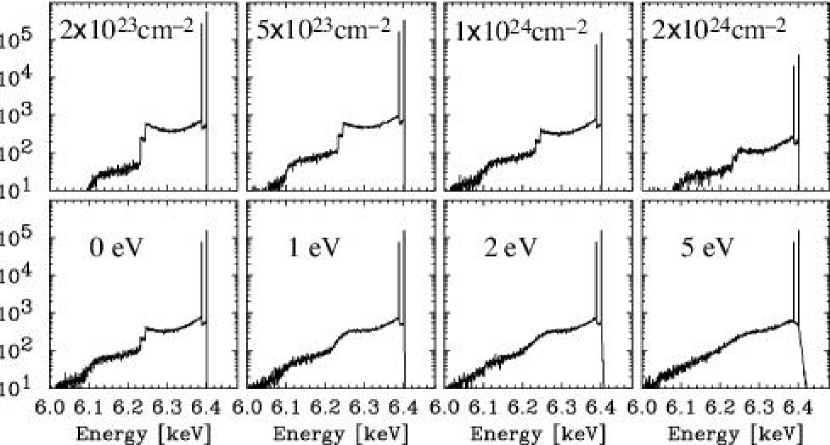
Fig. 2 shows some of the results from the simulations for the iron line and its Compton shoulder with varying hydrogen column density () and electron temperature (). The original iron K and K photons are assumed to be distributed according to the K-shell photoionization rate at each radius from the central continuum source. The distribution of the original iron K photons is also calculated with the simulator, in which a power-law X-ray source with a photon index of 1.0 is assumed. In the upper panels of Fig. 2, one can see an increase in the scattered flux relative to the narrow line flux as is increased. The lower panels of Fig. 2 show the temperature dependence of the shape of the Compton shoulder. More smearing is seen at higher . Photons between 6.24 keV and 6.40 keV are due primarily to single-scattered photons, and the component below 6.24 keV result from multiple-scattering, which are important even at moderate optical depths.
4 Discussion
We performed spectral fits based on the simulation for the iron line and the Compton shoulder. A fits file of ”table models” were generated from the results of the simulations, which were then incorporated into XSPEC v11.2. The parameters of the model are , , and the metal abundances. The radial dependence of the intrinsic K line emissivity is fixed to what one expects from a photon index of . We have confirmed that this assumption produces at most a 5 % error in the emergent line profile for between 0.0 and 2.0.
4.1 Metal Abundance
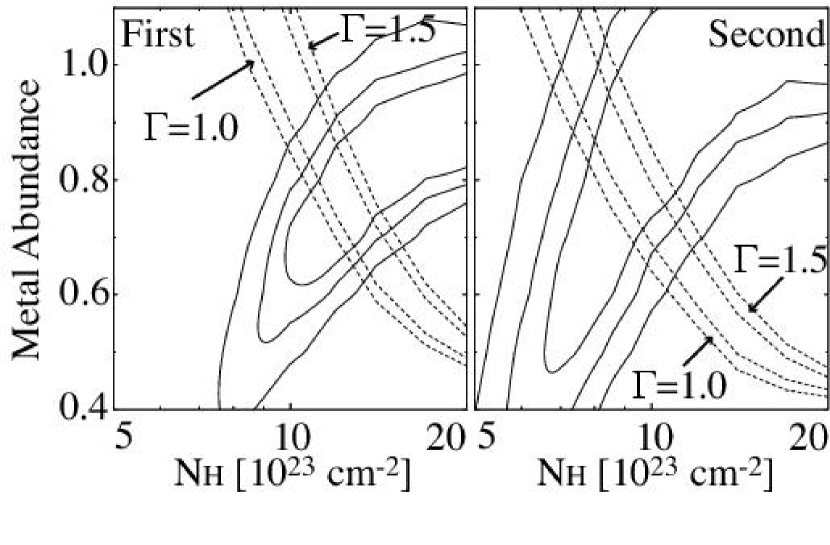
We first attempt to determine the metal abundances from the total PP-phase spectrum. In doing this, we note that two independent constraints between the abundance and the hydrogen column density are available, as described below. The first one arises from the observed intensity ratio of the shoulder to the narrow line. For a given ratio, an increase in column density must be accompanied by an increase in abundance and, hence, the two parameters are correlated as shown in Fig. 3. The other constraint originates from the observed equivalent width of the line. In this case, the abundance is anti-correlated with the column density. From these two constraints (see Fig. 3), the metal abundance is determined to be 0.65–0.82 times of the cosmic value (Feldman, 1992), assuming = 1.0. The slope, however, is not well-measured due to the limited bandpass of the Chandra gratings. If we allow a range in of 1.0–1.5, which has been seen in previous hard X-ray observations (Pravdo et al., 1995; Orlandini et al., 2000), the metal abundance is determined to be 0.65–0.90 times of the cosmic. Note that this is consistent with that of typical OB-stars (Daflon et al., 2001).
4.2 Hydrogen Column Density and Electron Temperature
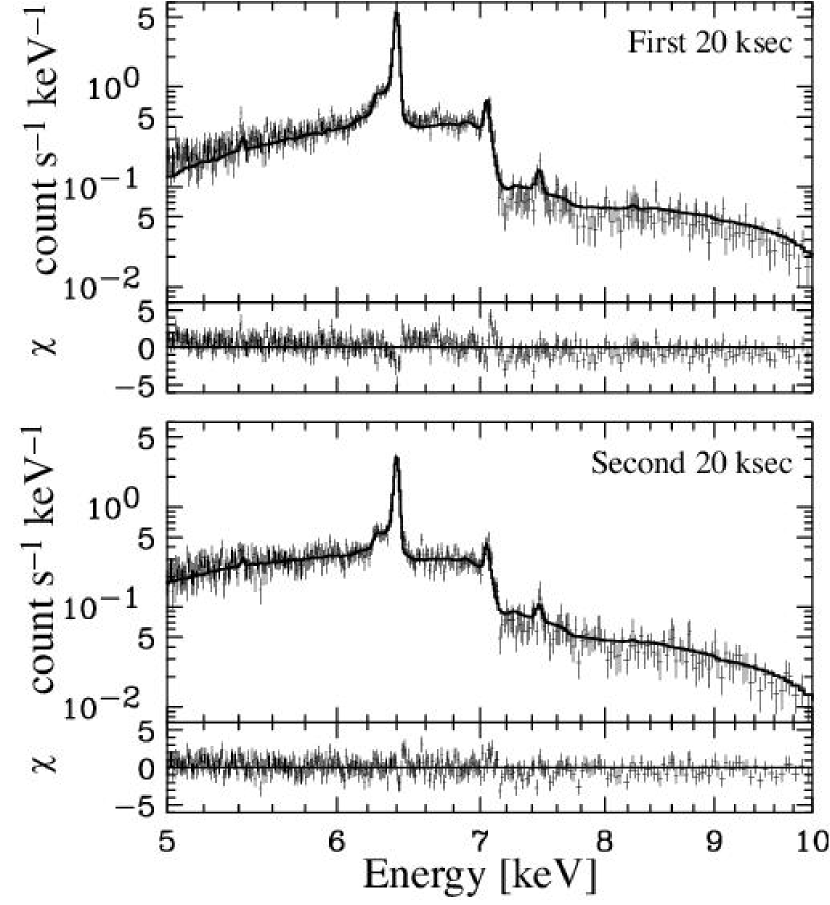
Adopting the metal abundance of 0.75 cosmic derived in § 4.1, we find the values for . The derived values are listed in Table 1, and the models are shown by the lines superimposed on the data in Fig. 1. The difference in the observed Compton profile can be described by a change in the column density, which results in a variation in the number-of-scatterings distribution even at these moderate optical depths. We have also obtained upper-limits (90 % confidence levels) to of 3.4 eV and 0.6 eV for the first- and second-half spectra, respectively. Interestingly, the derived electron temperatures are consistent with that expected for the stellar wind being cooled via adiabatic expansion from the surface of the companion star with a photospheric temperature of 2 eV (Bord et al., 1976). Interestingly, the column density as inferred from the Compton profile, in fact, reproduces the spectrum in the entire HEG bandpass for a power-law photon index of 1.0. Fig. 4 shows the observed spectra overlaid with the simulated spectra. Reduced chi-squared values of 1.30 and 0.95 were obtained for the first and second halves spectra, respectively. Though some residual flux still remain, the simulations, which are based on parameters derived from the line and Compton shoulder, provide fairly good descriptions of the broadband data. Assuming a distance of 1.8 kpc (Parkes et al., 1980), the absorption-corrected X-ray luminosities in the 2–10 keV are 3.5 1036 erg s-1 and 1.6 1036 erg s-1 for the first and second halves, respectively.
4.3 Future Prospects
We have demonstrated through our quantitative analysis of the Chandra HETGS data of GX 3012 that the Compton shoulder provides a sensitive diagnostic for the physical conditions of cold material irradiated by X-ray photons. The substantial improvement in the spectral resolution (6 eV at 6 keV) and the effective area ( 300 cm2 at 6 keV) accessible with the X-ray Spectrometer (XRS) onboard the Astro-E2 observatory, which is planned to be deployed in 2005, will allow us to study the Compton shoulder profile in various classes of X-ray sources, such as a molecular cloud irradiated by a proto-star, an accretion disk swirling around a compact object, and a dusty torus surrounding an active galactic nucleus. More detailed geometrical information can be obtained by studying the energy distribution and, hence, the scattering angle distribution in the circumsource medium. Compton scattering by electrons in bound systems produces spectral signatures that are distinct from those produced by free electrons (Sunyaev & Churazov, 1996; Vainshtein et al., 1998; Sunyaev, Uskov & Churazov, 1999), which may be detectable with future X-ray spectrometers.
References
- Basko (1978) Basko, M.M. 1978, ApJ, 223, 268
- Bianchi et al. (2002) Bianchi, S., Matt, G., Fiore, F., Fabian, A.C., Iwasawa, K., & Nicastro, F. 2002, A&A, 396, 793
- Bord et al. (1976) Bord, D.J., Mook, D.E., Petro, L., & Hiltner, W.A. 1976, ApJ, 203, 689
- Canizares et al. (2000) Canizares, C. R. et al. 2000, ApJ, 539 L41
- Daflon et al. (2001) Daflon, S., Cunha, K., Becker, S.R., & Smith, V.V. 2001, ApJ, 552, 309
- Endo et al. (2002) Endo, T., Ishida, M., Kunieda, H., Inoue, H., & Nagase, F. 2002, ApJ, 574, 879
- Feldman (1992) Feldman, U. 1992, Physica Scripta. 46, 202
- George & Fabian (1991) George, I.M., & Fabian, A.C. 1991, MNRAS, 249, 352
- Hatchett & Weaver (1977) Hatchett, S., & Weaver, R. 1977, ApJ, 215, 285
- Illarionov et al. (1979) Illarionov, A., Kallman, T., McCray, R., & Ross, R. 1979, ApJ, 228, 279
- Iwasawa, Fabian & Matt (1997) Iwasawa, K., Fabian, A.C., & Matt, G. 1997, MNRAS, 289, 443
- Kaspi et al. (2002) Kaspi, S. et al. 2002, ApJ, 574, 643
- Koh et al. (1997) Koh, D.T. et al. 1997, ApJ, 479, 933
- Leahy et al. (1989) Leahy, D.A., Matsuoka, M., Kawai, N., & Makino, F. 1989, MNRAS, 237, 269
- Matt (2002) Matt, G. 2002, MNRAS, 337, 147
- Matt & Guainazzi (2003) Matt, G., & Guainazzi, M. 2003, MNRAS, 341, L13
- Molendi, Bianchi & Matt (2003) Molendi, S., Bianchi, S., & Matt, G. 2003, MNRAS, 343, L1
- Orlandini et al. (2000) Orlandini, M., dal Fiume, D., Frontera, F., Oosterbroek, T., Parmar, A.N., Santangelo, A., & Segreto, A. 2000, Adv. Space Res., 25, 417
- Parkes et al. (1980) Parkes, G.E., Culhane, J.L., Mason, K.O., & Murdin, P.G. 1980, MNRAS, 191, 547
- Pravdo et al. (1995) Pravdo, S.H., Day, Charles, S.R., Angelini, L., Harmon, B.A., Yoshida, A., & Saraswat, P. 1995, ApJ, 454, 872
- Sato et al. (1986) Sato, N., Nagase, F., Kawai, N., Kelley, R.L., Rappaport, S., & White, N.E. 1986, ApJ, 304, 241
- Sunyaev & Churazov (1996) Sunyaev, R.A., & Churazov, E.M. 1996, Astronomy Letters, 22, 648
- Sunyaev, Uskov & Churazov (1999) Sunyaev, R.A., Uskov, D.B., & Churazov, E.M. 1999, Astronomy Letters, 25, 199
- Tashiro et al. (1991) Tashiro, M., Makishima, K., Ohashi, T., Sakao, T., & Sansom, A.E. 1991, MNRAS, 252, 156
- Vainshtein et al. (1998) Vainshtein, L.A., Sunyaev, R.A., & Churazov, E.M. 1998, Astronomy Letters, 24, 271
- Weisskopf et al. (2000) Weisskopf, M.C., Tananbaum, H.D., Van Speybroeck, L.P., & O’Dell, S.L. 2000, SPIE, 4012, 2
- White & Swank (1984) White, N.E., & Swank, J.H. 1984, ApJ, 287, 856
| ( cm-2) | (eV) (upper limit) | / d.o.f.aaOnly the 6.0 – 6.6 keV region has been used in the spectral fit. | ||
|---|---|---|---|---|
| First | 12.0 | 0.96 | 0.5 ( 3.4) | 65.6 / 71 |
| Second | 8.5 | 0.68 | 0.0 ( 0.6) | 82.4 / 71 |
Note. — Errors and upper limits designate 90 % confidence levels.