MCTP-XX-XX
August 2003
Detectability of Weakly Interacting Massive Particles
in the Sagittarius Dwarf Tidal Stream
Abstract
Tidal streams of the Sagittarius dwarf spheroidal galaxy (Sgr) may be showering dark matter onto the solar system and contributing (0.3–23)% of the local density of our Galactic Halo. If the Sagittarius galaxy contains WIMP dark matter, the extra contribution from the stream gives rise to a step-like feature in the energy recoil spectrum in direct dark matter detection. For our best estimate of stream velocity (300 km/sec) and direction (the plane containing the Sgr dwarf and its debris), the count rate is maximum on June 28 and minimum on December 27 (for most recoil energies), and the location of the step oscillates yearly with a phase opposite to that of the count rate. In the CDMS experiment, for 60 GeV WIMPs, the location of the step oscillates between 35 and 42 keV, and for the most favorable stream density, the stream should be detectable at the 11 level in four years of data with 10 keV energy bins. Planned large detectors like XENON, CryoArray and the directional detector DRIFT may also be able to identify the Sgr stream.
1 Introduction
The dark halo of our galaxy may consist of WIMPs (weakly interacting massive particles). Direct detection experiments attempt to observe the nuclear recoil caused by these dark matter particles interacting with the nuclei of the detector. Currently many such detectors are in operation worldwide, including CDMS, COSME, CRESST, DAMA, DRIFT, Edelweiss, Elegant V, HDMS, IGEX, LiF/Tokyo, LosAlamos, MiBeta, ROSEBUD, Saclay, UKDMC, and Zeplin. These detectors may be able to observe not only the general halo component but also streams of dark matter moving through our solar system.
Recently, the Sloan Digital Sky Survey (SDSS) and the Two Micron All Sky Survey (2MASS) surveys [1, 2] have traced the tidal stream of the Sagittarius dwarf galaxy (Sgr) more than around the sky. It is believed that this tidal stream is currently moving through the solar neighborhood, and that it contains dark matter in addition to stars. In this paper we investigate the possibility of detecting WIMP dark matter in this stream via direct detection experiments.
The Sagittarius galaxy, a dwarf spheroidal galaxy of roughly , is a satellite of our own much larger Milky Way Galaxy, located inside the Milky Way, 15 kpc behind the Galactic Center and 6 kpc below the Galactic Plane [3]. There are two streams of matter that extend outwards from the main body of the Sgr galaxy. These streams, known as the leading and trailing tidal tails, are made of matter tidally pulled away from the Sgr galaxy. The leading tail may be showering matter down upon the solar system [2]. The flow is in the general direction orthogonal to the Galactic plane and has a speed of roughly 300 km/s (see discussion in §2 below). This speed is comparable to that of the relative speed of the Sun and the WIMPs in the general dark halo. Hence one can hope to detect the stream in direct detection experiments.
The detectability depends on the density of dark matter in the stream. The mass-to-light ratio in the stream is unknown, but is plausibly at least as large as that in the Sgr main body; in fact, the in the stream may be significantly larger because the dark matter on the outskirts of the main body would be tidally stripped before the (more centrally located) stars. Various determinations of the for the Sgr main body give values in the range 25 to 100 (see the discussion in [2] and references therein). With our assumptions, we find a density of dark matter in the stream in the range 0.3 to 23% of the local dark halo density. If the dwarf does not contain dark matter or the stream does not pass through the solar neighborhood, then the contribution to the local dark matter density is zero.
This additional flux of WIMPs from the stream shows up as a 0.3–23% increase in the rate of nuclear recoils at energies below a characteristic energy , the highest energy that WIMPs in the stream can impart to a target nucleus. Hence, there is a step in the energy recoil spectrum; the count rate in the detector is enhanced at low energies, but then returns to the normal value (due to Galactic Halo WIMPs) at all energies above the critical energy . This feature can be observed as a sharp decrease in the count rate above a characteristic energy that depends on the mass of the target nucleus, the mass of the WIMP, and the speed of the stream relative to the detector.
It is well known that the count rate in WIMP detectors will experience an annual modulation [4, 5] as a result of the motion of the Earth around the Sun: the relative velocity of the detector with respect to the WIMPs depends on the time of year. We find that the count rate of WIMPs in the stream is a maximum on June 28111We suggest that readers prepare their WIMP shields. and a minimum on December 27.222For energies near , there is a small range of energy recoils in which the count signal has the same phase as the characteristic energy and so peaks in December. Note that this modulation has a different phase than does the ordinary annual modulation of WIMPs in the Galactic halo, which peaks on June 2 for high energy recoils (and December 20 for low energy thresholds [6, 7, 8, 9]). Similarly, we find that the value of the characteristic energy of the step in the energy recoil spectrum oscillates in time with a period of a year. The step location experiences an annual modulation exactly 180∘ out of phase with that of the stream count rate. To give a number, for a 60 GeV WIMP detected in a Ge-73 detector, the characteristic energy for the Sgr stream varies between 25 and 35 keV. As we will show, this step feature in the energy recoil spectrum should be detectable at the three level in the CDMS experiment using two kilograms of 73Ge and taking four years of data with 10 keV energy bins.
In 1994 and again in 2001, the HEAT collaboration [10, 11] detected an excess of cosmic ray positrons. Baltz et al. [12, 13] explored the possibility that this excess is due to the annihilation of neutralino dark matter in the Galactic halo. They found that neutralino annihilation can produce enough positrons to make up the measured excess in the Minimal Supersymmetric Standard Model provided there is an additional enhancement to the signal due to dark matter clumps in the Galactic halo333An alternate explanation within the MSSM, namely neutralinos that were produced non-thermally in the early Universe, was suggested by Kane et al. [14, 15].. Baltz et al. found that, under current constraints on the MSSM, the “boost factor” needs to be at least 30 in the signal. The Sagittarius stream provides at most a 23% enhancement of the signal, and hence is unlikely to provide an explanation of the boost factor required for neutralino annihilation to explain the HEAT data. However, the uncertainties in the propagation of cosmic rays in the galaxy are large and it may be possible that a smaller boost factor may suffice, so further studies are warranted.
Detection of this dark matter stream would be important also for our understanding of galaxy formation. The traditional assumption that the halo population of stars is old and well mixed has been seriously challenged by recent observations that the outer parts of the stellar halo contain tidal debris that is merging with the Milky Way even at the current epoch. Recent N-body simulations of galaxy formation suggest that there may be dwarf satellites of the Milky Way that contain only dark matter and no stars. If dark matter can be detected in the Sagittarius stream, then we could use dark matter detectors on Earth to look for remnants of these dark companions of our Milky Way.
2 Local dark matter from the leading tail of Sagittarius
The factors that affect dark matter direct detection experiments are the local dark matter density and velocity vector of material in the leading tail of the Sgr dwarf galaxy that passes through the solar neighborhood. Below, we estimate that the (local) Sgr leading tail is moving with a velocity of 30090 km/s in the direction , where is the north Galactic pole, and is in the direction of the local disk stars’ motion (). Equivalently, the local motion of the Sgr leading tail points in the direction , where is the Galactic longitude and is the Galactic latitude. All velocities are measured with respect to the rest frame of the center of mass of the Milky Way galaxy. We will also find an estimated range for the local density of dark matter of:
| (1) |
which corresponds to (0.3-23)% of the local density of the isothermal Galactic halo.
The density calculation is highly uncertain, since (1) the stellar density is not well measured anywhere along the stream and has not been directly detected in the solar neighborhood, and (2) is highly uncertain in the Sagittarius dwarf itself and is unmeasured in the tidal stream. Models of the tidal disruption have not been developed or constrained by observations to the point that they usefully predict the local properties of coherent dark matter in the solar neighborhood. We will derive our estimates from empirical observations of the old populations of stars in the tidal stream. Blue horizontal branch stars and main sequence turnoff stars are old enough that their populations are not likely to have significantly changed in the time since these stars were stripped from the dwarf galaxy. The important measurable quantities are (1) the number of stars observed in some portion of the tidal stream, (2) the volume of that portion of the tidal stream, (3) the relationship between number of observed stars of a particular type and total luminosity in stars, and (4) in the tidal stream.
2.1 Velocity in the solar neighborhood
The Sgr dwarf galaxy is currently about 16 kpc from the Galactic center, near its closest approach to the Galactic center (perigalacticon). As seen from the Sun, Sgr has a radial velocity of km/s and a tangential velocity of km/s [16]. Correcting for the solar motion as given in §3.2, we derive a current velocity of km/s for the dwarf, in the reference frame of the Galaxy center.
Stars in the leading tidal tail, which extends to near the solar position, were stripped from the side of the dwarf that is closer to the center of the Milky Way. At the time that the stars are stripped from the gravitational pull of the dwarf galaxy and released into the potential of the Milky Way, they have about the same orbital velocity as the dwarf galaxy itself (we assume that the dwarf galaxy stars have no bulk rotation). Due to their closer proximity to the Galactic center, they have a lower gravitational potential energy, and therefore shorter orbital periods - thus creating the leading tail.
Stars in the trailing tail were stripped at larger distances from the center of the Milky Way. The higher orbital energy of these stars produces larger distances from the Galactic center and longer orbital periods.
The trailing tidal tail has been traced in Two Micron All Sky Survey (2MASS; [17]) M giant stars through nearly of sky south of the Galactic plane, to a maximum distance of 50 kpc from the Galactic center. The tidal tails lie on a plane that passes through the Galactic center. The Sun lies within a kiloparsec of that plane, and near the path of the leading Sgr debris [2].
The stars in the tidal tails must conserve both energy and angular momentum, in the absence of dynamical friction. Since the stars in the trailing tail of Sgr have an apogalacticon of 90 kpc or more, while the stars in the leading tail have an apogalacticon of only about 45 kpc [1], the trailing tail stars must have significantly higher energies than the stars in the leading tail. If most of the stars are stripped near the perigalacticon of the Sagittarius dwarf, at 16 kpc from the center of the Milky Way, then the leading and trailing debris must have been stripped from parts of the Sagittarius dwarf that differ in Galactocentric distance by at least 10 kpc [18]. It is sensible, therefore, that the perigalacticon of the stars in the leading tail could be 11 kpc or less.
Since the mass of the Milky Way is distributed throughout its volume and is not concentrated at the center, stars do not travel in closed orbits, but rather in rosette patterns. The angle between successive perigalacticon passages is less than 360∘. The Sun is near the first expected perigalacticon passage of the leading tail, at about the right distance. Since the tidal stream is approximately 6 kpc across, it is reasonable to suspect that the tidal steam passes through the solar position. Majewski et al. [2] show that stellar debris appears to be raining down on the solar position from approximately the direction of the north Galactic pole.
Without significant dissipative forces, the average speed of the tidal debris in the solar neighborhood (which is at perigalacticon) should be the same as the current speed of the Sgr dwarf (which is also at perigalacticon). The debris should travel approximately in the plane of the Sgr dwarf tidal debris. If the debris is near perigalacticon, then its motion is approximately perpendicular to the line from the Sun to the Galactic center. From these three conditions, we derive that the debris velocity is in the direction , where is the north Galactic pole, and is in the direction of the local disk stars’ motion (). In terms of galactic latitude and galactic longitude , this direction is equivalent to the direction .
2.2 Simple estimate of local dark matter density
In this section we use simple parameters of the Sgr dwarf tidal system to roughly estimate the Sgr dwarf contribution to the local dark matter density. In the next section we will make more careful estimates of the parameters.
Published estimates of the original total mass of the Sagittarius dwarf galaxy are in the range to . The lower number is within a factor of two of current estimates of the mass of the Sgr dwarf, and the larger number is derived from the need to keep the dwarf intact for a Hubble time [19]. The width of the tidal stream in 2MASS M stars is estimated to be 4-8 kpc [2]. Below, we will calculate a FWHM of 6 kpc from the data from the SDSS [20]. This width is of the order of the size of the dwarf galaxy.
Estimates of the current mass of the Sgr dwarf galaxy are in the range
| (2) |
possibly several orders of magnitude lower than the original mass of the Sgr dwarf at its time of formation. The lower mass is the mass within the Sgr dwarf tidal radius calculated by Majewski et al. [2] from the dispersion of the radial velocities of Sgr dwarf stars. Comparing their mass to the luminosity of the Sgr, they derive a mass-to-light ratio of 25-29 in solar units. Other authors have argued for as high as 100 [16] (four times as high) based on the need to keep the Sgr dwarf intact for a Hubble time. This produces the upper end of the current mass range. Given that the ratio is expected to be 25 or higher, calculations of the mass density in the Sgr dwarf and tidal tails are essentially equal to the dark matter density.
A typical disruption model [21] assumes the current mass of the Sgr dwarf is about , and that the dwarf lost about 2-3 times that mass in the last gigayear (somewhat longer than an orbit). If this is spread out into a tidal stream 6 kpc in diameter and 250 kpc in length (this is the length of the observed tidal stream in stars), then an estimate of the local dark matter density is:
| (3) |
This is one percent of the estimated local dark matter density.
2.3 Detailed calculation of the stream density
We now explore the range of dark matter local dark matter densities that are consistent with our knowledge of the Sagittarius system, assuming that the leading tidal tail passes through the solar neighborhood.
In order to calculate the local dark matter density from data, we would like to measure the local mass density of stars from the stream, and multiply by calculated for our position on the leading tidal tail. Neither the local density of Sgr stream stars, nor the local mass-to-light ratio in the stream, is known. Instead, we can calculate the density of F/G turnoff stars at one location along the trailing tidal tail, tabulate the blue horizontal branch star density at several positions along the leading and trailing tidal streams, and estimate from the Sgr dwarf itself. Using these quantities, we estimate the dark matter density from the Sgr tidal stream in the solar neighborhood.
Specifically, we wish to estimate , the dark matter density of the tail in the neighborhood of the Sun, as the product of three quantities:
| (4) |
Ideally, one would like to measure all of these quantities in the tidal stream at the solar position. Because none of these quantities are known at the solar position, each term will be estimated from other measurable portions of the Sgr tidal stream.
To estimate the first term on the right hand side, we will measure the density of F/G turnoff stars in a portion of the trailing tidal tail 50 kpc from the Sgr dwarf (stripe 82 in the SDSS). The density in this location is the best measured anywhere in the tidal tails. To obtain an estimate of the density at our location, we extrapolate from measurements of Blue Horizontal Branch (BHB) stars at three places along the tidal tails. We discover that the density of the stars in a piece of the leading tail 50 kpc from the Sgr dwarf (stripe 10 in the SDSS) is nearly a factor of two higher, giving us a larger range of possible dark matter densities at the solar position: . The second term on the right hand side of Eq.(4) is then . The third term is . Multiplying together these three factors, we find
| (5) |
where
| the number of Sgr F/G stars per kpc3 in stripe 82, | ||||
| the density of Sgr BHB stars at the solar position, | ||||
| the density of Sgr BHB stars in stripe 82, | ||||
| the current mass of the Sagittarius dwarf, | ||||
| the number of F/G stars in the Sagittarius dwarf, | ||||
| the mass-to-light ratio in the tidal tail, | ||||
| the mass-to-light ratio in the Sgr dwarf. |
Each of these terms is discussed in further detail in the following sections.
2.3.1 Estimating
First, we measure the stellar density of F/G turnoff stars in stripe 82, , about 50 kpc from the Sgr dwarf along the trailing tidal tail. Figure 22 of Newberg et al. [20] shows the counts of F/G turnoff stars along the Celestial Equator. From that figure, one can estimate that in the Sgr stream overdensity labeled S167-54-21.5 (in red), there are 1000 stars per half-degree-wide bin at the peak. It is difficult to estimate the background star counts in that region of the sky, but it is between zero and 400 stars per half degree bin. The total width of the (approximately triangular) profile is 50 degrees, or 100 bins. Thus, we estimate the total number of F/G Sgr stream stars in this 2.5 degree-wide stripe is between 30,000 and 50,000.
In order to calculate the stream density at this position, we need to know the volume represented by the piece of the stream we have sampled. The FWHM of the stream is about in the observed stripe of sky. At a distance of 29 kpc from the Sun, this would imply a stream width of 13 kpc. [Note, however, that the Celestial Equator does not cut through the Sagittarius stream perpendicular to its path across the sky. The angle between the stream direction and the Celestial Equator is [20], thus implying that the actual width of the stream is (13 kpc) kpc.]
We estimate that the angle between the actual tidal stream and the projection of the tidal stream perpendicular to our line of sight is about at this position in the sky [1, 2], so the distance along the stream in the plane of the Celestial Equator is kpc. In the wide stripe we sample 1.3 kpc perpendicular to the Celestial Equator. If the stream is in the range [4,8] kpc deep, then the volume is:
| (6) |
Therefore, the density of F/G turnoff stars in that portion of the stream is:
| (7) |
2.3.2 Estimating
One now asks how much the stellar density varies as a function of position along the stream. This is not well known, but we will estimate it from BHB star counts [1]. It would be better if we could measure the number of F/G turnoff stars, as they a more stable indicator of stellar density. However, the only piece of the stream close enough to the Sun that this quantity has been measured reliably is the stripe 82 data discussed above. Table I summarizes the data and calculations described below.
| stripe | A stars | D (kpc) | (A stars) | Distance along | ||
|---|---|---|---|---|---|---|
| tail from Sgr dwarf | ||||||
| 10 | 125 | 48 | 0.8660 | 0.5071 | 1.14 | 50 kpc, leading |
| 29 | 58 | 83 | 0.9848 | 0.9699 | 0.67 | 150 kpc, trailing |
| 82 | 35 | 29 | 0.9848 | 0.5071 | 0.60 | 50 kpc, trailing |
The stripe number (column 1) refers to the piece of sky scanned in the SDSS. Column two gives an estimate of the number of BHBs in the Sagittarius stream in each of those pieces of data [1]. The third column gives the distance from the Sun to the center of the stream, assuming the absolute magnitude for the BHB stars is .
We define to be the angle between the normal to our line of sight towards a particular piece of the stream and the tangent to the stream at that point. We estimate for stripes 10, 29, 82, respectively [1, 2]. If , then the stream is perpendicular to our line of sight. If is larger than that, then we see a larger distance along the stream in each solid angle of sky. The volume within the stream is inversely proportional to . is tabulated in column 4.
If we define as the angle between the observations and the Sagittarius dwarf stream, then is found by dotting the Sagittarius dwarf plane normal vector with the SDSS observational plane normal vector. The normal to the plane of the Sagittarius dwarf tidal stream is: [2]. In contrast to the referenced paper, we have defined to be positive towards the Galactic center from the Sun. The stripes 10 and 82 are both on the Celestial Equator, so the normal to that observational plane is the north Celestial Pole: . The normal to the plane of observation of stripe 29 is: . If , then we scan directly across the tidal stream. Smaller angles will net a larger effective volume and more stars; the volume is inversely proportional to . We tabulate in column 5 of Table I.
The column 6 in the table above gives a relative density of A stars in each of the three positions along the stream, corrected for projection effects (), and the angle between the stream and the direction we scan across it (). Following the calculation of F/G star density above, the volume sampled in each stripe, for a stream of cross sectional area , is given by:
| (8) |
To estimate A star densities for a stream of diameter 6 kpc, divide the numbers in column 6 by .
Comparing the numbers in column 6, we see that the density in the trailing tail is similar in the two places sampled. The density in the leading tail in the one place sampled is twice as high. The Sagittarius tidal debris at the position of the Sun is further along the leading tail, and we guess from these measurements that it could have a mass density similar to, or twice as large as, that measured in “stripe 82.”
| (9) |
2.3.3 Estimating ,
All that is left now is to find the conversion from the density of turnoff stars to a mass density of dark matter. We will do this by comparing the number of F/G stars in the Sgr dwarf galaxy to the estimated mass of the Sgr dwarf. Figure 6 of Newberg et al. [20] shows a color-magnitude diagram of stars from two small fields near the center of the Sgr dwarf [22], shifted into SDSS colors. The F/G stars in the stripe 82 data were selected with and . This color-magnitude selection was chosen to maximize the overdensity of Sagittarius stars in stripe 82. Since the F/G turnoff stars in Figure 6 of Newberg et al. [20] are a magnitude fainter in , we selected all stars in that figure with and . There are 5786 F/G turnoff stars within these limits.
The field centers of the two Sgr dwarf fields [22] from which the data were taken were both within 1.5 degrees of the center of the Sagittarius dwarf. Figure 5 of [2] shows the density of M giant stars along the major axis of the Sagittarius dwarf. Within 1.5 degrees of the center of the galaxy the density is reasonably flat. The surface brightness in at the center of the Sagittarius dwarf is magnitudes per square arcsecond [23, 24]. The integrated apparent magnitude of the undisrupted portion of the Sgr dwarf is [2]. Using a distance modulus of 16.9 to the dwarf, the total luminosity is , comparable to previous estimates [3, 25]. This means in one square arcsecond near the center of Sgr, the brightness is times less than the brightness of the entire dwarf galaxy. So, if we found 5786 F/G turnoff stars in two fields in size, then the total number of F/G turnoff stars in the Sagittarius dwarf is:
| (10) |
The mass-to-light ratio in the Sgr tidal stream has not been measured by any technique. In analogy to other galaxies, we expect the luminous matter in the progenitor Sgr galaxy to be more concentrated than the dark matter. In tidal disruption, the outer portions of the dwarf galaxy are tidally stripped before the inner portions; the tidal radius decreases as the mass of the galaxy decreases. Therefore, one imagines that in tidal streams is higher than in the originating dwarf, and that the mass-to-light ratio increases with distance from the progenitor, as the more distant pieces were the first to be stripped.
Figure 2 of Padmanabhan et al. [26], shows the radial profiles of luminous matter and dark matter for a stellar Hernquist profile embedded in an adiabatically compressed dark matter halo. at the half light radius is twice the integrated interior to that radius. At 1.5 times the half light radius, rises to three times interior to the half light radius. At three times the half-light radius we virtually run out of luminous matter, so becomes very large.
Since our estimates of the luminous matter in the stream are of the same order of magnitude as the Sgr dwarf itself, the debris at the solar position probably was not stripped very far from the half light radius. We adopt as a reasonable upper limit that in the stream could be a factor of three higher than the current of the dwarf.
| (11) |
Putting this all back into Eq. 4, we derive an estimated range for the local density of dark matter of:
| (12) | |||||
Comparing with the local density of dark matter not in the Sgr stream, GeV/cm3, we see that the Sgr stream contributes an additional 0.3%–23% to the total local dark matter density.
Previously Stiff, Widrow, and Frieman [27] studied the tidal disruption of satellite galaxies falling into the halo of our own. They found that, with probability 0(1), the Sun should be situated within a stream of density % of the local Galactic halo density. Such a prediction is close to the density estimated for the Sgr stream if intermediate values for all variables are used.
3 Direct Detection of WIMPs in the Stream
3.1 Count Rates
More than twenty collaborations worldwide are presently developing detectors designed to search for WIMPs. Although the experiments employ a variety of different methods, the basic idea underlying WIMP direct detection is straightforward: the experiments seek to measure the energy deposited when a WIMP interacts with a nucleus in the detector [28].
If a WIMP of mass scatters elastically from a nucleus of mass , it will deposit a recoil energy , where is the reduced mass, is the speed of the WIMP relative to the nucleus, and is the scattering angle in the center of mass frame. In this paper we consider the contribution to the detection rate from two dark matter components: the usual WIMPs in the Halo of our Galaxy plus the additional contribution from WIMPs in the Sagittarius tidal stream. We compute (following, e.g., [29, 30]) the differential detection rate per unit detector mass (i.e., counts/day/kg detector/keV recoil energy) as
| (13) |
where GeV/cm3 is the standard local halo WIMP density (excluding the stream), is the dark matter density in the Sgr tidal stream, is the mean inverse speed of WIMPs in the standard Galactic halo (excluding those in the stream), is the mean inverse speed of WIMPs in the stream, is the total nucleus-WIMP interaction cross section, is the nucleus recoil momentum, and is a nuclear form factor that takes into account the loss of coherence in WIMP-nucleus interactions for momentum transfers comparable to or larger than the inverse nuclear radius (we normalize ). For detectors consisting of different nuclei, like e.g. NaI or CaWO4, the total rate is a weighted average of the rates for the individual nuclei with weights equal to the mass fraction of each nucleus in the detector. We discuss these quantities in further detail in the following.
The nuclear form factor depends on the type of WIMP-nucleus interactions, namely if they are spin-dependent or spin-independent, and reflects the mass and spin distributions inside the nucleus. For spin-independent interactions, the target nucleus can be approximated as a sphere of uniform density smoothed by a gaussian [31], and the form factor follows as
| (14) |
where , fm, and
| (15) |
is the radius of the nucleus. For spin-dependent interactions, the form factor is somewhat different but again . In general the form factor needs to be evaluated for specific detector nuclei.
For purely scalar interactions,
| (16) |
Here is the number of protons, is the number of neutrons, and and are the WIMP couplings to nucleons. For purely spin-dependent interactions,
| (17) |
Here is the total angular momentum of the nucleus and is determined by the expectation value of the spin content of the nucleus (see [28, 4, 32, 33, 34]).
For the estimates necessary in this paper, we take the WIMP-nucleon cross section to be cm2, and take the total WIMP-nucleus cross section to be444In most instances, so that the following equation results from Eq.(16).
| (18) |
where the is the proton-WIMP reduced mass, and A is the atomic mass of the target nucleus.
Information about the WIMP velocity distribution is encoded into the mean inverse speed ,
| (19) |
where
| (20) |
represents the minimum WIMP velocity that can result in a recoil energy and is the (usually time-dependent) distribution of WIMP velocities relative to the detector.
In this paper, we neglect the rotation of the Earth and take the reference frame of the detector to be the same as that of the Earth. Thus we relate the velocity distribution relative to the detector to the velocity distribution relative to the Galactic rest frame using
| (21) |
| (22) |
where is the velocity of the Earth in the Galactic rest frame. We discuss the motion of the Earth in the next section.
3.2 Motion of the Earth in Galactic coordinates
In this section we write an expression for the velocity of the Earth in the Galactic rest frame. We use a coordinate system in which points toward the Galactic center, toward the direction of Galactic rotation, and toward the North Galactic Pole.
For simplicity, we follow [30] and neglect the ellipticity of the Earth orbit and the non-uniform motion of the Sun in right ascension (an error of less than 2 days in the position of the modulation maximum and minimum; more precise expressions for the motion of the Earth can be found in [35, 36]). Thus we write the velocity of the Earth in terms of the Sun ecliptic longitude as
| (23) |
Here
| (24) |
is the velocity of the Local Standard of Rest, which points in the direction of Galactic rotation, and
| (25) |
is the Sun’s peculiar velocity. (The uncertainty in the Sun’s peculiar velocity is of the order of 0.2 km/s in the direction and of as much as 3 km/s in the and directions [37]; the corresponding uncertainty in the phase constant of the modulation is of the order of several days, larger than the error from neglecting the ellipticity of the Earth orbit.) Finally,
| (26) |
is the orbital speed of the Earth.
The unit vectors and define the plane of the Earth orbit, the ecliptic. They are in the direction of the Sun at the spring equinox and at the summer solstice, respectively. In Galactic coordinates,
| (27) | |||
| (28) |
The Sun ecliptic longitude can be expressed as a function of time in years with at January 1 as
| (29) |
Here 0.218 is the fraction of year before the spring equinox (March 21).
3.3 Recoil Spectrum of Galactic and Sgr stream components
In this paper we consider two different sources of WIMPs that contribute to count rates in detectors: WIMPs in the Milky Way halo and WIMPs in the Sgr stream. The function of Eqs.(13,19) is different for these two contributions.
Galactic Component: For WIMPs in the Milky Way halo, the most frequently employed background velocity distribution is that of a simple isothermal sphere [5]. In such a model, the Galactic WIMP speeds with respect to the halo obey a Maxwellian distribution with a velocity dispersion truncated at the escape velocity ,
| (30) |
Here
| (31) |
and
| (32) |
with , is a normalization factor. For the sake of illustration, we take km/s and km/s.
It can be shown that for the WIMPs in the isothermal halo
| (36) |
where , , and .
Sgr Stream Component: For WIMPs in the Sgr stream, we can at first assume that they all move at the same velocity
| (37) |
and later consider that in addition they have a small velocity dispersion somewhat larger than 20 km/s. The additional flux of WIMPs from the stream shows up as a 0.3–23% increase in the rate of nuclear recoils below the highest energy that WIMPs in the stream can impart to a target nucleus. Hence, there is a step in the energy recoil spectrum: the count rate in the detector is enhanced at low energies, but then returns to the normal value (due to Galactic Halo WIMPs) at all energies above a critical energy . This feature can be observed as a sharp decrease in the count rate at a characteristic energy that depends on the mass of the target nucleus, the mass of the WIMP, and the speed of the stream relative to the detector.
If we neglect the velocity dispersion, the velocity distribution of the WIMPs in the Sgr stream becomes a Dirac delta function
| (38) |
and their mean inverse speed computed from Eq. (19) is constant up to the characteristic energy ,
| (39) |
Here is the Heaviside function, and
| (40) |
is the relative speed of the WIMPs with respect to the nucleus. The characteristic energy at which there is a step in the recoil spectrum is
| (41) |
This characteristic energy is the maximum recoil energy that can be imparted to the nucleus, and can be obtained as follows: The maximum momentum transferred from a WIMP to a nucleus occurs when the WIMP bounces back and is . The maximum recoil energy of the nucleus then follows as .
Effect of Velocity Dispersion of Sgr stream: The effect of a velocity dispersion in the Sgr stream is to smooth out the edges of the step. We assume that the WIMPs in the Sgr stream follow a Maxwellian velocity distribution with bulk velocity ,
| (42) |
The mean inverse speed in this case can be obtained using the expression of after taking the limit and replacing with and with .
| (43) |
3.4 Sgr Stream Annual Modulation
It is well-known in the case of WIMPs in the Galactic Halo that the signal experiences an annual modulation [4, 5], with a peak on June 2 (for an isothermal halo). Similarly, the WIMPs in the Sgr stream also have an annual modulation in the count rate. As we will show, the count rate of the stream WIMPs peaks in June and is a minimum in December. In addition, the position of the step depends on time, and so is annually modulated. It is higher in winter and lower in summer (i.e. its phase is opposite to that of the count rate).
The time dependence of can be made explicit as follows.
| (44) |
with yr,
| (45) | |||||
| (46) |
and is the solution of
| (47) |
Here
| (48) |
For our reference case of km/s in the direction , we find that the amplitude of the modulation and that is maximum on December 27 ( yr) and minimum about six months later on June 28 ( yr). Other values of between 100 km/s and 300 km/s, and other angles within of the direction downward of the Galactic plane, give a modulation amplitude that can be as low as 2% or as high as 18%. The amplitude and phase of the modulation do not depend on the target nucleus, the WIMP mass, or the density of WIMPs in the stream. They depend on the magnitude and direction of the Sgr stream velocity. The direction of the stream will be known better and better as further observations of stars in the stream are made.
The count rate of the signal from the stream in the detector is also modulated. For most of the recoil energy range, the phase of the count rate from the stream is opposite to the phase of the characteristic energy, i.e. for our standard case it peaks on June 28. For energies near , there is a small range of energy recoils in which the count signal has the same phase as the characteristic energy and so peaks in December. The phase of the Sgr stream annual modulation is different from that of the normal annual modulation of WIMPs in the Galactic halo, which peaks on June 2. Contrary to the modulation of the characteristic energy, the count rate of the stream signal depends on the target nucleus, the WIMP mass, and the stream density, in addition to the magnitude and direction of the Sgr stream velocity.
3.5 Directional detection of WIMPs
A possibility of separating events due to WIMPs in the Sgr stream from those in the local isothermal halo is to exploit detectors that can record the direction of individual nuclear recoils (directional detection). It has been difficult to build WIMP detectors sensitive to the direction of the nuclear recoils. However, a recent promising development is the DRIFT detector [41]. The DRIFT detector consists of a negative ion time projection chamber, the gas in the chamber serving both as WIMP target and as ionization medium for observing the nuclear recoil tracks. The direction of the nuclear recoil is obtained from the geometry and timing of the image of the recoil track on the chamber end-plates. A 1 m3 prototype has been successfully tested, and a 10 m3 detector is under consideration. The prototype contains kg of carbon disulfide (CS2) as active target.
The differential detection rate including the direction of the nuclear recoil can be written using the results of [42] as
| (49) |
where is a unit vector in the direction of the nuclear recoil, is an infinitesimal solid angle in the direction , is defined above (Eq.20), and
| (50) |
is the 3-dimensional Radon transform of the velocity distribution function (in our case, of and , respectively).
The Radon transforms of the velocity distributions we need have been computed in [42]. For the truncated Maxwellian distribution we assume for the WIMPs in the isothermal halo, we have
| (51) |
For the WIMPs in the Sgr stream, assuming a Maxwellian velocity distribution with velocity dispersion , we have
| (52) |
where
| (53) |
When the velocity dispersion is neglected, the Radon transform for the stream reduces to
| (54) |
The latter case has a simple geometrical interpretation in the space of vectors . The Dirac delta function forces the velocity to change with the recoil direction according to . As varies, the vectors describe the surface of a sphere centered in and passing through the origin. The sphere has diameter , and it is symmetric for rotations around .
With a small velocity dispersion in the Sgr stream, the recoil vectors due to WIMPs in the stream are still approximately concentrated around the sphere just described. On the contrary, the recoils due to WIMPs in the isothermal halo are smoothly distributed over a wide region of space. It is this big difference in the recoil distributions from WIMPs in the isothermal halo and in the Sgr stream that may allow their separation.
For detectors consisting of different nuclei, like e.g. CS2 for DRIFT, the total rate is a weighted average of the rates for the individual nuclei with weights equal to the mass fraction of each nucleus in the detector. In this case it is not possible to know with which type of nucleus the WIMP scattered in a given event. Hence it is not possible to obtain the magnitude of the nuclear momentum or the velocity , since they depend on the nuclear mass . In this case, it is convenient to present the directional recoil spectrum in terms of the quantity
| (55) |
which is a vector with magnitude equal to the recoil energy and direction pointing in the recoil direction. We call it the directional recoil energy. The components of the directional recoil energy are the product of the recoil energy and the direction cosines of the nuclear recoil momentum. Since the volume element in the space is , the relevant rate to plot is
| (56) |
which is measured in counts per kg-day per keV3.
4 Results
In Table II, we list the values of the characteristic energy of the step in the energy recoil spectrum due to WIMPs in the Sgr stream appropriate to our reference case ( km/sec toward ) for different target nuclei and WIMP masses. As discussed above, experiences an annual modulation, with a maximum in June and a minimum in December.
| Target nucleus | =60 GeV | =100 GeV | =500 GeV | |||
|---|---|---|---|---|---|---|
| 73Ge | 42.3 | 35.1 | 68.2 | 56.7 | 149.7 | 124.3 |
| 23Na | 33.0 | 27.4 | 41.2 | 34.3 | 56.0 | 46.5 |
| 127I | 37.8 | 31.4 | 70.2 | 58.3 | 219.6 | 182.4 |
| 40Ca | 40.2 | 33.4 | 56.1 | 46.6 | 91.7 | 76.2 |
| 183W | 32.6 | 27.1 | 65.9 | 54.7 | 267.0 | 223.4 |
| 16O | 27.1 | 22.5 | 32.1 | 26.6 | 40.0 | 33.2 |
| 131Xe | 37.5 | 31.1 | 70.0 | 58.2 | 223.8 | 185.9 |
| 27Al | 31.6 | 29.4 | 45.6 | 37.9 | 64.8 | 53.8 |
The annual modulation of the characteristic energy can in principle be used to identify the signal due to WIMPs in the Sgr stream. In particular, the annual modulation is a useful tool to differentiate between an increase in the count rate due to WIMPs in the Sgr stream at energies below , and an increase due to modifications of the velocity distribution of Galactic halo WIMPs. These possibilities are difficult to distinguish by simply examining the shape of the recoil spectrum because of the finite energy resolution and the binning of data in recoil energy in a real experiment. For this tool to be effective, the energy resolution must of course be better than the difference between the maximum and minimum values of . As discussed in Section 3.4 above, this difference corresponds to an energy resolution of 2-18% depending on the exact velocity of the Sgr stream. For our reference case of km/sec in the direction , the value of is modulated by 9% over the course of the year. As long as the uncertainty in energy due to the energy resolution is smaller than the energy shift in , one should be able to detect its annual modulation.
We note that the values of are indeed in the range accessible to current and upcoming dark matter experiments. For example, the NaI detector of the DAMA experiment [43] has an energy threshold of 2 keV electron equivalent, which corresponds to 22 keV recoil energy for iodine; since iodine is much heavier than sodium, WIMP interactions with iodine dominate the count rate, and the conversion factor between keVee and keV is a factor of 11 for iodine. Hence for WIMP masses heavier than 50 GeV, the step lies above the DAMA threshold energy, and DAMA can in principle detect it. The question is whether or not DAMA can in fact identify an increase in count rate with a signal from the Sgr stream.
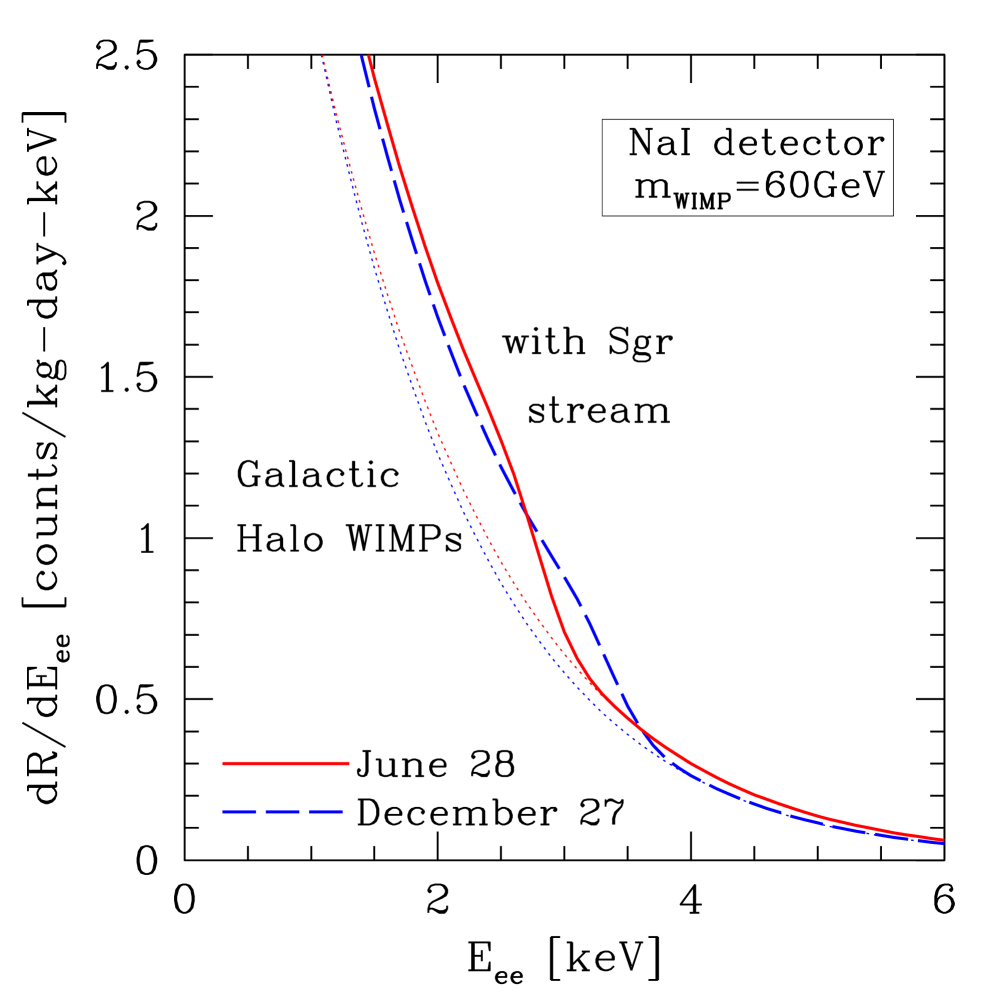
In Figure 1, we have plotted the count rate of 60 GeV WIMPs in a NaI detector such as DAMA as a function of recoil energy. The dotted lines (towards the left) indicate the count rate due to Galactic halo WIMPs alone for an isothermal halo. The solid and dashed lines indicate the count rate including the WIMPs in the Sgr stream for our reference case of km/sec in the direction with a stream velocity dispersion of 20 km/sec. In this plot, we have taken the Sgr stream to contribute an additional 20% to the local Halo density of our Galaxy. As discussed earlier, the best estimate of the contribution varies from 0.3% to 23%. The solid and dashed lines are for June 28 and December 27 respectively, the dates at which the stream annual modulation is maximized and minimized. As noted above, the annual modulation of the value of for this reference case is a 9.2% effect, and peaks at a different date than the standard annual modulation in the Galactic halo (which causes the count rate to peak on June 2).
The DAMA experiment has an enormous exposure of 107731 kg-days. For a 60 GeV WIMP mass and a maximal Sgr stream that is 20% of the local halo density, we compute the following number of events expected in 1 keV bins (2-3 keVee, 3-4 keVee, 4-5 keVee, 5-6 keVee), averaged over a year: (136744, 51814, 20873, and 9367) with the Sgr stream, and (98370, 45745, 20717, and 9214) without the Sgr stream.555For these stream parameters, iodine does not provide a signal from the stream beyond 5 keVee, while sodium gives rise to a long but weak tail of stream events extending up to 21 keVee. This tail, however, contributes less than one event per keVee in 107731 kg-days beyond 11 keVee. The long tail is due to the very different quenching factors of iodine and sodium: 0.09 and 0.3, respectively. The location of the step is roughly at 3 keVee. For a 60 GeV WIMP mass and a stream that is 20% of the local halo, in the 2-3 keVee bin, the difference in number of counts with and without the stream is 38374, which is 104 times the square root of the number of counts with the stream. Hence we find that, in the 2-3 keVee bin, the presence of the stream is detectable at the 104 level. In the 3-4 keVee bin, we find that the stream is detectable at the level. These results have assumed that the density of WIMPs in the Sgr stream is 20% of the local halo. If, as is more reasonable, the density of WIMPs in the stream is instead 4% of the local halo, the stream is detectable at the and level in the 2-3 and 3-4 keVee bins respectively. In more detail, if the stream density is 4% of the local halo, the number of expected events in 1 keV bins from 2 to 6 keVee, averaged over a year with an exposure of 107731 kg-days, is (106045, 46959, 20748, and 9245). The expected count rates for other stream densities can easily be obtained by scaling the stream contribution in the numbers quoted above, for the contribution of the stream scales proportionally with the ratio of stream density to local halo density.
We note that, in the presence of a stream, the date of the maximum count rate changes. For the reference case of km/sec in the direction the count rate due to the WIMPs in the stream alone peaks on June 28 and December 27 at different values of recoil energy. Depending on the contribution of stream WIMPs relative to the local halo WIMPs, the overall count rate may peak between these dates and the usual June 2. For a Sgr WIMP density that is 20% of the local halo, the overall count rate peaks on June 28 and December 27 for different values of the recoil energy. For lower values of the stream density, the date of peak count rate changes and eventually returns to the same value as without a stream. A further investigation of this sensitivity is in progress.
The sapphire (Al2O3) and calcium tungstate (CaWO4) detectors of CRESST [44] have a better energy resolution. Its smaller detector mass requires a longer exposure. The energy threshold is low, keV.
The 73Ge detector of the CDMS experiment [45] has a low energy threshold at 10 keV and a good energy resolution, about 0.5 keV at threshold and about 1.5 keV at 100 keV. As can be seen from Table II and Figure 1, which shows the energy recoil spectrum in 73Ge, the characteristic energy of the reference model varies from 25-120 keV, easily above the energy threshold of the experiment. In addition, the CDMS energy resolution in this range varies between 2% and 4%, so the CDMS experiment has the required energy resolution to be sensitive to the annual modulation of the Sgr stream for most of the range of expected velocities. The EDELWEISS experiment [46], also with a 73Ge detector, has an energy threshold of 20 keV.
CDMS-II at Soudan is expected to have an exposure of 2500 kg-day [47]. Using the same parameters as in Figure 2, in particular a WIMP mass GeV, we find the following number of events in 10 keV bins (10-20 keV, 20-30 keV, 30-40 keV, 40-50 keV, 50-60 keV), averaged over a year: (3083, 2138, 1386, 666, 383) with the Sgr stream and (2473, 1592, 1006, 623, 383) without the Sgr stream. The last bin has the same number of counts with or without the stream because it is well above the characteristic energy of the step (in this case, varies between 35.1 and 42.3 keV). In the first bin, the difference in number of counts with and without the stream is 610, which is 11 times the square root of the number of counts with the stream. Hence we find that, in the first bin, the presence of the stream is detectable at the 11 level. In the second and third bins we find that the stream is detectable at the and level, respectively. This assumed that the density of WIMPs in the Sgr stream is 20% of the local halo density. With 4% density, instead, the stream should be detectable in the same bins at the , , and levels, respectively. With the proposed CryoArray detector, which will have 500000 kg-day of data [47], the Sgr stream should be easy to identify.
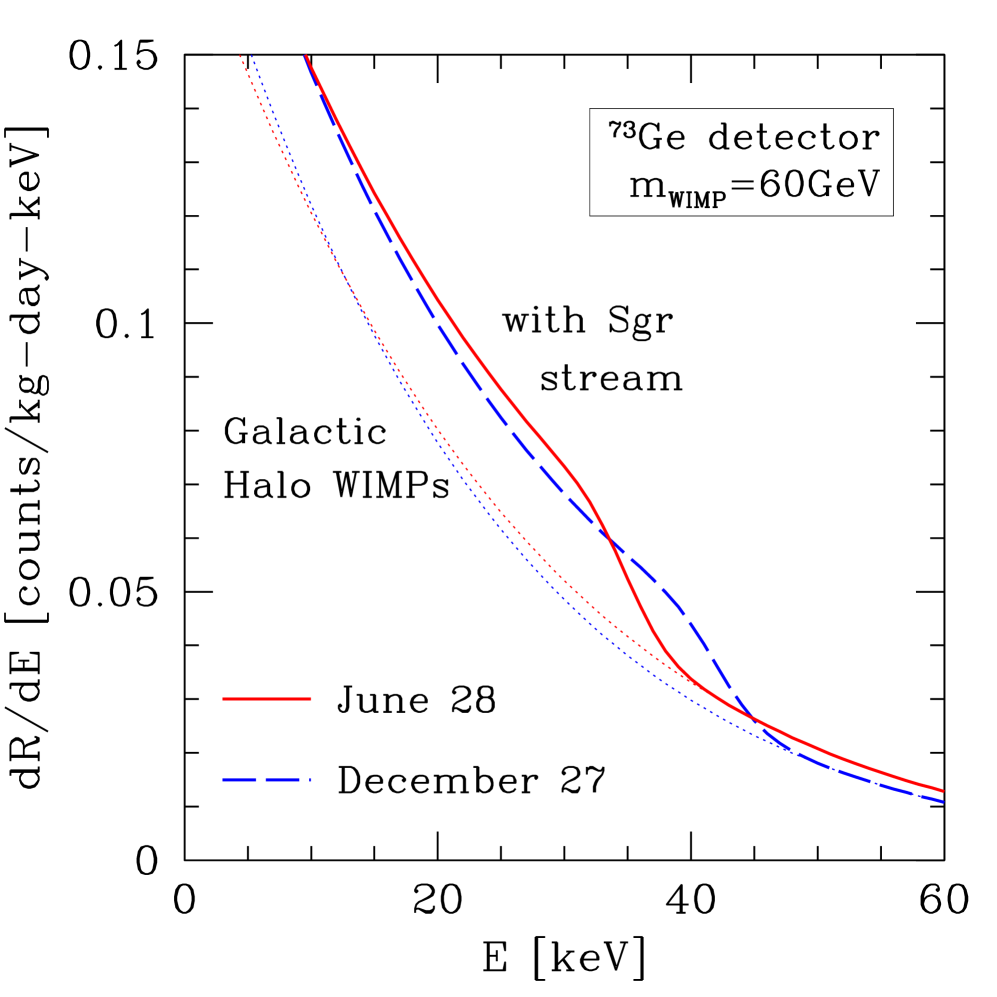
In Figure 2, we have plotted the count rate of 60 GeV WIMPs in a 73Ge detector (such as CDMS or Edelweiss) as a function of recoil energy. The parameters of the curves are the same as in Figure 1. The dotted lines (towards the left) indicate the count rate due to Galactic halo WIMPs alone for an isothermal halo. The solid and dashed lines indicate the count rate including the WIMPs in the Sgr stream for our reference case. The characteristic energy of the step is 35.1 keV in June and 42.3 keV in December.
Upcoming detectors XENON [48] and ZEPLIN-II [49] have low energy thresholds of 2-4 keV. With 1 ton detectors made of liquid xenon planned, these experiments should see enormous count rates and be able to distinguish the Sgr stream.
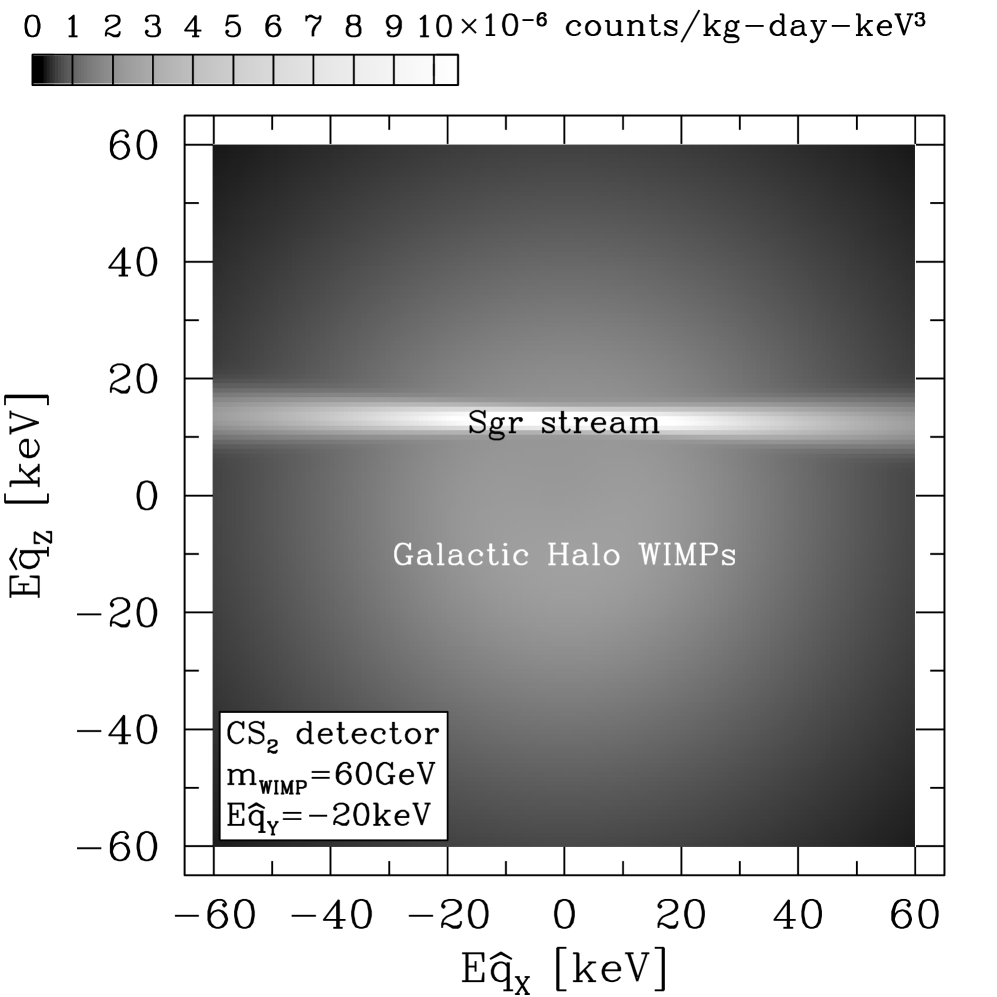

In Figure 3 we illustrate the power of directional detectors. The figure shows the count rate of 60 GeV WIMPs in a CS2 detector (DRIFT) as a function of recoil energy and direction of the nuclear recoil. As above, we have assumed that the Sgr stream impinges on the Galactic plane with a speed of 300 km/s in the direction . We plot the rate at the maximum of the stream modulation on December 27. The figure shows the count rate in a 2-dimensional slice of the 3-dimensional recoil space. The chosen slice is perpendicular to the direction of Galactic rotation and defined by a recoil energy of 20 keV in that direction. The horizontal axis represents recoils in the direction of the Galactic center (left) and Galactic anticenter (right); the vertical axis represents recoils in the direction of the North Galactic Pole (upward) and South Galactic Pole (downward). The gray scale indicates the count rate per kilogram of detector per day and per unit cell in the 3-dimensional energy space. Lighter regions correspond to higher count rates. The white band on the upper part is the location of nuclear recoil due to WIMPs in the Sgr stream. The fuzzy gray cloud at the center contains recoils due to WIMPs in the local isothermal halo. The two WIMP populations can in principle be easily separated, given a sufficient exposure. Figure 4 shows a section of Figure 3 (as defined in the captions) and illustrates that the Sgr stream clearly stands out above the Galactic halo WIMPs.
We can estimate the exposure needed to identify the Sgr stream by considering binning directional data into cells in directional energy space of size 10 keV. The count rate per bin is approximately given by the rate in figures 3 and 4 multiplied by the volume of the cell ( keV3). The count rate for the Sgr stream results in counts/kg-day/cell, and the count rate for the isothermal component is counts/kg-day/cell. Using a argument, we see that the Sgr stream may be distinguished at the 3 level with an exposure of kg-days. For DRIFT, this corresponds to exposing a 30 m3 of CS2 for 5 yr. This is in the upper range of the current plans for DRIFT-2, whose volume is expected to be in the range 10-30 m3.
Therefore DRIFT has the capability of identifying WIMPs in the Sgr stream.
5 Conclusions
Recent observations of the Sagittarius dwarf spheroidal galaxy (Sgr) indicate the existence of tidal streams of stars that pass through the solar neighborhood. If the mass-to-light ratio in the streams is at least comparable to that of the main body of the Sgr galaxy, then one can detect the existence of dark matter in the streams. Under the assumption that the stream passes through the solar position, the dark matter stream plausibly has a density (0.3-23)% of the local density of our Galactic Halo. If dark matter consists of WIMPs, the extra contribution from the stream gives rise to a step-like feature in the energy recoil spectrum in direct dark matter detection, i.e., an increase in the rate in detectors at energy recoils less than some critical value that depends on the target nucleus and on the time of year. The location of the step experiences an annual modulation that will be useful in identifying the existence of the stream. The count rate in the detector is also modulated annually, with a maximum on June 28 and minimum on December 27 except near the characteristic energy where the phase is opposite.
In the CDMS experiment, for our best estimate of stream velocity (300 km/sec) and direction [], the location of the step oscillates yearly between 25 and 35 keV, with a phase opposite to that of the count rate. With two kg of Germanium, the stream should be detectable at three ’s in four years of data with 10 keV energy bins. Planned large detectors like XENON, CryoArray and the directional detector DRIFT may be able to identify the Sgr stream.
K. F. acknowledges support from the DOE via a grant in the Physics Dept. at the Univ. of Michigan. K.F. and P.G. thank the Michigan Center for Theoretical Physics for support. H. N. acknowledges support from Research Corporation and the National Science Foundation (AST-0307571).
References
- [1] H. J. Newberg, B. Yanny, E. K. Grebel, G. Hennessy, Z. Ivezic, D. Martinez-Delgado, M. Odenkirchen, H.-W. Rix, J. Brinkmann, D. Q. Lamb, D. P. Schneider, and D. York, Ap. J. Lett., 596, L191.
- [2] S. Majewski, M. F. Skrutskie, M.D. Weinberg, and J.C. Ostheimer, astro-ph/0304198.
- [3] R. A. Ibata, G. Gilmore, & M. J. Irwin, MNRAS, 277, 781 (1995).
- [4] A.K. Drukier, K. Freese, and D.N. Spergel, Phys. Rev. D33, 3495 (1986).
- [5] K. Freese, J. Frieman, and A. Gould, Phys. Rev. D37, 3388 (1988).
- [6] F. Hasenbalg, Astropart. Phys. 9, 339 (1998).
- [7] J. Primack, D. Seckel, and B. Sadoulet, Ann. Rev. of Part. and Nucl. Science, 38 751 (1988).
- [8] Lewin and P. Smith, Astropart. Phys. 6 87 (1996).
- [9] M. Lewis and K. Freese, astro-ph/0307190.
- [10] S.W. Barwick et al (HEAT Collaboration), Phys.Rev.Lett. 75, 390-393 (1995); Ap. J. 482, L191 (1997)
- [11] S. Coutu et al. (HEAT Collaboration), in Proceedings of 27th ICRC (2001).
- [12] E.A. Baltz & J. Edsjö, Phys. Rev. D59, 023511 (1999).
- [13] E. A. Baltz, J. Edsjö, K. Freese, & P. Gondolo, Phys.Rev. D65, 063511 (2002).
- [14] G.L. Kane, L.T. Wang & J.D. Wells, Phys.Rev. D65, 057701 (2002).
- [15] G.L. Kane, L.-T. Wang & T.T. Wang, Phys.Lett. B536, 263-269 (2002).
- [16] R. A. Ibata, R. F. G. Wyse, G. Gilmore, M. J. Irwin,& N. B. Suntzeff, A. J., 113, 634 (1997).
- [17] R.M. Cutri et al., VizieR On-line Data Catalog: II/246, http://www.ipac.caltech.edu/2mass/releases/allsky/doc/explsup.html (2003)
- [18] H. J. Newberg et al., in Satellites and Tidal Streams, ed. F. Prada, D. Delgado-Martinez & T. J. Mahoney (San Francisco: ASP), ASP Conf. Ser., in press (2004)
- [19] I.-G. Jiang, J. Binney, MNRAS, 314, 468 (2000).
- [20] H. J. Newberg et al., Ap. J., 569, 245 (2002).
- [21] K. V. Johnston, S. R. Majewski, M. H. Siegel, I. N. Reid, W. E. Kunkel, A. J., 118, 1719 (1999).
- [22] G. Marconi, R. Buonanno, M. Castellani, G. Iannicola, P. Molaro, L. Pasquini, & L. Pulone, A & A, 330, 453 (1998).
- [23] M. Mateo, A. Udalski, M. Szymanski, J. Kaluzny, M. Kubiak, W. Krzeminski, A. J., 109, 588 (1995).
- [24] M. Mateo, E. W. Olszewski, H. L. Morrison, Ap. J., 508, L55 (1998).
- [25] M. Mateo, N. Mirabal, A. Udalski, M. Szymanski, J. Kaluzny, M. Kubiak, W. Krzeminski, K. Z. Stanek, Ap. J. Lett., 458, L13 (1996).
- [26] N. Padmanabhan et al., New Astronomy, 9(5), 329 (2004).
- [27] D. Stiff, L.M. Widrow, and J. Frieman, Phys. Rev. D64, 083516 (2001).
- [28] M. W. Goodman and E. Witten, Phys. Rev. D 31, 3095 (1985).
- [29] P. Gondolo, in “Dark Matter and Cosmology, Quantum Measurement, and Experimental Gravitation,” p. 41 (Les Arcs, 1996); hep-ph/9605290.
- [30] G. Gelmini and P. Gondolo, Phys. Rev. D 64, 023504 (2001).
- [31] R. H. Helm, Phys. Rev. 104, 1466 (1956).
- [32] J. Engel, S. Pittel, and P. Vogel, Int. J. Mod. Phys. E1, 1 (1992).
- [33] M.T. Ressell et al., Phys. Rev. D48, 5519 (1993).
- [34] G. Jungman, M. Kamionkowski, and K. Griest, Phys. Rep. 267, 195 (1996).
- [35] J. Lewin and P. Smith, Astropart. Phys. 6 87-112 (1996).
- [36] A. M. Green, astro-ph/0304446.
- [37] F. Mignard, A&A 354, 522 (2000); R.P. Olling and M.R. Merrifield, MNRAS 297, 943 (1998); M. Feast, F. Pont, and P. Whitelock, MNRAS 298, L43 (1998); A. Ali and M.A. Sharaf, New Astronomy 3, 419 (1998); W. Dehnen and J.J. Binney, MNRAS 298, 387 (1998); M. Feast and P. Whitelock, MNRAS 291, 683 (1997); D.W. Evans and M. Irwin, MNRAS 277, 820 (1995); F. Comerón, J. Torra, and A.E. Gómez, A&A 286, 789 (1994).
- [38] B. Yanny et al., Ap. J., 588, 824 (2003).
- [39] S. R. Majewski et al., A. J., 118, 1709 (1999).
- [40] R. C. Dohm-Palmer et al., Ap. J. 555, L37 (2001).
- [41] C. J. Martoff et al., Phys. Rev. Lett. 76, 4882 (1996); D. P. Snowden-Ifft, C.J. Martoff, J. M. Burwell, Phys. Rev. D61, 101301 (2000); D. P. Snowden-Ifft et al., Nucl. Instr. and Meth. in Phys. Res. A 498, 155 (2003).
- [42] P. Gondolo, Phys. Rev. D 66, 103513 (2002).
- [43] R. Bernabei et al., Phys. Lett. B 389, 757 (1996); ibid. 424, 439 (1998); ibid. 450, 448 (1999); 480, 23 (2000); P. Belli et al., Phys. Rev. D61 (2000) 023512; R. Bernabei et al., Riv. N. Cim. 26 (2003) 1.
- [44] M. Bravin et al., Astropart. Phys. 12, 107 (1999); G. Angloher et al., Astropart. Phys. 18, 43 (2002); C. Bucci et al., MPI-PhE/2001-02.
- [45] D. Abrams et al., Phys. Rev. D66, 122003 (2002).
- [46] A. Benoit et al., Phys. Lett. B545, 43 (2002).
- [47] R. W. Schnee, D. S. Akerib and R. J. Gaitskell, astro-ph/0208326.
- [48] E. Aprile et al., astro-ph/0207670.
- [49] D. Cline et al., Nucl. Phys. Proc. Suppl. 87, 114 (2000); N. J. T. Smith et al., talk at “Identification of Dark Matter 2002” (York, England); H. Wang et al., talk at “Identification of Dark Matter 2002” (York, England).