THE NIRSPEC BROWN DWARF SPECTROSCOPIC SURVEY I. LOW RESOLUTION NEAR-INFRARED SPECTRA
Abstract
We present the first results of a near-infrared (0.96 - 2.31 µm) spectroscopic survey of M, L, and T dwarfs obtained with NIRSPEC on the Keck II telescope. Our new survey has a resolving power of R and is comprised of two major data sets: 53 -band (1.14 - 1.36 µm) spectra covering all spectral types from M6 to T8 with at least two members in each spectral subclass (wherever possible), and 25 flux-calibrated spectra from 1.14 to 2.31 m for most spectral classes between M6 and T8. Sixteen of these 25 objects have additional spectral coverage from 0.96-1.14 m to provide overlap with optical spectra. Spectral flux ratio indexes for prominent molecular bands are derived and equivalent widths (EWs) for several atomic lines are measured. We find that a combination of four H2O and two CH4 band strengths can be used for spectral classification of all these sources in the near-infrared, and that the H2O indexes are almost linear with spectral type from M6 to T8. The H2O indexes near 1.79 m and 1.96 m should remain useful beyond T8. In the near-infrared a notable feature at the boundary between the M and L types is the disappearance of relatively weak (EW 1-2Å) atomic lines of Al I and Ca I, followed by Fe I around L2. At the boundary between L and T dwarfs it is the appearance of CH4 in all near-infrared bands (, and ) that provides a significant spectral change, although we find evidence of CH4 as early as L7 in the -band. The FeH strength and the equivalent width of the K I lines are not monotonic, but in combination with other factors provide useful constraints on spectral type. The K I lines are sensitive to surface gravity. The CO band strength near 2.30 m is relatively insensitive to spectral class. The peak calibrated flux () in the 0.96 - 2.31 m region occurs near 1.10 m at M6 but shifts to about 1.27 m at T8. In addition, the relative peak flux in the , and bands is always in the sense except around L6, where the differences are small. One object, 2MASS2244+20 (L6.5) shows normal spectral behavior in the optical, but has an infrared spectrum in which the peak flux in band is less than at and .
1 INTRODUCTION
One of the most remarkable developments in the study of stars in recent years has been the extension of the spectral classification sequence to low-mass objects cooler than spectral type M. The defining characteristic of spectral class M is an optical spectrum dominated by bands of TiO and VO, but the discovery of a cool companion to the white dwarf GD 165 (Becklin and Zuckerman 1988) showing none of the hallmark TiO features of M dwarfs (Kirkpatrick et al. 1993) signaled a major change. The subsequent identification of field counterparts to GD 165B ultimately led to the definition of a new spectral class, the L dwarfs (Kirkpatrick et al. 1999, hereafter K99; Mart n et al. 1999), defined in the red optical to have weakening metal-oxide bands (TiO, VO) but strong metal hydride bands (FeH, CrH, MgH, CaH)and alkali lines (Na I, K I, Cs I, Rb I). To date, nearly 250 L dwarfs have been identified111A current list is maintained by J. D. Kirkpatrick at http://spider.ipac.caltech.edu/staff/davy/ARCHIVE, most by wide-field surveys: the Two Micron All Sky Survey (Skrutskie et al. 1997; hereafter 2MASS), the Deep Near Infrared Survey of the Southern Sky (Epchtein et al. 1997; hereafter DENIS), and the Sloan Digital Sky Survey (York et al. 2000; hereafter SDSS).
As GD 165B is the prototype of the L dwarfs, Gl 229B (Nakajima et al. 1995) is the prototype of a second new spectral class, the T dwarfs. Whereas near-infrared (NIR) spectra of L dwarfs show strong bands of H2O and CO, the NIR spectrum of Gl 229B is dominated by absorption bands from CH4 (Oppenheimer et al. 1995), features that until recently were only found in the giant planets of the solar system and Titan. CH4, H2O, and H2 collision-induced absorption (CIA; Saumon et al. 1994) give Gl 229B blue near-infrared colors, - (Leggett et al. 1999). Its steeply sloped red optical spectrum also lacks the FeH and CrH bands that characterize L dwarfs (Oppenheimer et al. 1998) and instead is influenced by exceptionally broad absorption features from the alkali metals Na and K (Burrows, Marley & Sharp 2000; Liebert et al. 2000). These differences led K99 to propose the T spectral class for objects exhibiting - and -band CH4 absorption. Over 30 T dwarfs are now known. NIR classification schemes for T dwarfs have recently been developed by Burgasser et al. (2002b; hereafter B02) and Geballe et al. (2002; hereafter G02). Theory suggests that L dwarfs are a mixture of very low-mass stars and sub-stellar objects (brown dwarfs), whereas the T dwarf class is composed entirely of brown dwarfs, i.e., objects with mass below that required for stable hydrogen burning, 0.072 M⊙ for solar metallicity (Burrows et al. 2001; Allard et al. 2001).
The majority of flux (, in units of Wm-2m -1) emitted by L and T dwarfs is in the 1-2.5 NIR range, where as a result both high signal-to-noise and high resolution studies of these intrinsically faint objects are possible. The decreasing temperatures of late M, L, and T dwarfs results in a rich near-infrared spectrum containing a wide variety of features, from relatively narrow lines of neutral atomic species to broad molecular bands, all of which have different dependencies on temperature, gravity, and metallicity. Furthermore, these low temperature conditions favor condensation out of the gas state and the formation of grains (e.g., Lodders et al. 2002).
Investigations of the NIR spectral properties of M, L, and T dwarfs have been reported previously by Jones et al. (1994), Leggett et al. (2000, 2001), Reid et al. (2001), Testi et al. (2001), B02, and G02. Most of these observations have been carried out at low to moderate spectral resolution (R ) and over a wide range of signal-to-noise. Whereas low resolutions are appropriate for general spectral classification, higher resolution is advantageous for detailed spectral analysis. With the advent of new infrared detector technology, we undertook a more uniform study of the spectra of low-mass stars and brown dwarfs, called the Brown Dwarf Spectroscopic Survey (BDSS). The BDSS was initiated following the successful first light commissioning of the Keck-II Near-Infrared Spectrometer (NIRSPEC; McLean et al. 1998, 2000a) in 1999 April. The goals of the BDSS are: (1) to obtain a uniform set of moderate resolution (R 2000) NIR spectra for a large sample of very low-mass stars and brown dwarfs to examine general spectral properties and facilitate comparisons with theoretical spectral energy distributions; (2) to obtain a set of high resolution spectra (R 20,000) for detailed comparison of individual spectral features with model atmospheres; and (3) to monitor selected sources for Doppler shifts induced by unresolved binary companions. Early products from the BDSS have been presented in McLean et al. (2000b, 2001, 2003a).
This first paper in a series of BDSS results describes the extensive observations for the initial goal and presents (a) low resolution -band spectra of 53 objects, including sixteen spectral standards defined by K99 and B02, and (b) flux-calibrated 1.15-2.31 spectra of 25 objects, spanning the full range of published spectral types from M6 to T8. Sixteen objects in the latter set have additional coverage from 0.96-1.15 m to provide overlap with optical spectra. In subsequent papers relating to the BDSS we will report on a comparison between observations and model atmospheres, describe a similar grid of spectra developed for gravity-sensitive indicators, and present high-resolution infrared echelle spectroscopy of brown dwarfs (McLean et al. 2003b; in prep.). In 2 we describe our observations and data reduction procedures, carried out primarily using the REDSPEC data reduction package222For REDSPEC documentation and software, see http://www2.keck.hawaii.edu/inst/nirspec/redspec/. In 3 we show the results in detail, analyzing the various features present in the spectra and their evolution with spectral type. Spectral ratios useful for classification of late-type dwarfs in the NIR are presented in 4, and compared to other classification schemes currently defined. A discussion appears in 5. Conclusions are summarized in 6.
2 OBSERVATIONS
2.1 The NIRSPEC Instrument
All of the observations reported here were obtained with NIRSPEC, a cross-dispersed, cryogenic, echelle spectrometer for the wavelength region from 0.95-5.5 µm. Details of the design and performance of NIRSPEC are given elsewhere (McLean et al. 1998, 2000a). A low-resolution setup of R 2000 for the same slit width of 0.4 (only 2 pixels in this mode) is available without the echelle grating. This is the mode we have employed for the data presented here. Dispersion along the detector is approximately 2.5 Å/pixel at 1 µm. NIRSPEC has 3 detectors: a sensitive CCD camera for acquisition and offset guiding, a slit-viewing camera with a 256 256 HgCdTe array sensitive from 1-2.5 m , and the primary 1024 1024 InSb array for the spectrograph. The InSb array has a high quantum efficiency %) across the 1-5 m region with a dark current of 0.2 s-1 pixel-1 at 30 K and a noise of 15 rms with multiple non-destructive readouts. Typical sensitivity values under good seeing conditions in low-resolution mode yield signal-to-noise ratios of 25 per resolution element at in 20 minutes. NIRSPEC remains stationary on kinematic mounts on the Nasmyth platform of the Keck II telescope and operates at the f/15 focus with the tertiary mirror in place. The optical properties of the high-transmission Three-Mirror-Anastigmat (TMA) camera in NIRSPEC necessitates certain rectification requirements during data reduction.
For low-resolution spectral observations, seven custom-designed order-sorting filters, referred to as NIRSPEC-1 through NIRSPEC-7, give overlapping wavelength coverage from 0.95 - 2.6 µm. Table 1 lists the six instrumental configurations we have used. The filter, the grating angle in the low resolution mode, the wavelength coverage, and the corresponding photometric band are listed. The NIRSPEC-1 filter covers the optical and near-infrared -bands (e.g., Gunn-, UFTI ), as well as the Y-band (Hillenbrand et al. 2002). NIRSPEC-2 bridges the and -bands; the NIRSPEC-3 filter covers the -band. NIRSPEC-4 spans the short wavelength half of the -band. NIRSPEC-6 is a broad + filter centered at 1.925 m with a bandwidth of 0.75 µm. Since the entire NIRSPEC-6 bandwidth cannot be simultaneously observed on the detector, two configurations, N6a and N6b, are used to obtain the long wavelength half of the -band and the -band, respectively. NIRSPEC-5 (essentially -band) and NIRSPEC-7, which cover 1.431 - 1.808 m and 1.839 - 2.630 µm, respectively, were used only for one NIRSPEC-5 observation of the T8 dwarf 2MASSW J0415-09, and NIRSPEC-7 observations of the L5 dwarf 2MASS W J1507-16 and the L8 dwarf 2MASSW J1523+30. While NIRSPEC-7 extends wavelength coverage well beyond the 2.295 m CO band, its use was deemed too costly in observing time (because of high backgrounds and poor signal-to-noise) to include in the survey.
2.2 Observing Strategy
Table 2 lists the sample of low mass stars and brown dwarfs included in our survey. Coordinates (J2000), 2MASS photometry, published spectral types and the date of the observation are included for reference. For convenience, the full 2MASS names are truncated but no confusion arises because there are no duplicates and the full J2000 coordinates (which define the name) are given. The apparent magnitudes of the sources are in the range 7 16.8. Targets were selected from well known M dwarfs and from L and T dwarfs identified in 2MASS (Kirkpatrick et al. 1997, K99, 2000, 2001; Burgasser et al. 1999, 2000a, 2000b, B02; Reid et al. 2000; Wilson et al. 2001; Dahn et al. 2002; C.G. Tinney & J.D. Kirkpatrick 2003, private communication), augmented with discoveries from DENIS (Delfosse et al. 1997), SDSS (Strauss et al. 1999; Leggett et al. 2000; G02), and other investigations (Becklin & Zuckerman 1988; Ruiz, Leggett, & Allard 1997). Our primary goal was to obtain a complete sample of -band spectra from M6 - T8 with at least two representatives in every spectral class if possible, followed by spectra over the full 0.96-2.315 m range for all even-numbered spectral subclasses.
For most of these objects the same observing strategy was employed. A 300s exposure was obtained with the source at each of two positions (called nod positions) separated by 20″ along the 038 wide slit. Most objects were observed in an ABBA pattern giving a total integration time of 20 minutes per grating/filter configuration. Six settings (2 hr) were required to obtain a complete spectrum from 0.960-2.315 µm that was continuous through the NIR atmospheric absorption bands. Shorter exposures were used for the brightest sources to avoid detector non-linearity or saturation. Total integration times were doubled (40 minutes per grating setting) to maintain a signal-to-noise ratio of at least 20:1 per resolution element over most of the filter band in the faintest sources (16). Sources with 14 have a signal-to-noise ratio over 100:1 in 20 minutes. Prior to early 2000, we used longer on-chip exposure times of 600s for some objects, but discontinued this practice when some OH night-sky lines were found to be saturating (especially in the band) and not subtracting out properly in the data reduction process (see McLean et al. 2001). Seeing was generally good on most nights (0.5′′), with only a few nights worse than 0.7′′-0.9′′. The same slit width was maintained throughout.
To account for absorption by the Earth’s atmosphere, calibration stars of spectral type B9V-A3V were observed before or after the target observations and as close to the same airmass and time as possible, typically within 0.1 airmasses but in a few cases as high as 0.3. Early A type stars are essentially featureless in except for hydrogen absorption lines, which can be successfully interpolated out during the data reduction process. The and bands each contain one line, Pa at 1.282 µm and Br at 2.166 µm. The band contains Brackett lines at 1.737, 1.681, 1.641, 1.611, 1.588, 1.571, 1.556, 1.544 and 1.534 µm. Both neon and argon arc lamp spectra were obtained either immediately before or after the target observation for wavelength calibration, together with the spectrum of a flat-field lamp and a dark frame.
2.3 Data Reduction
Reduction of the spectra was accomplished using REDSPEC, software designed and developed primarily for NIRSPEC data reduction. At each step in the procedure graphical displays allow inspection of the process by the user. As a result of the high-throughput optical design ( 2.1), NIRSPEC spectra are non-linear in the spatial and spectral dimensions. REDSPEC rectifies the data, checks for saturation and performs standard reduction techniques. The code first maps the spatial distortion by fitting a polynomial to the location of the data across the two-dimensional array. A spectral map is then created by fitting a polynomial to observed neon and argon arc lamp lines with known wavelengths333Wavelengths of arc lamp lines may be found in the NIST database, http://physics.nist.gov/, producing a dispersion solution for every row of (spatially rectified) data.
After rectification, the pairs of nodded target frames are subtracted to remove background and then divided by the rectified flat field. Image frames are cleaned by replacing bad pixels by interpolating over their neighbors. Comparison of the target spectrum with the OH night-sky spectrum is used to reveal any artifacts caused by incomplete subtraction and saturated OH lines. Both target and calibrator spectra are extracted by summing 10 adjacent rows of data. After interpolation across intrinsic stellar features, the calibration star spectra are divided into the corresponding target spectra to remove telluric absorption features and instrument spectral response. The resulting spectra are subsequently multiplied by a blackbody curve, equivalent in temperature to that of the calibration star (Tokunaga 2000), to restore spectral slope and permit the calculation of accurate fluxes. At this stage the spectra extracted from the two nod positions are averaged, and the action of changing the sign of the negative spectrum and adding to the positive spectrum eliminates any remaining sky offset.
The spectra were flux calibrated (in units)using 2MASS photometry, following the prescription of McLean et al. (2001). Briefly, we compared the band-averaged flux densities for each target with those of Vega and derived a calibration factor by matching to the known magnitude in that band. Code was developed to bootstrap the overlapping spectral pieces into a continuous spectrum while minimizing photometric errors. Comparison of the bootstrapping method with direct flux calibration in individual wavebands yields photometric errors consistent with 2MASS magnitude uncertainties. Our values are based on data from Bergeron, Wesamael, & Beauchamp (1995), kindly provided by D. Saumon, and the 2MASS filter set. We also compared these values to fluxes from Cohen et al. (1992), which are based on the UKIRT filter set and the atmospheric absorption at Kitt Peak (Cox 2000). A 5% difference was found in the -band, but only 1-2% difference in the and bands.
3 RESULTS: MORPHOLOGY OF THE SPECTRA
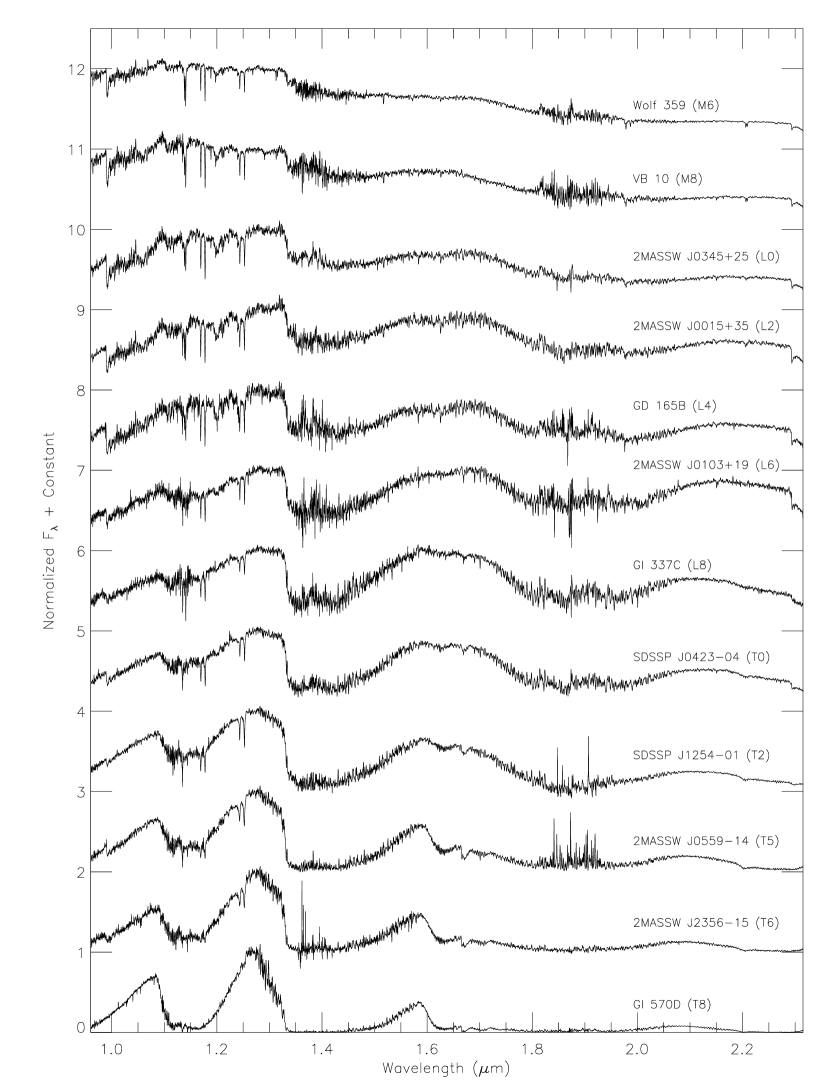
Figures 1 and 2 present 39 -band spectra ordered with respect to their optical (L dwarfs) or infrared (T dwarfs) classifications given by K99 and B02 respectively. We will discuss in 4 whether or not this order is consistent with a pure infrared classification scheme. Objects range from the M6 dwarf Wolf 359 to the T8 dwarf 2MASS 0415-09, the coolest brown dwarf yet discovered (B02; F. Vrba et al. 2003, private communication). There are no L9 objects in the K99 classification scheme and a T4 object is missing from the sequence as no such object has yet been identified. There are two objects of each published spectral type wherever possible. These 39 spectra are a subset of the 53 spectra that are included in the initial phase of the NIRSPEC survey. The remaining 14 objects are either non-integer spectral class designations, redundant with the included spectral classes, or peculiar and will be presented in 3.5. Figure 3 shows a sequence of 12 complete flux-calibrated spectra ( vs. ) for every even-numbered spectral type from M6 to T8, with a T5 spectrum substituted for the missing T4. Spectral coverage is continuous from 0.96 - 2.315 µm. Noisy regions at 1.11-1.14 m , 1.35-1.45 m and 1.82-1.95 m correspond to terrestrial atmospheric absorption bands that separate and limit the bands. These flux-calibrated spectra have been normalized to the -band at 1.27 m for plotting. For reference, Table 3 gives the normalization fluxes (Fλ) at 1.27 m.
Figures 1-3 show a rich variety of atomic and molecular spectral features that clearly evolve with spectral type. Essentially all of the fine spectral structure is real and repeatable, except in regions of very poor atmospheric transmission. Before quantitatively analyzing the entire data set, it is useful to review the trends and features qualitatively. To illustrate the intrinsic spectral resolution of the NIRSPEC BDSS, Figures 4-7 provide close-up plots of five representative objects in the and spectral bands: Wolf 359 (M6), 2MASS 0015+35 (L2), Gl337C (L8), SDSS 1254-01 (T2), and Gl570D (T8). Below, we describe the spectral morphology in each band.
3.1 -band
Figure 4 contains the -band spectra of our five representative objects. The most prominent feature of this region is the well-known Wing-Ford band (Wing & Ford 1969) of FeH. The band head at 0.9896 µm comes from the 0-0 () transition of the F–X system. This feature strengthens from M6 through the early L dwarfs and then fades through the late L dwarfs and early T dwarfs (see also Figure 2), but then strengthens again from T4-T6 before vanishing at T8. The 0.9896 m band head is accompanied by many other transitions of FeH as demonstrated by Cushing et al. (2003). Those authors identified 33 absorption features redward of this band head (from 0.9975-1.0849 m ) as FeH bands. Each of these features is clearly seen in the spectra of our early L dwarfs, including the weaker of two Q-branches at 0.9979 µm. The feature at 0.9969 m has generally been attributed to the 0-1 A6 - X6 band head of CrH (K99), although Cushing et al. (2003) have cast doubt on this identification, attributing absorption in this region entirely to FeH. Recent opacity calculations for CrH (Burrows et al. 2002) and FeH (Dulick et al. 2003) confirm the presence of the CrH band, but its observability depends strongly on the relative abundance of FeH/CrH in these cool atmospheres, which is currently unknown. The broad shallow feature at 1.0666 m is unidentified, but behaves in the same way with spectral type as the FeH and CrH features. In the L sequence the continuum begins to slope downwards towards the blue end of this band and the H2O feature near 1.11 m strengthens. This trend continues into the T dwarfs, until, by T8, the spectrum is relatively smooth and strongly peaked near 1.08 µm.
3.2 -band
Figure 5 is a plot of the extended -band region where we have combined data from the N2 and N3 filters. In the spectrum of the M6 dwarf there is a strong neutral sodium (Na I) doublet (1.138 and 1.141 µm) and a weaker Na I line at 1.268 m . There are also two pairs of neutral potassium (K I) doublets (1.168,1.177 m and 1.243,1.254 µm), a doublet of Al I (1.311, 1.314 µm), two prominent Fe I lines (1.189 and 1.197 µm), and three weaker Fe I lines at 1.1596, 1.1610 and 1.1641 µm. Very weak features from Ti I and Mn I at 1.283 and 1.290 m respectively, and two sets of Ca I triplets are not convincingly detected after M6. The prominent metal lines weaken and disappear near the M/L boundary (McLean et al. 2000b). The sodium and potassium doublets persist through most of the L sequence, after which the Na doublet weakens markedly. The K I doublets, especially the long wavelength pair of lines, can be traced until T7, but are exceedingly shallow or absent at T8. The K I lines also become consistently broader with later spectral type. Absorption by H2O occurs at both ends of this spectral region.
The narrow absorption feature at 1.135 m is from H2O, and weaker features, most notable in the L dwarfs, spread redward to 1.195 µm. A strong H2O band occurs longward of 1.33 µm. In late-type M stars this H2O band can depress the flux at 1.34 m by 10-20% from the apparent continuum level. Lying between the two K I doublets are FeH bands in the range of 1.19–1.24 µm. Cushing et al. (2003) identify the prominent features at 1.1939 and 1.2389 m as the band heads of the 0-1 and 1-2 bands of the F– X system. These FeH features strengthen in the L dwarfs until about L5, after which they decay and are absent in the T dwarfs. The H2O absorption band longward of 1.33 µm increases in strength through the L dwarf sequence, diminishing the continuum by 30-40%.
In the late L dwarfs (e.g., Gl337C), the flux between 1.28 and 1.32 m begins to slope slightly downward as a result of increasing CH4 absorption. This absorption becomes a clear feature in the T dwarfs as the band strengthens. Blueward of 1.19 m , H2O and CH4 absorption bands cause a decrease in flux which continues throughout the T dwarf sequence.
3.3 -band
Figure 6 shows the 1.36-1.93 m -band region. Again, two NIRSPEC settings are combined here to extend the region beyond the standard -band, which explains the dense appearance of the spectra. Telluric H2O absorption, even from a high-altitude site like Mauna Kea, contaminates the wavelength regions from 1.34-1.41 µm and 1.80-1.96 µm, causing some spectra to exhibit spurious features. Most of the -band spectra are dominated by very broad H2O absorption intrinsic to the sources around 1.4 and 1.8 µm. These H2O bands strengthen significantly from the M dwarfs to the T dwarfs; by spectral type T8, water vapor absorption has removed most of the flux in the range 1.45-1.50 µm.
One feature which is clearly present in the late M and early L dwarfs is the blended K I doublet line at 1.517 µm. This feature can be seen in 2MASS 0015+35 (L2) but is no longer present in the L8 object, Gl 337C. Cushing et al. (2003) have identified 34 features in this spectral region belonging to the 0-0 band of the E-A system in FeH. Band heads are present at 1.5826, 1.5912 and 1.6246 µm, labelled in the figure. FeH weakens through the L dwarf sequence. The onset of the 2 band of CH4 at 1.67 µm can be seen in the L8 Gl337C, but is much clearer in the T2 dwarf. This feature strengthens dramatically through the T dwarf sequence in addition to the band at 1.63 µm, clearly distinguishing these objects.
3.4 -band
Figure 7 shows the enlarged -band spectral region for the same five objects. Atomic features of Ca I (1.98 µm triplet) and Na I (2.206,2.209 µm) are present in the M dwarfs but disappear in the early L dwarfs. The CO (v=2-0) band head at 2.295 m is also present in the M dwarfs, increases slightly in strength in the early L dwarfs, but weakens again in later types. H2O absorption around 1.8 -2.0 m is weak in the M dwarfs but appears in the early L dwarfs and gets stronger through the L and T dwarf sequence. An additional source of continuum opacity in this region is collision induced absorption (CIA) by H2 molecules (Saumon et al. 1994) which has no distinct bandhead but suppresses flux throughout the -band. Absorption from the band of CH4 at 2.2 m appears in the latest L dwarfs (McLean et al. 2001, Nakajima et al. 2001, G02), and like its - and -band counterparts, strengthens in the T dwarfs. CO is still detectable in the T2 dwarf, SDSS 1254-01, but does not appear in the late T dwarfs.
3.5 Additional Spectra
Figures 8 and 9 show the remaining -band spectra in the survey. Several of these objects have redundant spectral types or are objects which have been assigned half-class designations. For one spectral type, L1, we have six objects. These are compared in Figure 9 and appear to show good agreement.
Figure 10 shows an additional group of 12 objects for which flux-calibrated spectra have been obtained from 1.15 - 2.315 m . With the exception of four objects, the region from 0.96-1.15 m linking the infrared spectrum to the far-red optical is missing. In addition, the T8 2MASS 0415-09 does not have continuous coverage through the atmospheric absorption bands. Some of these sources are faint and the spectra are noisier in the terrestrial atmospheric bands.
4 ANALYSIS
Molecular absorption bands constitute the most prominent features in the near-infrared spectra of M, L and T dwarfs. Indeed, most of the NIR classification studies to date are based largely on the strengths of the H2O and CH4 features. In this section we examine and quantify the evolution of these strong, broad features as well as other molecular and atomic features.
4.1 Spectral Flux Ratios for Molecular Bands
Following earlier work on infrared spectral indexes by Jones et al. 1994; Tokunaga & Kobayashi 1999; Reid et al. 2001; McLean et al. 2000b; Testi et al. 2001; B02; G02, we define a set of flux ratios for NIRSPEC spectra in the primary H2O, CH4, FeH, and CO bands.
Table 4 lists the flux ratios used and provides their definitions. Nine ratios have been created to measure the most prominent molecular features in the bands; four H2O bands (1.343 µm, 1.456 µm, 1.788 µm, 1.964 µm) labelled A, B, C and D respectively, two CH4 bands (1.730 µm, 2.2 µm) labelled CH4A and CH4B respectively, two FeH bands (0.988 µm, 1.200 µm) designated -FeH and -FeH, and the primary CO band (2.295 µm). Each ratio is formed by determining the median in a 0.004 µm (40 Å) wide interval at the wavelength of the feature and dividing this by the median continuum level over the same interval; the greater the absorption, the smaller the ratio. Because the equivalent resolving power per pixel corresponding to our 40 Åbandwidth ranges from R = 250-570 (depending on wavelength), our ratios could also be relevant for lower resolution spectroscopy, although with fewer pixels per band. Many possible center wavelengths, continuum wavelengths and bandwidths were analyzed for each ratio before making a choice that maximized sensitivity to both the given spectral feature and the linear response.
These ratios, which serve to quantify the NIRSPEC BDSS data set, can be compared to prior spectral classifications, especially optical types, to investigate if the same underlying physics is controlling both the optical and NIR spectral signatures. Table 5 lists the values of these nine flux ratios for the objects in the survey. Figures 11 - 13 contain plots of these values as a function of published optical spectral subclass for L dwarfs or previous NIR class for T dwarfs. Filled symbols in these plots identify published spectral type standards from K99, B02 and G02. Some ratios are well-defined only for certain spectral classes. For example, the four H2O ratios are defined for all subclasses from late M to late T since H2O absorption plays a significant role in the spectral energy distribution of all these objects. The CH4 ratios, however, are defined only for T dwarfs, as CH4 absorption is absent in the M and early L dwarfs, although the onset of CH4 can be deduced from the values of these ratios for the late L dwarfs. The FeH ratios are only well-defined for M and L dwarfs, although the 0.988 µm band can be seen in some of the T dwarfs. Finally, the CO ratio is useful only for objects in the range M6 to T3 where the CO band head is clearly identifiable.
Examination of Figures 11-13 reveals that, in several cases, the behavior of the selected flux ratios is monotonic with prior spectral type assignments and approximately linear. Where possible, the best linear fit to the indexes is shown together with a 1 error bar derived from the residuals to the line fit. Table 6 lists the straight line fit parameters (slope and intercept), as well as the correlation coefficient () for the least-squares solution and the standard deviation of the scatter in spectral type. We adopt the convention that M0 = 0, L0 = 10 and T0 = 20.
Comparing H2O ratios, it appears that the H2OA index, although monotonic, is not well fit by the same line in the T dwarfs because of contamination by CH4 at 1.313 m . A decrease in the continuum level at 1.313 m drives the H2OA ratio higher. The effect is minor but nevertheless evident in Figure 12. Before L6, the data are evenly spread about the line while beyond L6 the data could be better fit with a slightly steeper line or a weak second order polynomial. Of the four H2O indexes, H2OB seems to show the best linear correlation with previously assigned spectral type across the entire sequence. The H2OC ratio exhibits behavior similar to the H2OA index because the onset of CH4 absorption in the T dwarfs influences the continuum level. Again, a weak spectral break to a slightly steeper linear fit occurs around L6. In the -band, the H2OD ratio appears to have a good linear correlation with spectral type.
Our CH4 indexes have an excellent linear correlation with the near-infrared derived T dwarf spectral types assigned by B02 and G02. Excluding the last two data points in the CH4A and CH4B plots in Figure 12 (the T8 dwarfs Gl570D and 2MASS 0415-09) improves the fit slightly, most likely as a result of saturation of the CH4 bands.
The behavior of the FeH and CO indexes is more complex. Both of the FeH indexes decrease in value as the band strength increases until L3.5-L4, where they reach minima and account for a 25% drop in the continuum in the -band and a 60% drop in the -band. An abrupt change in the FeH flux ratios can be seen at the transition from L5 to L6, possibly related to peaks in the H2OA and H2OC indexes at the same spectral types. At later spectral types the index increases steadily to spectral type T5.5 because, in both and it is no longer measuring FeH but the slope of the continuum. Very weak -band FeH can be seen in the T5 2MASSW 0559-14, although its relatively bright magnitude of 13.83 makes the detection of subtle features easier than in other fainter T dwarfs. However, the T2 object SDSS 1254-01 has no discernable FeH band at 1.14 µm, whereas the 0.988 µm FeH band in is detected as late as T6. Beyond T6 the ratio rises steeply as a result of the influence of H2O absorption on the continuum and the index no longer has any physical meaning with regard to FeH absorption.
The CO flux ratio (Fig.13) shows little variation from M6 to T2. There may be a slight minimum in the mid-L dwarfs, but the data deviate from a constant by no more than 15%, similar to the result found by Reid et al. (2001). Later than T2 the ratio has no meaning for CO and would show a (noisy) rising trend that grows in value as CH4 absorption depresses the continuum relative to the wavelength of the CO band.
4.2 Alkali Line Equivalent Widths
The dominant atomic line features in the near-infrared are the four neutral K I lines in the -band. Table 7 gives the calculated equivalent widths and estimated errors in Å, while Figures 14 and 15 show the variation of equivalent width for each K I doublet as a function of published spectral type. For the short-wavelength pair, the best estimate of the local continuum was calculated by finding the median value in a 0.002 m window on both sides of each line; the continuum point between the lines was usually common to both lines. The selected wavelengths were 1.162 µm, 1.1735 µm and 1.185 µm. For the long-wavelength pair the continuum points were centered at 1.233 µm, 1.248 µm and 1.260 µm. From these points, a linear interpolation was made to determine the approximate continuum across the line. Equivalent widths were measured by summing the residual intensities (interpolated continuum minus line) between specific wavelength intervals and multiplying by the resolution element in angstroms. The limits used were: 1.167-1.171 µm, 1.175-1.180 µm, 1.2415-1.246 µm and 1.2498-1.2558 µm. The choice of 1.2415 m for the 1.2435 m K I line is to avoid contamination by the FeH band at 1.24 µm. We visually confirmed that these wavelength regions were appropriate for each spectrum. To determine an uncertainty for the equivalent width, the location of the continuum reference points was allowed to vary by about 10% of the sample bandwidth and the value of equivalent width was recalculated. The tabulated equivalent width is the median of 25 such trials and the uncertainty is the standard deviation in this set.
Although there is considerable scatter, general trends can be seen in Figures 14 and 15. The K I lines strengthen across the M to L dwarf boundary, form a broad peak around L4 or L5, decline towards the late L types, and rise again at the L/T boundary before finally disappearing in the latest T dwarfs. The longer wavelength pair can be followed to T6. We also found that the K I lines are narrower and weaker in very young low-mass objects with lower surface gravity. Those results will be reported elsewhere (McGovern et al. 2003, in prep.).
At 1.1385 and 1.1407 m there is a relatively strong Na I feature which, in an M6 dwarf, is even stronger than the K I doublets. As shown by the variation in equivalent width of the doublet in Fig. 16, this Na I doublet strengthens from M6 to a broad peak around L3/L4, weakens rapidly through L8 and is absent by T0. Another weaker Na I doublet occurs at 2.2 m and is quite prominent from M6-M9 but does not persist past L2. The variation in equivalent width of this doublet is shown in Fig. 17 and tabulated in Table 8.
4.3 Weak Atomic Features of Fe, Al and Ca
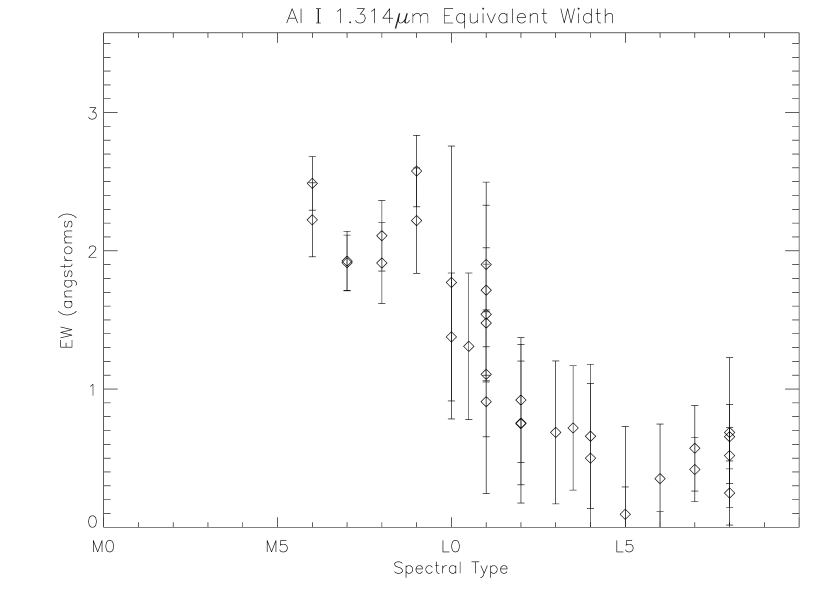
Despite the extensive blanketing of the region with molecular transitions, several interesting atomic lines of more refractive elements can be studied. Figures 18 and 19 show the and regions for an M8, M9, L0 and L1 dwarf. The Al I doublet in the -band disappears at the M9/L0 transition. Although heavily contaminated by H2O absorption, the -band Ca I triplet seems to persist to L2. This transitional change at the M/L boundary is also seen in the equivalent widths of the Al I doublet (Figure 20). Because of the H2O contamination equivalent widths are difficult to measure for the Ca I features and none are reported at this time. There are also several Fe I lines in the -band, but the least contaminated feature is the line at 1.189 m which has an equivalent width of about 1 Å at M9. As shown in Fig. 21, this line persists until at least L3 before disappearing. Table 8 includes the equivalent width of the Al and Fe lines along with the Na lines mentioned above.
4.4 Spectral Energy Distributions
The behavior of the flux-calibrated () spectra given in Figures 4 and 10 can be quantified. Figure 22 shows the ratio of the peak calibrated flux in the - and -bands relative to that in derived from the spectra. For convenience of plotting, the calibrated flux spectra were normalized using the mean flux value in -band in the wavelength region 1.24 - 1.29 µm. The peak flux of the - and -bands were measured from the mean fluxes in the wavelength regions 1.55 - 1.60 m and 2.08 - 2.13 m respectively, and compared to the peak value in the -band. At all spectral types, the peak flux at exceeds that at or , but there is a notable trend through the mid-L dwarfs in which the relative difference weakens until the fluxes are almost equal, and then the band recovers in the T dwarfs. This spectral result is of course mirrored in the colors and is generally attributed to the formation, and settling out, of dust (Tsuji 2001; Ackerman & Marley 2001).
5 DISCUSSION
5.1 Fits to H2O Ratios
In presenting the NIRSPEC BDSS results in this paper we have used the published L spectral types from Kirkpatrick et al. (1999, 2000), and therefore the classification scheme described in K99. Since much of the energy emission occurs in the near-infrared, it is important to determine if the optically-defined classification scheme for L dwarfs yields an ordering that is also consistent with observed spectroscopic morphology in the near-infrared. At present, there is no agreed classification scheme. Visual inspection of the 53 -band spectra, using the apparent growing strength of the H2OA absorption band as the primary guide for M - L dwarfs, reveals a remarkable consistency with far red optical classification. A similar conclusion can be reached on examining the set of 25 spectral energy distributions extending wavelength coverage out to 2.315 m . Given the large wavelength range involved, this is an encouraging result. This overall impression is strengthened by examination of flux ratio plots (Figs.11-13) as a function of optical spectral type. Note that the objects plotted as solid black points are the previously defined standards. From the best fitting lines to the four H2O indexes it is possible to write expressions that allow spectral types to be predicted from the NIRSPEC flux ratios. These expressions are:
| (1) |
| (2) |
| (3) |
| (4) |
We are not advocating a spectral classification scheme based entirely on a single molecular species. These relationships demonstrate however, that a strong and useful correlation exists. When all four H2O ratios are available, a weighted mean using the 1 errors as weights, gives the best overall fit to the existing spectral classes. Of course, the derived spectral class must also be consistent with the FeH and alkali line strengths, and this is generally the case. In applying these relationships to NIRSPEC observations, the H2O ratios serve to identify the likely spectral type. Classification then follows by a detailed comparison of the spectrum to that of the standard for that type. Nevertheless, there are discrepancies and limitations to the correspondence between the optical and NIR spectral types. For example, from the six L1 dwarfs observed in -band (Fig. 9) the average H2OA flux ratio is 0.6330.040 (6.25%), which translates to an error of 1.1 in spectral type, consistent with the above linear relations. It is curious that 2MASS 1300+19 has the highest equivalent widths in K I of any L1, or indeed almost any other L type. On the basis of the H2OA index and the K I equivalent widths, the infrared type might be as late as L3. Also, as shown in Figs. 14 and 15, the L2 dwarf 2MASS 1726+15 and the L6.5 dwarf 2MASS 2244+20 have weaker K I lines than expected from the trend. In addition, Kelu-1 (L2) also appears weaker than might be expected. These effects are possibly related to gravity and/or metallicity rather than to effective temperature, with the caveat that linear fits to H2O indexes need not be linear with effective temperature. We will shortly report on a study that demonstrates that younger objects exhibit weaker alkali lines (McGovern et al. 2003; in prep.)
5.2 Comparison with other classification schemes for L dwarfs
Following the K99 classification scheme, Figure 2 does not contain any objects classified as type L9. G02 developed a near-infrared scheme optimized for T dwarfs, with L dwarfs being classified the same way by noting the continuity in spectral indexes. The main difference was that some optical L8 objects were re-classified as L9. For example, G02 assigned L9 1 to 2MASS 0310+16 and L9.5 1 to 2MASS 0328+23 (see Fig. 8). At least in the -band, the morphological distinction is marginal between L8 and T0, although it can be argued that both of these L8 objects do appear as slightly later spectral types. The -band spectra of the five L8 dwarfs in our survey are collected in Fig. 23. The average value of the H2OA index for the five L8s in our survey is 0.4170.033 (7.9%), which is closer to L7. 2MASS 1632+19, classified as L8 by K99, is assigned L7.5 by G02, whereas a weighted average of our four H2O ratios yields L7. If the CH4 indexes are included however, then 2MASS 1632+19 appears intermediate between an L8 and a T0, and the final estimate would be L8. Clearly, the classification of objects near the L/T boundary requires further study.
DENIS-P J1228-15AB is classified as L5 by K99 and L62 by G02 indicating that its infrared signature is less conclusive. From Fig. 1 it is clear that its FeH strength is too great for L6 and its H2OA band is deeper than in L4. There is also a peculiar depression in the -band spectrum near 1.29 m and a slightly stronger slope to shorter wavelengths. Our results suggest L5 at -band, but with peculiarities. Another curious object is DENIS-P J0205-11AB which is classified L5.52 by G02 and L7 by K99. Examination of Figs. 2, 10 and 11 strongly suggest a late spectral type, including even the suggestion of CH4 absorption. Our H2O ratios yield L8, but the CH4 indexes suggest between L8 and T0.
5.3 Comparison with other classification schemes for T dwarfs
Published T dwarf classifications from B02 and G02 already include near-infrared indexes, and therefore correspondence with the NIRSPEC data should be good. The only difference is SDSS 1624+00 which is given as T6 by both B02 and G02, yet appears more like T7 at -band in Figure 2, but has and CH4 ratios completely consistent with T6. These differences are small and imply substantial consistency between NIR types and our linear indexes. The following relations demonstrate the expected good correspondence of our CH4 indexes to published spectral type. Again, we are not advocating that T dwarf classifications be based on a single molecular species. A weighted combination of the CH4 and H2O indexes is very effective for assigning spectral type.
| (5) |
| (6) |
5.4 Further discussion of the BDSS
One remarkable feature apparent in our collection of NIR spectra of M, L and T dwarfs is the continuous increase in H2O absorption. Until the onset of CH4 absorption at the L/T boundary, changes in spectral morphology are not as apparent as in the optical where TiO declines and gives way to CrH. Consequently, the M/L boundary is poorly delineated in the NIR. With the resolution of the BDSS however, a clear transition is revealed by the behavior of the refractory elements Al and Fe. The equivalent width of the 1.189 m Fe I line begins to decline after M9, and the Al I doublet disappears from the -band between M9 and L0. Interestingly, the Ca I lines in the -band persist until at least L2, and the neutral Fe line at 1.189 m finally disappears after L3.
The Al I doublet involves transitions between energy levels at 3.14 and 4.09 eV, whereas the Fe I line comes from states at 2.176 and 3.211 eV. The Na I doublet at 1.14 m involves energy levels at 2.10 and 3.19 eV; this line weakens markedly after L4. The -band K I lines are all associated with even lower energy levels (1.61 to either 2.67 or 2.61 eV). On the other hand, the -band Ca I lines are associated with transitions that require the population of higher level states (4.62-5.25 eV, and 3.91-4.53 eV). Because the Na I doublet at 2.206 m involves states at 3.19-3.75 eV, one might expect the Ca I lines to vanish at an earlier spectral type, but they do not.
This behavior may offer constraints on condensation chemistry because, as shown by Lodders (2002), the equilibrium chemistry of Ti, V, Ca and Al is inextricably linked together. Based on the analysis of Lodders (2002), the highest temperature condensate containing either Ca or Ti is hibonite (CaAl12O19). The condensation temperatures depend on total pressure, but calculations for 1 bar seem to be applicable (K. Lodders 2003, private communication). Hibonite starts condensing at 1997 K but is replaced by grossite (CaAl4O7) at 1977 K. Condensates bearing titanium follow, and by 1818 K, where perovskite (CaTiO3) is stable, 97% of all Ca is expected to be tied up in solids. Because H2O contamination in this region makes it hard to quantify when the line is really gone, 1818 K is a conservative lower limit. If there is still as much as 10% of all Ca in Ca I gas then the models of Lodders (2002) imply a brightness temperature 1820-1850 K for an L1 in -band. The Al chemistry is more complicated, but a temperature in the range 1950-2000 K would appear possible at . In any case, the presence of Ca I in the -band as late as L1, combined with the absence of Al I in the -band spectrum of an L0 should provide a useful constraint on the temperature at the M/L boundary, with the caveat that different temperature layers are being probed at these two wavelengths.
L and T dwarfs are not black bodies, and brightness temperatures derived from spectra can range over 1000 K in the near-infrared due to the very large variations in opacity with wavelength (Saumon et al. 2000). In the absorption bands of H2O, one probes only the cooler upper levels of the atmosphere, whereas in the continuum near the pressure broadened K I lines the emergent flux comes from much deeper layers. The condensation chemistry temperatures discussed above are significantly lower (500K) than those derived by empirical estimates of Teff (from luminosity and radius) for objects with known parallax (B02). Using that method, B02 provide a correlation between temperature and spectral type for L dwarfs, and find that extrapolation of the roughly linear relation between spectral type and effective temperature for L dwarfs significantly underestimates the temperatures of T dwarfs. The almost linear behavior of the strength of the H2O (and CH4) bands with spectral type presented here does not necessarily imply a continuous linear variation of Teff with spectral type. Dust formation and settling has a significant effect. Clearing of dust as the photospheric temperature falls, enables the column density of water (and methane) to increase steadily. Also, conversion of CO to CH4 produces additional H2O to strengthen the bands. B02 speculate that only a narrow temperature range separates L8-T5 objects.
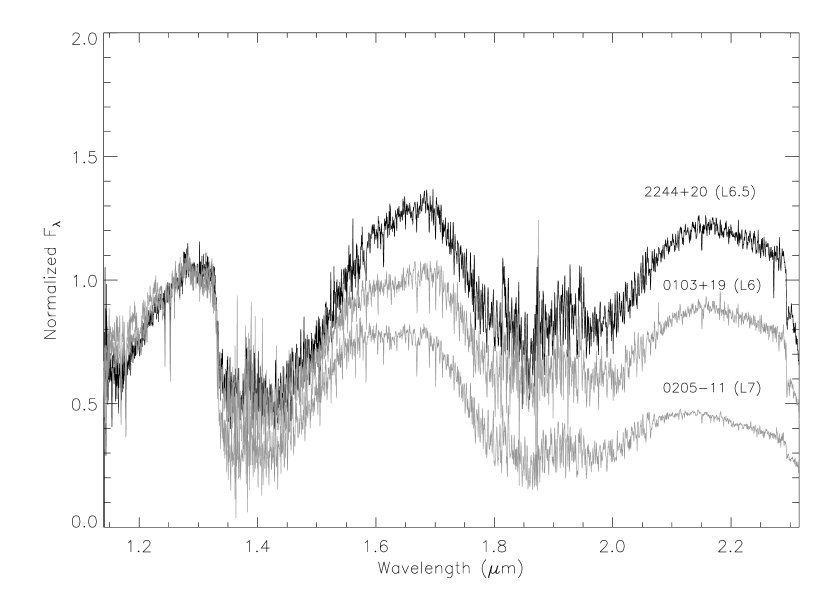
There are also objects which stand out as exceptions to the trends we have identified. One of these is the L6.5 object 2MASS 2244+20. Figure 24 compares the 1.1-2.3 m spectra of this object and two other sources classified as L6 and L7. All three spectra have been normalized at 1.270 µm in the -band. Not only is the flux from 2MASS 2244+20 dramatically enhanced at and relative to the levels expected for an L6.5, but the H2O is weaker and the CO bands are unusually strong. A weighted average of the H2O indexes gives L5. In addition, Table 6 and Figs. 14-15 show that 2MASS 2244+20 has the smallest K I equivalent widths of any L dwarf (2-3 Å). This result may imply a lower surface gravity or perhaps a lower metallicity. Finally, the -band is clearly peaked at 1.70 µm unlike any other L or T dwarf. This L dwarf, which has extremely red IR colors (; ), clearly has unusual IR spectral features. In contrast, the far-red optical spectrum of 2MASS 2244+20 obtained by Kirkpatrick using the LRIS spectrograph on Keck appears normal when compared to other L dwarfs (see K99 for methods). Figure 25 shows the LRIS spectrum compared to that of 2MASS 0103+19 and D0205-11. Overall, the infrared characteristics of 2MASS 2244+20 may be indicative of unusually strong veiling attributable to dust clouds or perhaps an unusual metallicity.
Major changes in opacity caused by the formation and subsequent clearing of dust clouds would also explain the behavior of the flux-calibrated spectra in Figs. 3 & 10. The -band flux becomes more and more depressed relative to and (hence the colors redden) as the spectral type changes from M to late L. Around L8 the flux peaks in are broadly level in and . This situation is reversed at the L/T boundary where the -band flux becomes progressively stronger again as the T spectral subclass becomes later; the peak fluxes in each band are always such that . In addition, the equivalent widths of the K I lines increase again in the early T’s after a decline through the late L types, consistent with seeing deeper into a clearer atmosphere. These trends are verified by the parallax data of Dahn et al. (2002), which show a brightening at from L8 to T5. Burgasser et al. (2002a) have attributed this brightening to the rapid dispersal and condensation of clouds across the L/T transition.
The six molecular band indexes used here perform remarkably well over a large spectral range. Two of the H2O indexes and one CH4 index saturate at the current T8, while the remaining indexes appear to have some more range. It is very likely however, that some of these ratios will turn around and increase. That is, they will no longer be monotonic over a wider range of later types. Such behavior would arise even though the absorber in question saturates the “on-band” portion of the index, because additional absorbers may begin to suppress the “off-band” part of the index. For example, in the -band, where CH4 appears to saturate at T8, it is possible that CIA by H2 will continue to suppress the “off-band” pseudo-continuum peak, eventually flattening the entire band. Termination of the T sequence may be more influenced by H2O than CH4, since the formation of water clouds near 500 K may have a significant effect on the spectra.
6 CONCLUSIONS
We have obtained and analyzed a sample of 53 -band spectra and 25 1-2.3 µm spectra of M, L and T dwarfs with high signal-to-noise, identical instrumentation, and a uniform data reduction process. A relatively high spectral resolution of R 2,000 was employed in our NIRSPEC survey, yielding a library of spectra more useful than lower resolution data for constraining model atmospheres.
Nine near-infrared molecular bands (4 H2O, 2CH4, 2FeH and 1 CO), together with several neutral atomic species (K, Na, Fe, Al, Ca), appear to provide good diagnostics for a self-consistent, pure infrared, spectral classification scheme for both L and T dwarfs in most cases. Lines of Al I in the -band disappear at the M/L boundary. The consistent appearance of CH4 in both the and bands defines the L/T boundary, but evidence of CH4 can be seen as early as L7 in some objects. Flux ratio indexes for the H2O and CH4 features are monotonic and almost linear with spectral class. Consistency with the optically-derived spectral types suggests that the primary underlying physical quantity controlling the appearance of the spectra is effective temperature. The K I lines are gravity sensitive. Flux-calibrated spectra for 25 sources, 16 of which provide overlapping wavelength coverage with far red optical spectra, show that the peak flux emerges in the -band for early L dwarfs and for T dwarfs, but that late L dwarfs have significantly suppressed -band flux, consistent with redder colors. One source, 2MASS 2244+20, classified optically as L6.5 has discordant molecular band flux ratios and exhibits a spectrum that is more depressed in the -band than any other L dwarf. This behavior is probably due to dust extinction, but the effects of metallicity also need to be considered.
The spectral classification of main-sequence stars, as originally codified in the Henry Draper catalog (Pickering 1890; Cannon and Pickering 1901) and refined into the MK system (Morgan, Keenan, and Kellman 1943), requires the establishment of spectral standards. Once the standards are established, the response of a given spectrograph at a given site can be calibrated, and objects of unknown types compared to the standards, as observed by that instrument at that site. K99 established standards for L dwarfs using far red optical diagnostics. B02 provided a set of standards for T dwarfs based on infrared properties. By including many of these standards in the BDSS, we have demonstrated that a self-consistent pure NIR classification scheme should be possible.
In subsequent papers we will report on spectra with ten times higher resolution (McLean et al. 2003b; in prep.), discuss the establishment of a near-infrared L classification scheme and compare data to models. In addition, we will report on the results of programs to (1) observe the morphology and spectral characteristics of a subsample of bright brown dwarfs at R20,000 (McLean et al. 2003b; in prep.), (2) develop indicators of surface gravity (McGovern et al. 2003; in prep.), and (3) use high resolution spectroscopy to search for radial velocity variations indicative of spectroscopic companions (Prato et al. 2003; in prep.). The BDSS data will be made available on request and through an archive web site currently under development (http://www.astro.ucla.edu/$∼$mclean/BDSSarchive).
References
- (1) Ackerman, A. S., & Marley, M. S. 2001, ApJ, 556, 872
- (2) Allard, F., Hauschildt, P. H., Alexander, D. R., Tamanai, A., & Schweitzer, A. 2001, ApJ, 556, 357
- (3) Becklin, E.E., & Zuckerman, B. 1988, Nature, 336, 656
- (4) Bergeron, P.,Wesemael, F., & Beauchamp, A. 1995, PASP, 107, 1047
- (5) Burgasser, A. J., Kirkpatrick, J. D., Reid, I. N., Liebert, J., Gizis, J. E., & Brown, M. E. 2000a, AJ, 120, 473
- (6) Burgasser, A. J., Marley, M. S., Ackerman, A. S., Saumon, D., Lodders, K., Dahn, C. C., Harris, H. C., & Kirkpatrick, J. D., 2002a, ApJ, 571, L151
- (7) Burgasser, A. J., et al. 1999, ApJ, 522, L65
- (8) Burgasser, A. J., et al. 2000b, ApJ, 531, L57
- (9) Burgasser, A. J., et al. 2002b, ApJ, 564, 421 (B02)
- (10) Burrows, A., Hubbard, W. B., Lunine, J. I., & Liebert, J. 2001, Rev. Mod. Phys., 73, 719
- (11) Burrows, A., Marley, M.S., & Sharp, C.M. 2000, ApJ, 531, 438
- (12) Burrows, A., Ram, R. S., Bernath, P., Sharp, C. M., & Milsom, J. A. 2002, ApJ, 577, 986
- (13) Cannon, A. J., & Pickering, E.C. 1901, Ann. Astron. Obs. Harvard Coll., 28, 129
- (14) Cohen, M., Walker, R.G., Barlow, M.J., & Deacon, J.R. 1992, AJ, 104, 1650
- (15) Cox. A.N., ed. 2000, Allen’s Astrophysical Quantities (4th ed,; New York: Springer)
- (16) Cushing, M. C., Rayner, J. T., Davis, S. P., & Vacca, W. D. 2003, ApJ, 582, 1066
- (17) Dahn, C. C., et al. 2002, AJ, 124, 1170
- (18) Delfosse, X., et al. 1997, A & A, 327, L25
- (19) Dulick, M., Bauschlicher, C.W., Burrows, A., Sharp, C.M., Ram, R.S., & Bernath, P. 2003, astro-ph/0305162
- (20) Epchtein, N., et al. 1997, Messenger, 87, 27
- (21) Geballe, T. R., et al. 2002, ApJ, 564, 466 (G02)
- (22) Hillenbrand, L. A., Foster, J. B., Persson, S. E., & Matthews, K. 2002, PASP, 114, 708
- (23) Jones, H. R. A., Longmore, A. J., Jameson, R. F., & Mountain, C. M. 1994, MNRAS, 267, 413
- (24) Kirkpatrick, J. D., Beichman, C. A., & Skrutskie, M. F. 1997, ApJ, 476, 311
- (25) Kirkpatrick, J. D., Dahn, C. C., Monet, D. G., Reid, I. N., Gizis, J. E., Liebert, J., & Burgasser, A. J. 2001, AJ, 121, 3235
- (26) Kirkpatrick, J.D., Henry, T.J., & Liebert, J. 1993, ApJ, 406, 701
- (27) Kirkpatrick, J.D., et al. 1999, ApJ, 519, 802 (K99)
- (28) Kirkpatrick, J. D., Reid, I. N., Liebert, J., Gizis, J. E., Burgasser, A. J., Monet, D. G., Dahn, C. C., Nelson, B., & Williams, R. J. 2000, AJ, 120, 447
- (29) Leggett, S. K. 1992, ApJS, 82, 351
- (30) Leggett, S. K., Toomey, D. W., Geballe, T. R., & Brown, R. H. 1999, ApJ, 517, L139
- (31) Leggett, S. K., et al. 2000, ApJ, 536, L35
- (32) Leggett, S. K., Allard, F., Geballe, T., Hauschildt, P. H., & Schweitzer, A. 2001, ApJ, 548, 908
- (33) Liebert, J., Reid, I.N., Burrows, A., Burgasser, A.J., Kirkpatrick, J.D., & Gizis, J.E. 2000, ApJ, 533, L155
- (34) Lodders, K. 2002, ApJ, 577, 974
- (35) Martín, E., Delfosse, X., Basri, G., Goldman, B., Forveille, T., & Zapatero Osorio, M.R. 1999, AJ, 118, 2466
- (36) McGovern, M., McLean, I. S., Kirkpatrick, J. D., Burgasser, A. J., & Prato, L. 2003, in prep.
- (37) McLean, I.S., et al. 1998, Proc. SPIE, 3354, 566
- (38) McLean, I.S., et al. 2000a, Proc. SPIE, 4008, 1048
- (39) McLean, I.S., et al. 2000b, ApJ, 533, L45
- (40) McLean, I.S., et al. 2001, ApJ, 561, L115
- (41) McLean, I.S., et al. 2003a, in IAU Symp. 211, Brown Dwarfs, ed. E. Martin, (San Francisco: ASP), 385
- (42) McLean, I.S., et al. 2003b, in prep.
- (43) Morgan, W.W., Keenan, P.C., & Kellman, E. 1943, An Atlas of Stellar Spectra, with an Outline of Spectral Classification (Chicago: Univ. Chicago Press)
- (44) Nakajima, T., Oppenheimer, B. R., Kulkarni, S. R., Golimowski, D. A., Matthews, K., & Durrance, S. T. 1995, Nature, 378, 463
- (45) Nakajima, T., Tsuji, T., & Yanagisawa, K. 2001, ApJ, 561, L119
- (46) Oppenheimer, B. R., Kulkarni, S. R., Matthews, K., & Nakajima, T. 1995, Science, 270, 1478
- (47) Oppenheimer, B. R., Kulkarni, S. R., Matthews, K., & van Kerkwijk, M. H. 1998, ApJ, 502, 932
- (48) Pickering, E.C. 1890, Havard Coll. Obs. Ann., 27, 1
- (49) Prato, L., et al. 2003, in prep.
- (50) Reid, I. N., Kirkpatrick, J. D., Gizis, J. E., Dahn, C. C., Monet, D. G., Williams, R. J., Liebert, J., & Burgasser, A. J. 2000, AJ, 119, 369
- (51) Reid, I. N., Burgasser, A. J., Cruz, K., Kirkpatrick, J. D., & Gizis, J. E. 2001, AJ, 121, 1710
- (52) Ruiz, M. T., Leggett, S. K., & Allard, F. 1997, ApJ, 491, L107
- (53) Saumon, D., Bergeron, P., Lunine, J. I., Hubbard, W. B., & Burrows, A. 1994, ApJ, 424, 333
- (54) Saumon, D., Geballe, T.R., Leggett, S. K., Marley, M. S., Freedman, R. S., Lodders, K., Fegley, B., & Sengupta, S. K. 2000, ApJ, 541, 374
- (55) Skrutskie, M. F., et al. 1997, The Impact of Large-Scale Near-IR Sky Surveys, ed. F. Garzon et al. (Dordrecht: Kluwer), 25
- (56) Strauss, M.A., et al. 1999, ApJ, 522, L61
- (57) Testi, L., et al. 2001, ApJ, 522, L147
- (58) Tokunaga, A. T. 2000, in Allen’s Astrophysical Quantities, ed. A. N. Cox (4th ed.; New York: Springer), 151
- (59) Tokunaga, A. T., & Kobayashi, N. 1999, AJ, 117, 1010
- (60) Tsuji, T. 2001, in Ultracool Dwarfs: New Spectral Types L and T, ed. H. R. A. Jones & I. A. Steele (Berlin: Springer), 9
- (61) Wilson, J. C., Kirkpatrick, J. D., Gizis, J. E., Skrutskie, M. F., Monet, D. G., & Houck, J. R. 2001, AJ, 122, 1989
- (62) Wing, R.F. & Ford, W.K., Jr. 1969, PASP, 81, 527
- (63) York, D.G., et al. 2000, AJ, 120, 1579
- (64)


| Configuration | Filter | CDGaaCross dispersed grating angle in degrees | Wavelength Range (m ) | Band coverage |
|---|---|---|---|---|
| N1 | NIRSPEC-1 | 34.95 | 0.947 - 1.121 | / |
| N2 | NIRSPEC-2 | 36.48 | 1.089 - 1.293 | // |
| N3 | NIRSPEC-3 | 34.08 | 1.143 - 1.375 | |
| N4 | NIRSPEC-4 | 35.58 | 1.241 - 1.593 | |
| N5 | NIRSPEC-5 | 36.72 | 1.431 - 1.808 | |
| N6a | NIRSPEC-6 | 33.48 | 1.558 - 2.000 | |
| N6b | NIRSPEC-6 | 35.18 | 1.937 - 2.315 | |
| N7 | NIRSPEC-7 | 35.66 | 1.997 - 2.428 |
| Spectral | R.A. | Decl. | 2MASS | 2MASS | 2MASS | UT Date(s) | ||
|---|---|---|---|---|---|---|---|---|
| Object | Type | (J2000.0) | (J2000.0) | (mag) | (mag) | s(mag) | Observed | Coverage |
| Wolf 359 (Gl 406) | M6 | 10 56 28.9 | 07 00 53 | 7.03 0.03 | 6.48 0.03 | 6.06 0.03 | 2000 Dec 06 | N3,4,6a,6b |
| 2001 Dec 30 | N1,2 | |||||||
| Gl 283B | M6 | 07 40 20.0 | -17 24 48 | 10.140.03 | 9.61 0.03 | 9.26 0.03 | 2001 Dec 31 | N3 |
| LHS 2351 | M7 | 11 06 18.9 | 04 28 32 | 12.350.03 | 11.760.03 | 11.340.03 | 2000 Dec 14 | N3 |
| VB 8 | M7 | 16 55 35.74 | -08 23 36.0 | 9.77 0.03 | 9.19 0.03 | 8.82 0.03 | 2001 Jun 10 | N3 |
| LP 412-31 | M8 | 03 20 59.6 | 18 54 23 | 11.740.03 | 11.040.03 | 10.570.03 | 2000 Dec 04 | N3 |
| VB 10 | M8 | 19 16 58.10 | 05 09 11.1 | 9.90 0.03 | 9.24 0.03 | 8.80 0.03 | 2001 Jun 10 | N1,2,3,4,6a,6b |
| LHS 2065 | M9 | 08 53 36.2 | -03 29 32 | 11.190.03 | 10.470.03 | 9.97 0.03 | 2002 Apr 22 | N3,4,6a,6b |
| 2MASSW J1239+20 | M9 | 12 39 19.4 | 20 29 52 | 14.480.03 | 13.680.03 | 13.200.03 | 2002 Dec 24 | N3 |
| 2MASSW J0345+25 | L0 | 03 45 43.2 | 25 40 23 | 13.990.03 | 13.170.03 | 12.670.03 | 2001 Dec 29 | N3 |
| 2001 Dec 30 | N1,2,4,6a,6b | |||||||
| HD 89744B | L0 | 10 22 14.9 | 41 14 27 | 14.890.04 | 14.040.05 | 13.620.05 | 2001 Mar 06 | N1,2,3 |
| 2001 Jun 11 | N4 | |||||||
| 2002 Apr 22 | N6a,6b | |||||||
| 2MASSW J0746+20AB | L0.5 | 07 46 42.6 | 20 00 32 | 11.740.03 | 11.000.04 | 10.490.03 | 2000 Apr 27 | N3 |
| 2MASSW J0208+25 | L1 | 02 08 18.3 | 25 42 53 | 14.020.03 | 13.110.04 | 12.580.04 | 2000 Dec 05 | N3 |
| 2MASSW J1035+25 | L1 | 10 35 24.6 | 25 07 45 | 14.700.04 | 13.880.04 | 13.280.04 | 2001 Dec 31 | N3,4,6a |
| 2002 Jan 01 | N6b | |||||||
| 2MASSW J1300+19 | L1 | 13 00 42.6 | 19 12 35 | 12.710.02 | 12.070.03 | 11.610.03 | 2000 Apr 26 | N3 |
| 2MASSW J1439+19 | L1 | 14 39 28.4 | 19 29 15 | 12.760.04 | 12.050.04 | 11.580.04 | 2000 Apr 25 | N3 |
| 2MASSW J1658+70 | L1 | 16 58 03.8 | 70 27 02 | 13.290.02 | 12.490.03 | 11.930.02 | 2000 Jul 29 | N3,4,6a,6b |
| 2MASSW J2130-08 | L1 | 21 30 44.6 | -08 45 20 | 14.140.04 | 13.330.05 | 12.820.04 | 2001 Jun 11 | N3 |
| 2MASSW J0015+35 | L2 | 00 15 44.8 | 35 16 03 | 13.820.04 | 12.810.03 | 12.240.03 | 2000 Dec 05 | N3 |
| 2001 Oct 09 | N1 | |||||||
| 2001 Oct 10 | N4,6a,6b | |||||||
| 2002 Sep 01 | N2 | |||||||
| Kelu-1 | L2 | 13 05 40.2 | -25 41 06 | 13.420.02 | 12.390.03 | 11.730.03 | 1999 Apr 29 | N3,4,6a,6b |
| 2MASSW J1726+15 | L2 | 17 26 00.1 | 15 38 19 | 15.650.07 | 14.460.06 | 13.640.05 | 2002 Sep 01 | N3 |
| 2MASSW J1506+13 | L3 | 15 06 54.4 | 13 21 06 | 13.410.03 | 12.410.03 | 11.750.03 | 2000 Apr 26 | N3 |
| 2MASSW J1615+35 | L3 | 16 15 44.2 | 35 59 01 | 14.550.04 | 13.550.04 | 12.890.05 | 2000 Apr 26 | N3 |
| 2MASSW J0036+18 | L3.5 | 00 36 16.2 | 18 21 10 | 12.440.04 | 11.580.03 | 11.030.03 | 2000 Jul 28 | N3 |
| GD 165B | L4 | 14 24 39.1 | 09 17 10 | 15.550.06 | 14.550.09 | 14.060.07 | 1999 Jun 03 | N3 |
| 2001 Jun 11 | N1,2,4,6a,6b | |||||||
| 2MASSI J2158-15 | L4 | 21 58 04.6 | -15 50 10 | 15.040.05 | 13.870.06 | 13.190.05 | 2001 Oct 09 | N3 |
| DENIS-P J1228-15AB | L5 | 12 28 15.2 | -15 47 34 | 14.380.03 | 13.360.03 | 12.810.03 | 2001 Jun 03 | N3 |
| 2MASSW J1507-16 | L5 | 15 07 47.7 | -16 27 39 | 12.820.03 | 11.900.03 | 11.300.03 | 1999 Jun 03 | N3,4,6a,6b |
| 2MASSW J0103+19 | L6 | 01 03 32.0 | 19 35 36 | 16.260.09 | 14.880.06 | 14.150.07 | 2000 Dec 04 | N3 |
| 2000 Dec 05 | N4,6b | |||||||
| 2001 Oct 09 | N1 | |||||||
| 2002 Jan 01 | N2,6a | |||||||
| 2MASSW J0850+10AB | L6 | 08 50 35.9 | 10 57 16 | 16.460.12 | 15.230.10 | 14.460.07 | 2000 Dec 06 | N3 |
| 2MASSW J2244+20 | L6.5 | 22 44 31.7 | 20 43 43 | 16.410.13 | 14.970.07 | 13.930.07 | 2001 Oct 10 | N3,4,6a,6b |
| DENIS-P J0205-11AB | L7 | 02 05 29.4 | -11 59 30 | 14.580.03 | 13.590.03 | 12.980.04 | 1999 Aug 20 | N3,4,6a,6b |
| 2002 Sep 01 | N1,2 | |||||||
| 2MASSW J1728+39AB | L7 | 17 28 11.5 | 39 48 59 | 15.960.08 | 14.780.07 | 13.900.05 | 2000 Apr 27 | N3 |
| 2MASSW J0310+16 | L8 | 03 10 59.9 | 16 48 16 | 16.430.11 | 14.950.07 | 14.400.10 | 2001 Oct 09 | N3 |
| 2MASSI J0328+23 | L8 | 03 28 42.7 | 23 02 05 | 16.670.14 | 15.620.13 | 14.840.13 | 2001 Dec 29 | N3 |
| Gl 337C | L8 | 09 12 14.7 | 14 59 40 | 15.550.11 | 14.660.10 | 14.030.08 | 2001 Dec 29 | N3 |
| 2001 Dec 30 | N2 | |||||||
| 2002 Jan 01 | N1,4,6a,6b | |||||||
| Gl 584C | L8 | 15 23 22.6 | 30 14 56 | 16.320.11 | 15.000.07 | 14.240.07 | 1999 Jun 03 | N3 |
| 1999 Aug 20 | N4,6a,6b | |||||||
| 2MASSW J1632+19 | L8 | 16 32 29.1 | 19 04 41 | 15.860.07 | 14.590.05 | 13.980.05 | 2002 Aug 31 | N3,4,6a,6b |
| 2002 Sep 01 | N1,2 | |||||||
| SDSSP J0423-04 | T0 | 04 23 48.6 | -04 14 04 | 14.450.03 | 13.440.04 | 12.940.04 | 2001 Oct 10 | N4,6a,6b |
| 2001 Dec 31 | N1,3 | |||||||
| 2002 Dec 23 | N2 | |||||||
| SDSSP J0151+12 | T1 | 01 51 41.7 | 12 44 30 | 16.520.13 | 15.580.12 | 15.090.19 | 2001 Oct 09 | N3 |
| SDSSP J0837-00 | T1 | 08 37 17.2 | -00 00 18 | 16.770.21 | 15.8 | 15.3 | 2000 Dec 05 | N3,4,6a,6b |
| SDSSP J1254-01 | T2 | 12 54 53.9 | -01 22 47 | 14.880.04 | 14.040.04 | 13.830.06 | 2001 Mar 07 | N1,2,3,6b |
| 2001 Jun 10 | N4,6a | |||||||
| SDSSP J1021-03 | T3 | 10 21 09.7 | -03 04 20 | 16.260.10 | 15.330.11 | 15.100.18 | 2001 Jun 11 | N3 |
| SDSSP J1750+17 | T3.5 | 17 50 33.0 | 17 59 04 | 16.580.12 | 15.970.16 | 16.0 | 2001 Oct 09 | N3 |
| SDSSP J0926+58 | T4.5 | 09 26 15.4 | 58 47 21 | 15.720.06 | 15.330.09 | 15.440.17 | 2002 Dec 23 | N3 |
| 2MASSW J2254+31 | T5 | 22 54 18.8 | 31 23 49 | 15.280.05 | 15.040.09 | 14.830.14 | 2000 Jul 25 | N1,3,4 |
| 2000 Jul 29 | N6a,6b | |||||||
| 2002 Aug 31 | N2 | |||||||
| 2MASSW J0559-14 | T5 | 05 59 19.1 | -14 04 48 | 13.830.03 | 13.680.04 | 13.610.05 | 2000 Mar 06 | N1,2,3,4,6a,6b |
| 2MASSW J2356-15 | T6 | 23 56 54.7 | -15 53 11 | 15.800.06 | 15.640.10 | 15.830.19 | 1999 Aug 19 | N3,4,6a,6b |
| 2001 Oct 09 | N1 | |||||||
| 2002 Sep 01 | N2 | |||||||
| SDSSP J1624+00 | T6 | 16 24 14.4 | 00 29 15 | 15.490.06 | 15.520.10 | 15.4 | 1999 Jun 02 | N3 |
| 2MASSW J1237+65 | T6.5 | 12 37 39.2 | 65 26 15 | 16.030.09 | 15.720.16 | 15.9 | 2000 Jul 14 | N3 |
| 2MASSW J0727+17 | T7 | 07 27 18.2 | 17 10 01 | 15.550.07 | 15.820.18 | 15.560.21 | 2001 Dec 29 | N3 |
| 2MASSW J1553+15 | T7 | 15 53 02.2 | 15 32 36 | 15.810.08 | 15.920.17 | 15.510.19 | 2001 Jun 11 | N3 |
| Gl 570D | T8 | 14 57 15.0 | -21 21 48 | 15.330.05 | 15.280.09 | 15.270.17 | 2001 Mar 06 | N1,2,3,4,6a |
| 2001 Mar 07 | N6b | |||||||
| 2MASSW J0415-09 | T8 | 04 15 19.5 | -09 35 06 | 15.710.06 | 15.570.12 | 15.450.20 | 2000 Dec 06 | N3 |
| 2001 Mar 07 | N5,6b | |||||||
| 2001 Mar 07 | N6b |
| Spectral Type | Object | |
|---|---|---|
| M6 | Wolf 359 (Gl 406) | 5.395e-12 |
| M8 | VB 10 (LHS 474) | 3.798e-13 |
| M9 | LHS 2065 | 1.179e-13 |
| L0 | 2MASSW J0345+25 | 8.858e-15 |
| L0 | HD 89744B | 3.742e-15 |
| L1 | 2MASSW J1035+25 | 4.590e-15 |
| L1 | 2MASSW J1658+70 | 1.683e-14 |
| L2 | 2MASSW J0015+35 | 9.990e-15 |
| L2 | Kelu-1 | 1.458e-14 |
| L4 | GD 165B | 2.082e-15 |
| L5 | 2MASSW J1507-16 | 2.397e-14 |
| L6 | 2MASSW J0103+19 | 1.030e-15 |
| L6.5 | 2MASSW J2244+20 | 9.239e-16 |
| L7 | DENIS-P J0205-11AB | 4.972e-15 |
| L8 | Gl 337C | 2.018e-15 |
| L8 | Gl 584C | 1.010e-15 |
| L8 | 2MASSW J1632+19 | 1.593e-15 |
| T0 | SDSSP J0423-04 | 5.372e-15 |
| T1 | SDSSP J0837-00 | 6.147e-16 |
| T2 | SDSSP J1254-01 | 3.732e-15 |
| T5 | 2MASSW J2254+31 | 2.422e-15 |
| T5 | 2MASSW J0559-14 | 8.714e-15 |
| T6 | 2MASSW J2356-15 | 1.243e-15 |
| T8 | Gl 570D | 1.325e-15 |
| T8 | 2MASSW J0415-09 | 7.827e-16 |
| Ratio Name | Flux Ratio aaWavelengths in m ; is defined as the median of values located in a 0.004 m window centered about that wavelength. | Defined for |
|---|---|---|
| H2OA | M, L, T | |
| H2OB | M, L, T | |
| H2OC | M, L, T | |
| H2OD | M, L, T | |
| CH4A | T | |
| CH4B | T | |
| CO | M, L | |
| -FeH | M, L | |
| -FeH | M, L, T |
| Spectral Type | Object | H2OA | H2OB | H2OC | H2OD | CH4A | CH4B | -FeH | -FeH | CO |
|---|---|---|---|---|---|---|---|---|---|---|
| M6 | Wolf 359 (Gl 406) | 0.876 | 1.071 | 0.801 | 1.106 | 0.886 | 0.997 | 0.704 | 0.918 | 0.737 |
| M6 | Gl 283B | 0.766 | – | – | – | – | – | – | 0.941 | – |
| M7 | LHS 2351 | 0.777 | – | – | – | – | – | – | 0.894 | – |
| M7 | VB 8 (LHS 429) | 0.753 | – | – | – | – | – | – | 0.901 | – |
| M8 | LP 412-31 | 0.791 | – | – | – | – | – | – | 0.845 | – |
| M8 | VB 10 (LHS 474) | 0.760 | 0.933 | 0.761 | 1.071 | 0.858 | 1.047 | 0.615 | 0.875 | 0.738 |
| M9 | LHS 2065 | 0.754 | 0.907 | 0.757 | 1.034 | 0.935 | 1.069 | – | 0.835 | 0.693 |
| M9 | 2MASSW J1239+20 | 0.751 | – | – | – | – | – | – | 0.901 | – |
| L0 | 2MASSW J0345+25 | 0.680 | 0.858 | 0.714 | 1.017 | 0.932 | 1.071 | 0.492 | 0.817 | 0.690 |
| L0 | HD 89744B | 0.623 | 0.870 | 0.728 | 1.008 | 0.906 | 1.056 | 0.484 | 0.854 | 0.713 |
| L0.5 | 2MASSW J0746+20AB | 0.676 | – | – | – | – | – | – | 0.792 | – |
| L1 | 2MASSW J0208+25 | 0.639 | – | – | – | – | – | – | 0.801 | – |
| L1 | 2MASSW J1035+25 | 0.628 | 0.781 | 0.670 | 0.934 | 0.932 | 1.090 | – | 0.811 | 0.606 |
| L1 | 2MASSW J1300+19 | 0.568 | – | – | – | – | – | – | 0.841 | – |
| L1 | 2MASSW J1439+19 | 0.617 | – | – | – | – | – | – | 0.792 | – |
| L1 | 2MASSW J1658+70 | 0.681 | 0.819 | 0.699 | 0.905 | 0.906 | 1.078 | – | 0.820 | 0.643 |
| L1 | 2MASSW J2130-08 | 0.664 | – | – | – | – | – | – | 0.768 | – |
| L2 | 2MASSW J0015+35 | 0.671 | 0.741 | 0.707 | 0.929 | 0.953 | 1.077 | 0.455 | 0.819 | 0.606 |
| L2 | Kelu-1 | 0.608 | 0.743 | 0.665 | 0.909 | 0.938 | 1.089 | – | 0.864 | 0.682 |
| L2 | 2MASSW J1726+15 | 0.614 | – | – | – | – | – | – | 0.871 | – |
| L3 | 2MASSW J1506+13 | 0.571 | – | – | – | – | – | – | 0.790 | – |
| L3 | 2MASSW J1615+35 | 0.605 | – | – | – | – | – | – | 0.797 | – |
| L3.5 | 2MASSW J0036+18 | 0.595 | – | – | – | – | – | – | 0.757 | – |
| L4 | GD 165B | 0.541 | 0.676 | 0.647 | 0.823 | 0.973 | 1.071 | 0.426 | 0.781 | 0.610 |
| L4 | 2MASSI J2158-15 | 0.519 | – | – | – | – | – | – | 0.801 | – |
| L5 | DENIS-P J1228-15AB | 0.484 | – | – | – | – | – | – | 0.827 | – |
| L5 | 2MASSW J1507-16 | 0.504 | 0.580 | 0.586 | 0.714 | 0.899 | 1.023 | – | 0.805 | 0.673 |
| L6 | 2MASSW J0103+19 | 0.529 | 0.584 | 0.678 | 0.738 | 0.970 | 1.027 | 0.693 | 0.964 | 0.683 |
| L6 | 2MASSW J0850+10AB | 0.467 | – | – | – | – | – | – | 0.964 | – |
| L6.5 | 2MASSW J2244+20 | 0.558 | 0.564 | 0.712 | 0.730 | 0.988 | 1.032 | – | 1.084 | 0.743 |
| L7 | DENIS-P J0205-11AB | 0.399 | 0.514 | 0.515 | 0.656 | 0.833 | 0.936 | 0.668 | 0.937 | 0.772 |
| L7 | 2MASSW J1728+39AB | 0.540 | – | – | – | – | – | – | 0.973 | – |
| L8 | 2MASSW J0310+16 | 0.394 | – | – | – | – | – | – | 1.100 | – |
| L8 | 2MASSI J0328+23 | 0.389 | – | – | – | – | – | – | 1.047 | – |
| L8 | Gl 337C | 0.400 | 0.520 | 0.526 | 0.619 | 0.804 | 0.852 | 0.788 | 1.014 | 0.734 |
| L8 | Gl 584C | 0.434 | 0.537 | 0.552 | 0.618 | 0.840 | 0.922 | – | 1.055 | 0.858 |
| L8 | 2MASSW J1632+19 | 0.467 | 0.533 | 0.612 | 0.632 | 0.887 | 0.927 | 0.846 | 1.054 | 0.708 |
| T0 | SDSSP J0423-04 | 0.335 | 0.435 | 0.518 | 0.641 | 0.779 | 0.868 | 0.700 | 1.020 | 0.737 |
| T1 | SDSSP J0151+12 | 0.311 | – | – | – | – | – | – | 1.093 | – |
| T1 | SDSSP J0837-00 | 0.266 | 0.375 | 0.417 | 0.586 | 0.716 | 0.760 | – | 1.075 | 0.800 |
| T2 | SDSSP J1254-01 | 0.196 | 0.284 | 0.369 | 0.516 | 0.624 | 0.636 | 0.844 | 1.202 | 0.773 |
| T3 | SDSSP J1021-03 | 0.155 | – | – | – | – | – | – | 1.176 | – |
| T3.5 | SDSSP J1750+17 | 0.127 | – | – | – | – | – | – | 1.143 | – |
| T4.5 | SDSSP J0926+58 | 0.081 | – | – | – | – | – | – | 1.257 | – |
| T5 | 2MASSW J2254+31 | 0.096 | 0.230 | 0.312 | 0.412 | 0.415 | 0.315 | 0.647 | 1.219 | – |
| T5 | 2MASSW J0559-14 | 0.092 | 0.188 | 0.346 | 0.407 | 0.378 | 0.269 | 0.676 | 1.218 | – |
| T6 | 2MASSW J2356-15 | 0.076 | 0.160 | 0.323 | 0.359 | 0.280 | 0.207 | 0.724 | 1.333 | – |
| T6 | SDSSP J1624+00 | 0.050 | – | – | – | – | – | – | 1.494 | – |
| T6.5 | 2MASSW J1237+65 | 0.031 | – | – | – | – | – | – | 1.772 | – |
| T7 | 2MASSW J0727+17 | 0.035 | – | – | – | – | – | – | 1.798 | – |
| T7 | 2MASSW J1553+15 | 0.035 | – | – | – | – | – | – | 1.871 | – |
| T8 | Gl 570D | 0.018 | 0.079 | 0.256 | 0.215 | 0.119 | 0.061 | 1.132 | 2.231 | – |
| T8 | 2MASSW J0415-09 | 0.021 | – | – | 0.240 | 0.097 | 0.089 | – | 1.931 | – |
| Ratio Name | Data Points | Slope | Intercept | R2 | Stand. Dev. | Range |
|---|---|---|---|---|---|---|
| H20A | 53 | -0.0382 | 1.073 | 0.973 | 1.1 | M, L, T |
| H20B | 24 | -0.0436 | 1.288 | 0.991 | 0.6 | M, L, T |
| H20C | 24 | -0.0254 | 0.989 | 0.914 | 1.8 | M, L, T |
| H20D | 25 | -0.0399 | 1.377 | 0.983 | 0.8 | M, L, T |
| CH4A | 25 | -0.0846 | 2.489 | 0.994 | 0.2 | T |
| CH4B | 25 | -0.1006 | 2.853 | 0.984 | 0.4 | T |
| Sp. Type | Object | K I 1.168m | K I 1.177m | K I 1.243m | K I 1.254m |
|---|---|---|---|---|---|
| M6 | Wolf 359 (Gl 406) | 3.2 0.2 | 4.9 0.2 | 3.5 0.2 | 3.2 0.2 |
| M6 | Gl 283B | 3.1 0.2 | 4.9 0.2 | 3.3 0.1 | 3.0 0.1 |
| M7 | LHS 2351 | 3.4 0.2 | 5.3 0.2 | 4.3 0.2 | 3.6 0.2 |
| M7 | VB 8 (LHS 429) | 4.4 0.2 | 6.4 0.2 | 4.6 0.2 | 4.6 0.1 |
| M8 | LP 412-31 | 4.9 0.4 | 7.2 0.2 | 5.5 0.3 | 5.2 0.2 |
| M8 | VB 10 (LHS 474) | 4.5 0.3 | 7.1 0.2 | 5.1 0.2 | 4.6 0.2 |
| M9 | LHS 2065 | 5.6 0.5 | 7.7 0.3 | 6.1 0.3 | 5.2 0.3 |
| M9 | 2MASSW J1239+20 | 4.6 0.4 | 7.9 0.6 | 5.9 0.3 | 5.2 0.4 |
| L0 | 2MASSW J0345+25 | 6.2 0.5 | 8.6 0.3 | 6.9 0.4 | 6.4 0.3 |
| L0 | HD 89744B | 6.6 0.4 | 9.0 0.5 | 6.8 0.3 | 6.1 0.4 |
| L0.5 | 2MASSW J0746+20AB | 7.0 0.6 | 9.5 0.4 | 7.6 0.5 | 6.9 0.4 |
| L1 | 2MASSW J0208+25 | 6.6 0.7 | 9.4 0.4 | 7.3 0.4 | 6.5 0.4 |
| L1 | 2MASSW J1035+25 | 7.6 0.4 | 9.3 0.2 | 6.8 0.4 | 6.6 0.4 |
| L1 | 2MASSW J1300+19 | 9.1 0.4 | 12.3 0.5 | 8.2 0.5 | 8.8 0.4 |
| L1 | 2MASSW J1439+19 | 7.6 0.5 | 10.1 0.3 | 7.6 0.2 | 7.7 0.4 |
| L1 | 2MASSW J1658+70 | 5.8 0.4 | 9.6 0.3 | 7.3 0.3 | 6.6 0.4 |
| L1 | 2MASSW J2130-08 | 7.6 0.5 | 10.2 0.3 | 7.7 0.3 | 7.4 0.5 |
| L2 | 2MASSW J0015+35 | 7.0 0.4 | 9.7 0.2 | 7.1 0.3 | 6.6 0.5 |
| L2 | Kelu-1 | 3.7 0.9 | 9.0 0.7 | 6.9 0.4 | 6.8 0.4 |
| L2 | 2MASSW J1726+15 | 5.3 0.5 | 6.5 0.3 | 6.7 0.4 | 4.8 0.3 |
| L3 | 2MASSW J1506+13 | 8.2 0.8 | 10.6 0.5 | 8.4 0.40 | 8.9 0.7 |
| L3 | 2MASSW J1615+35 | 8.4 0.7 | 10.8 0.5 | 8.3 0.50 | 7.8 0.6 |
| L3.5 | 2MASSW J0036+18 | 9.2 0.4 | 12.5 0.4 | 8.5 0.5 | 9.3 0.5 |
| L4 | GD 165B | 8.3 0.7 | 11.0 0.6 | 7.3 0.6 | 7.9 0.6 |
| L4 | 2MASSI J2158-15 | 8.1 1.1 | 9.6 0.5 | 7.5 0.5 | 7.5 0.4 |
| L5 | DENIS-P J1228-15AB | 8.9 0.5 | 11.2 0.7 | 7.2 0.6 | 7.3 0.4 |
| L5 | 2MASSW J1507-16 | 8.8 0.7 | 12.1 0.4 | 7.0 0.5 | 8.2 0.5 |
| L6 | 2MASSW J0103+19 | 5.8 0.3 | 6.2 0.4 | 4.3 0.3 | 5.3 0.4 |
| L6 | 2MASSW J0850+10AB | 6.5 0.4 | 9.2 0.5 | 4.2 0.4 | 5.4 0.4 |
| L6.5 | 2MASSW J2244+20 | 3.8 0.4 | 5.0 0.4 | 1.8 0.1 | 2.3 0.2 |
| L7 | DENIS-P J0205-11AB | 6.5 0.6 | 9.4 0.4 | 4.3 0.3 | 6.0 0.4 |
| L7 | 2MASSW J1728+39AB | 6.7 0.7 | 9.5 0.4 | 5.6 0.3 | 7.1 0.5 |
| L8 | 2MASSW J0310+16 | 5.9 0.6 | 8.0 0.5 | 3.9 0.1 | 5.3 0.1 |
| L8 | 2MASSW J0328+23 | 7.0 0.7 | 9.5 1.0 | 3.3 0.5 | 5.3 0.5 |
| L8 | Gl 337C | 5.8 0.3 | 8.0 0.3 | 3.2 0.3 | 4.8 0.3 |
| L8 | Gl 584C | 7.0 0.8 | 8.5 0.8 | 3.2 0.2 | 5.6 0.5 |
| L8 | 2MASSW J1632+19 | 4.7 0.3 | 6.3 0.4 | 3.0 0.1 | 3.5 0.2 |
| T0 | SDSSP J0423-04 | 6.8 0.7 | 9.5 0.5 | 4.4 0.2 | 6.2 0.2 |
| T1 | SDSSP J0151+12 | 6.1 0.6 | 9.6 0.9 | –bbErroneous data point - Spike near line center | 6.0 0.3 |
| T1 | SDSSP J0837-00 | 7.4 0.7 | 11.5 0.8 | 4.7 0.2 | 7.7 0.2 |
| T2 | SDSSP J1254-01 | 8.2 1.1 | 10.0 0.9 | 4.7 0.2 | 7.7 0.4 |
| T3 | SDSSP J1021-03 | 6.1 0.7 | –bbErroneous data point - Spike near line center | 4.9 0.3 | 7.7 0.3 |
| T3.5 | SDSSP J1750+17 | 10.2 0.7 | 12.4 1.1 | 4.7 0.3 | 8.2 0.5 |
| T4.5 | SDSSP J0926+58 | 9.6 1.4 | 11.3 1.1 | 5.1 0.4 | 8.4 0.8 |
| T5 | 2MASSW J2254+31 | 9.5 0.8 | 12.0 0.9 | 5.1 0.3 | 7.7 0.8 |
| T5 | 2MASSW J0559-14 | 10.0 1.0 | 12.5 1.1 | 4.9 0.4 | 8.7 0.5 |
| T6 | 2MASSW J2356-15 | 9.3 1.9 | 12.5 1.2 | 5.5 0.6 | 9.0 0.5 |
| T6 | SDSSP J1624+00 | 5.5 1.4 | 5.7 1.5 | 1.4 0.8 | 5.1 0.8 |
| T6.5 | 2MASSW J1237+65 | 7.6 2.6 | 10.3 2.0 | 0.2 0.6 | 2.0 0.8 |
| T7 | 2MASSW J0727+17 | 5.3 2.3 | 7.1 1.3 | 2.3 0.4 | 5.2 0.7 |
| T7 | 2MASSW J1553+15 | 4.9 3.4 | 7.0 2.8 | 2.2 0.7 | 4.8 0.7 |
| T8 | Gl 570D | –aaNo detectable K I line | 3.6 1.3 | 1.7 0.6 | 2.6 0.8 |
| T8 | 2MASSW J0415-09 | –aaNo detectable K I line | 6.2 1.3 | 1.0 0.7 | 1.8 0.9 |
| Spectral Type | Object | Na I 1.140m | Fe I 1.189m | Al I 1.314m | Na I 2.208m |
|---|---|---|---|---|---|
| M6 | Wolf 359 (Gl 406) | 11.8 0.4 | 0.8 0.2 | 2.2 0.3 | 3.70.3 |
| M6 | Gl 283B | 0.6 0.2 | 2.5 0.2 | ||
| M7 | LHS 2351 | 1.1 0.2 | 1.9 0.2 | ||
| M7 | VB 8 (LHS 429) | 0.6 0.2 | 1.9 0.2 | ||
| M8 | LP 412-31 | 1.2 0.3 | 2.1 0.3 | ||
| M8 | VB 10 (LHS 474) | 13.0 0.7 | 0.9 0.2 | 1.9 0.3 | 2.30.4 |
| M9 | LHS 2065 | 0.9 0.4 | 2.2 0.4 | 3.80.5 | |
| M9 | 2MASSW J1239+20 | 1.2 0.4 | 2.6 0.3 | ||
| L0 | 2MASSW J0345+25 | 12.3 0.8 | 0.8 0.2 | 1.4 0.5 | 1.30.4 |
| L0 | HD 89744B | 13.5 0.9 | 0.8 0.4 | 1.8 1.0 | 1.70.4 |
| L0.5 | 2MASSW J0746+20AB | 0.8 0.3 | 1.3 0.5 | ||
| L1 | 2MASSW J0208+25 | 0.9 0.4 | 1.5 0.5 | ||
| L1 | 2MASSW J1035+25 | 0.5 0.5 | 1.1 0.5 | 1.10.8 | |
| L1 | 2MASSW J1300+19 | 0.8 0.4 | 1.7 0.6 | ||
| L1 | 2MASSW J1439+19 | 0.8 0.5 | 0.9 0.7 | ||
| L1 | 2MASSW J1658+70 | 0.9 0.4 | 1.9 0.6 | 3.00.6 | |
| L1 | 2MASSW J2130-08 | 0.6 0.6 | 1.5 0.4 | ||
| L2 | 2MASSW J0015+35 | 13.3 1.1 | 0.6 0.4 | 0.9 0.5 | 1.50.5 |
| L2 | Kelu-1 | 0.8 0.6 | 0.7 0.6 | 0.10.9 | |
| L2 | 2MASSW J1726+15 | 0.4 0.3 | 0.8 0.4 | ||
| L3 | 2MASSW J1506+13 | 0.4 0.2 | 0.7 0.5 | ||
| L3 | 2MASSW J1615+35 | 0.9 0.6 | 1.9 0.4 | ||
| L3.5 | 2MASSW J0036+18 | 0.6 0.4 | 0.7 0.4 | ||
| L4 | GD 165B | 14.5 0.7 | 0.6 0.5 | 0.7 0.5 | -0.10.3 |
| L4 | 2MASSI J2158-15 | 0.8 0.3 | 0.5 0.5 | ||
| L5 | DENIS-P J1228-15AB | 0.8 0.5 | 0.1 0.6 | ||
| L5 | 2MASSW J1507-16 | 0.4 0.4 | -0.1 0.4 | -0.10.6 | |
| L6 | 2MASSW J0103+19 | 7.1 1.7 | 0.3 0.1 | -0.2 0.3 | 0.00.4 |
| L6 | 2MASSW J0850+10AB | 0.3 0.1 | 0.4 0.4 | ||
| L6.5 | 2MASSW J2244+20 | -0.2 0.3 | –aaNo detectable line | -0.10.5 | |
| L7 | DENIS-P J0205-11AB | 7.9 1.1 | 0.1 0.2 | 0.6 0.3 | 0.70.3 |
| L7 | 2MASSW J1728+39AB | -0.1 0.1 | 0.4 0.2 | ||
| L8 | 2MASSW J0310+16 | 0.1 0.4 | –aaNo detectable line | ||
| L8 | 2MASSW J0328+23 | -0.5 0.6 | 0.7 0.5 | ||
| L8 | Gl 337C | -0.2 0.1 | 0.5 0.2 | 0.80.1 | |
| L8 | Gl 584C | -0.3 0.4 | 0.2 0.2 | 0.50.3 | |
| L8 | 2MASSW J1632+19 | 5.5 0.8 | 0.3 0.2 | 0.7 0.2 | 0.20.2 |