Cooling in Coronal Gas in the M82 Starburst Superwind11affiliation: Based on observations made with the NASA-CNES-CSA Far Ultraviolet Spectroscopic Explorer. FUSE is operated for NASA by the Johns Hopkins University under NASA contract NAS5-32985.
Abstract
We have used the Far Ultraviolet Spectroscopic Explorer to search for O VI emission at four locations in the starburst superwind of M82. No O VI emission was detected at any of the four pointings, with upper limits less than or equal to the 0.32 keV X-ray flux. These observations limit the energy lost through radiative cooling of coronal phase ( K) gas to roughly the same magnitude as that lost in the hot phase through X-ray emission, which has been shown to be small. The wind material retains most of its energy and should be able to escape from the gravitational potential of M82, enriching the intergalactic medium with energy and metals. The lack of coronal gas in the wind and observations of spatially correlated X-ray and H emission are consistent with a scenario in which the hot wind material over-runs cold clouds in the halo, or one where the H and X-ray emission arise at the interface between the hot wind and a cool shell of swept-up ISM, as long as the shock velocity is km s-1. The observed limits on the O VI/H and C III/H flux ratios rule out shock heating as the source of the K gas unless the shock velocity is km s-1.
Subject headings:
Galaxies: individual (M82) — galaxies: starburst — galaxies: halos — galaxies: ISM1. Introduction
A common product of starbursts in galaxies is a galactic-scale outflow of gas and energy from the starburst region, called a starburst superwind (Heckman, Armus, & Miley 1990; Strickland & Stevens 2000). A superwind begins as an expanding bubble of hot gas powered by the combined energy of stellar winds and supernovae. This bubble may break out of the disk, resulting in a wind of hot ( K), low-density gas flowing into the halo (Chevalier & Clegg, 1985). As this hot gas collides with cold ambient material in the halo, intermediate temperature gas ( K) is formed at the interface. This gas emits X-rays, and if it cools through K it will produce O VI line emission.
The question of whether superwinds are able to overcome the gravitational potential of their host galaxies is critical for determining their full impact on the evolution of galaxies and the intergalactic medium (IGM). If the wind does escape, the wind material will be deposited into the IGM, enriching it with energy and metals (e.g., Aguirre et al. 2001), and it may produce the observed mass-metallicity relationship in galaxies if winds are preferentially able to escape from low mass systems (Martin, 1999; Heckman et al., 2000). A comparison of wind velocities with escape velocities suggests that winds can readily escape from dwarf galaxies, while winds of larger galaxies cannot (Heckman et al., 2000). However, wind velocities have only been measured relatively close to the starburst region, so it is still unclear whether energy loss further downstream keeps the material bound to the galaxy. Observations and models imply that radiative cooling through X-ray emission from hot gas is not effective at removing kinetic energy from superwinds (Strickland & Stevens, 2000). However, coronal temperature gas at K cools very quickly and efficiently (Sutherland & Dopita, 1993), so energy lost through this phase may be enough to prevent winds from escaping.
The O VI doublet at 1031.926, 1037.617 Å is the most important coolant for coronal gas (Edgar & Chevalier, 1986), making O VI emission an excellent measure of the energy lost in the coronal phase. This wavelength range is inaccessible from ground-based telescopes, and opportunities to observe it from space have been limited. This has changed with the launch of Far Ultraviolet Spectroscopic Explorer (; Moos et al. 2000). We have used to search for O VI emission in the halo of M82, the prototypical starburst superwind galaxy.
2. Observations and Data Reduction
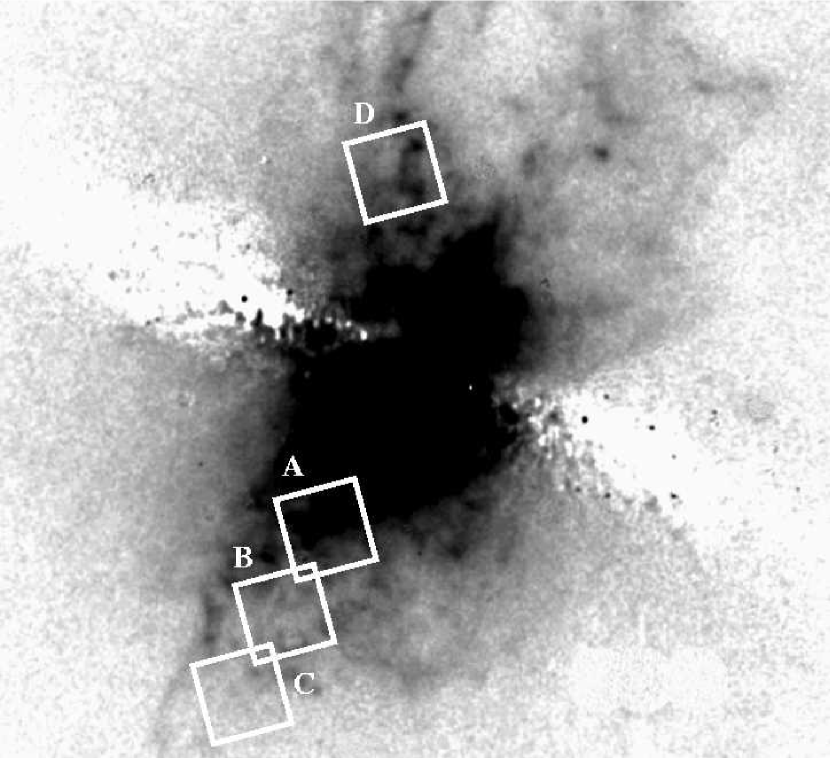
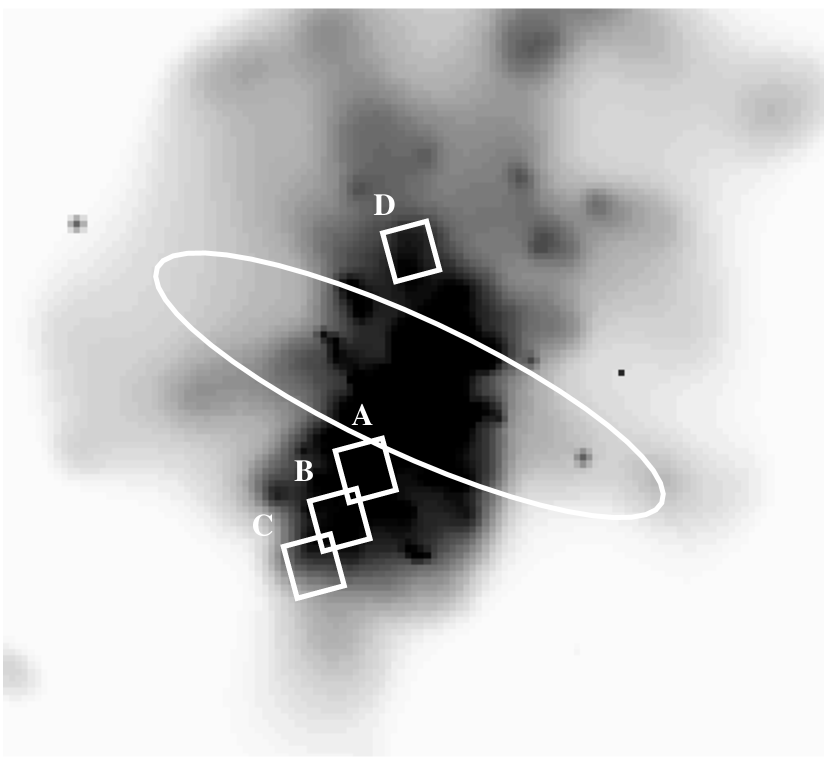
We obtained spectra at four positions in the halo of M82 on 2002 February 3. The coordinates and exposure times are listed in Table 1, and the positions of the pointings can be seen in Figure 1. The large (LWRS: ′′′′) apertures were used. consists of four separate telescopes, two with LiF coated optics for optimal sensitivity to longer wavelengths (1000 to 1180 Å) and two with SiC coated optics for optimal sensitivity to shorter wavelengths (900 to 1000 Å). These are usually referred to as the LiF1, LiF2, SiC1, and SiC2 channels. Of these, the LiF channels have the largest effective area at 1032 Å.
The raw photon event lists were screened to remove data taken while the satellite was in the South Atlantic Anomaly, and to remove events with pulse height amplitudes less than 4 and greater than 15, because these are predominantly background events. This photon list was then transformed to a 2-dimensional image from which we extracted the spectrum, using bright airglow lines to determine its location on the detector. The extracted spectra from the individual exposures were co-added to produce the final spectrum for each pointing. The wavelength solution from the CALFUSE pipeline (v2.0.5) was applied to the data, but we kept the data in units of counts. The individual channels were not co-added.
| Pointing | R.A. | Decl. | Exposure Time |
|---|---|---|---|
| (J2000.0) | (J2000.0) | (s) | |
| A | 9 55 57.1 | 69 39 49.5 | 8056 |
| B | 9 55 60.0 | 69 39 17.1 | 8768 |
| C | 9 56 03.1 | 69 38 48.0 | 11529 |
| D | 9 55 52.3 | 69 42 54.5 | 10011 |
3. Limits on O VI Emission
No O VI or emission was evident in any of the spectra. We also searched for C III emission in the SiC channels, finding none. We base our O VI limits on the 1031.926 Å line because it is the strongest of the O VI doublet. The background flux level was determined by taking the mean of the flux measured in ten 0.34 Å bins near 1032 Å. The noise in the background is the primary source of uncertainty in the O VI measurement, so the square root of the background flux corresponds to the uncertainty, from which we derive O VI detection limits of the FUSE spectra.
The choice of 0.34 Å bins for computing the sensitivity corresponds to the filled aperture resolution for the LWRS aperture, and also matches the expected velocity range of O VI emission based on absorption observations of NGC 1705 (Heckman et al., 2001). However, Shopbell & Bland-Hawthorn (1998) found that the H emission is spread over km s-1 in the M82 outflow, which would correspond to an emission FWHM of 1 Å at 1032 Å. Using this bin size would increase the observed O VI upper limits by a factor of 1.7. We adopt the former value (FWHM km s-1) since it is based on an O VI measurement, but the difference is not enough to change our conclusions.
These limits were converted from counts to flux using the effective area of the LiF1 channel at 1032 Å and the exposure time. The observed limit was corrected for Galactic extinction of AV=0.10 (Burstein & Heiles, 1984) and extinction intrinsic to the M82 superwind A (Heckman et al., 1990). We also estimated the extinction by modeling the photoelectric absorption in Chandra keV X-ray data (Strickland et al., 2003), and found agreement with the extinction derived from the Balmer decrement by Heckman et al. (1990). The X-ray opacity is dependent upon dust grains and the gas-phase metal column, so it is directly related to the ISM constituents responsible for the far-ultraviolet extinction. We corrected the internal extinction three different ways: using the Galactic extinction law (Cardelli, Clayton, & Mathis, 1989), the LMC extinction law (Howarth, 1983), and the starburst extinction law (Calzetti, Kinney, & Storchi-Bergmann, 1994). The LMC law produces more far-ultraviolet extinction than the Galactic law, while the starburst law produces much less. We adopt the Galactic extinction law as the intermediate case, although using any of the three laws would not alter our main conclusions. The extinction-corrected limits are listed in Table 2. Figure 2 shows the observed spectrum of position A (see Figure 1), along with a model of the expected O VI emission (if it were equal to the X-ray flux).
| Pointing | F1032 LimitbbCorrected for extinction, assuming a Galactic extinction of AV=0.10 magnitudes, and an M82 extinction of AV=0.85 (Heckman et al. 1990), and using the Galactic extinction law (Cardelli et al. 1989), which gives (assuming =3.1). The LMC extinction law (Howarth 1983) gives , which would result in upper limits greater, and the starburst extinction law (Calzetti et al. 1994) gives (normalized to match the Galactic law at 5500Å), which would result in upper limits lower. | Fcoronal LimitccTotal energy radiated by the coronal gas, corrected for extinction. | Fcoronal/FX-rayddThe absorption corrected X-ray flux (0.3-2.0 keV) within the LWRS aperture was measured on Chandra ACIS-S spectra (Strickland et al. 2003). | F LimitbbCorrected for extinction, assuming a Galactic extinction of AV=0.10 magnitudes, and an M82 extinction of AV=0.85 (Heckman et al. 1990), and using the Galactic extinction law (Cardelli et al. 1989), which gives (assuming =3.1). The LMC extinction law (Howarth 1983) gives , which would result in upper limits greater, and the starburst extinction law (Calzetti et al. 1994) gives (normalized to match the Galactic law at 5500Å), which would result in upper limits lower. | F/FHαeeThe extinction corrected H flux was measured in the LWRS aperture using the image shown in Figure 1. | F/FHαeeThe extinction corrected H flux was measured in the LWRS aperture using the image shown in Figure 1. |
|---|---|---|---|---|---|---|
| (erg cm-2 s-1) | (erg cm-2 s-1) | (erg cm-2 s-1) | ||||
| A | ||||||
| B | ||||||
| C | ||||||
| D |
Position D is on the North side of the M82 outflow, and since the sight line passes through the disk of M82 it is likely subject to higher extinction. The optical spectrum of Heckman et al. (1990) did not reach this far into the halo, so we have no measure of the extinction in this region. The most reliable limits come from positions A, B, and C, which are on the southwest (near) side of the outflow and do not pass through the M82 disk.
The velocity of M82 ( km s-1, de Vaucouleurs et al. 1991) shifts the O VI emission to 1032.624 Å. The only Galactic absorption nearby is the R(4) line of H2 at 1032.351 Å. An examination of sight lines near M82 ( away) observed by suggests that H2 in the rotational level is present in this direction. This line is km s-1 from the expected center of the O VI line, so the contamination is expected to be minimal even if the lines are broad. The M82 C III line falls at 977.681 Å, which is in a region free of Galactic absorption, but is 85 km s-1 from an atmospheric O I emission line at 977.959 Å (Feldman et al., 2001).
In the optically thin case, the energy radiated through the two O VI lines is 150% of the 1032 Å line strenth. The two O VI lines together are responsible for % of the cooling in coronal gas (Heckman et al., 2001). The limit on the total energy radiated by coronal gas is thus a factor of 5 higher than the limit on 1032 Å flux (see Table 2). These limits are comparable to the observed X-ray flux at each position, ranging from 40% to 260% in positions A, B, and C. Strickland & Stevens (2000) found that the energy lost through X-ray emission in M82 is % of the energy input from the starburst. If the lowest upper limit on O VI is valid everywhere in the wind, then the amount of energy radiated away by the coronal gas is even smaller than that lost through X-rays.
4. Discussion
4.1. Radiative Cooling in the Superwind
The non-detection of O VI emission has profound implications for the evolution of the starburst superwind in M82. The lack of O VI emission indicates that radiative cooling from coronal gas does not effectively remove energy from the wind. Energy loss through other phases has been determined to be insignificant as well (Strickland & Stevens, 2000), so the wind must retain most of its kinetic/thermal energy as it travels through the halo. The wind velocity comfortably exceeds the escape velocity, so the wind should easily escape from the galaxy.
Otte et al. (2003) detected O VI emission in the halo of NGC 4631 at the locations of strong X-ray emission. NGC 4631 is actively forming stars but is not a starburst and has weaker X-ray emission overall than M82. Nevertheless, the O VI/X-ray ratios were , similar to our limits in M82, suggesting that radiative cooling of coronal gas is ineffective in the hot halo of NGC 4631, a conclusion we also reach for the M82 superwind. Heckman et al. (2001) measured O VI absorption and set upper bounds on the O VI emission in the starburst NGC 1705, and were able to limit the cooling rate to % of the supernova heating rate in that galaxy. Since the X-ray luminosity of NGC 1705 is very low, the NGC 1705 superwind should also escape into the IGM. If these results hold for many starbursts, they could be an important source of energy and metals for the IGM.
4.2. Origin of O VI, H, and X-rays

Strickland et al. (2002) found significant spatial correlation between H and X-ray emission in the starburst superwind of NGC 253, and a similar correlation is seen in the M82 superwind (Lehnert et al., 1999; Strickland et al., 2003). This fact strongly suggests a physical connection between the origin of both types of emission. Models of superwinds must account for this correlation, and Strickland et al. (2002) outline several possibilities. The pointings were chosen because they exhibit strong X-ray emission and H emission, suggesting the presence of warm and hot gas (see Figure 1).
It is unlikely that both the X-ray and H emission arise in cooling wind material. Strickland et al. (2002) showed that the cooling times are too long, and the non-detection of O VI emission indicates that significant amounts of gas do not cool through K. Another possibility is that the H emission arises in a cool shell of swept up ISM surrounding the superwind (e.g. Weaver et al. 1977). If the shock velocity km s-1 the interface between the hot wind fluid and the cool shell material would contain coronal gas, and Strickland et al. (2002) showed that the luminosity of the O VI doublet would be times greater than the X-ray luminosity. This is clearly at odds with the observed O VI upper limits, but we cannot rule out a lower . We also cannot rule out a hot shell of swept-up ISM which would not produce coronal gas due to long cooling times, but this scenario has difficulty reproducing the spatial correlation between the X-ray and H emission (Strickland et al., 2002).
Lehnert et al. (1999) discuss a model in which the wind runs into cool clouds in the halo, either pre-existing or entrained within the wind itself (see also Strickland et al. 2002). The X-ray emission is produced in a stand-off bow shock upstream from a cloud, while the H is produced by a slow shock driven into the cloud by the wind (with a possible contribution from photoionization). The X-ray and H emission in this scenario are physically correlated, but little coronal temperature gas is produced, consistent with our non-detection of O VI emission.

Comparing the O VI and C III limits with the H flux can also constrain the conditions in the superwind. If a turbulent mixing layer between hot and cold gas forms in the wind, the intermediate temperature gas produced must be cooler than K, or F/FHα would be higher than the observed limits in Table 2 (Slavin, Shull, & Begelman, 1993). Figure 3 shows the predictions of shock models for the O VI/ H and C III/ H flux ratios (Shull & McKee, 1979; Dopita & Sutherland, 1996), compared to the observed upper limits on the ratios at position A. The upper limits shown were calculated assuming a line width (FWHM) corresponding to the shock velocity, so the limits are higher for broader lines. The limits for all four pointings are listed in Table 2, assuming the line width is 100 km s-1. The F/FHα upper limit is lower than the prediction for shocks with km s-1, and the F/FHα ratio is lower than the prediction for shocks with km s-1, assuming all of the H emission arises in shock-heated gas (very fast shocks are allowed by the F/FHα upper limit, but this is ruled out by the F/FHα upper limit). If the model of Lehnert et al. (1999) is correct, the slow shocks in the cold clouds that produce H emission have km s-1, or the ionization of the cold clouds is dominated by photoionization from the starburst. CLOUDY models (Ferland et al., 1998) show that the F/FHα limit is consistent with photoionization (this will be discussed further in a future paper, C. Hoopes et al., in preparation). If the clouds are photoionized, this means that the energy source powering the H emission is not the wind, so even the optical emission does not represent energy lost from the wind fluid. This scenario raises the possibility that the wind blown cavity provides a conduit for ionizing photons from the starburst to reach the IGM.
References
- Aguirre et al. (2001) Aguirre, A., Hernquist, L., Schaye, J., Katz, N., Weinberg, D. H., & Gardner, J. 2001, ApJ,561, 521
- Burstein & Heiles (1984) Burstein, D. & Heiles, C. 1984, ApJS, 54, 33
- Calzetti, Kinney, & Storchi-Bergmann (1994) Calzetti, D., Kinney, A. L., & Storchi-Bergmann, T. 1994, ApJ, 429, 582
- Cardelli, Clayton, & Mathis (1989) Cardelli, J. A., Clayton, G. C., & Mathis, J. S. 1989, ApJ, 345, 245
- Cheng, et al. (1996) Cheng, K. -P., et al. 1996 “Ground-Based Imaging in Support of UIT,” Volume 1, CD-ROM
- Chevalier & Clegg (1985) Chevalier, R. A. & Clegg, A. W. 1985, Nature, 317, 44
- de Vaucouleurs et al. (1991) de Vaucouleurs G., de Vaucouleurs, A., Corwin, Jr., H., Buta, R., Paturel, F., & Fouqué, P. 1991, Third Reference Catalogue of Bright Galaxies (RC3)
- Dopita & Sutherland (1996) Dopita, M. A. & Sutherland, R. S. 1996, ApJS, 102, 161
- Edgar & Chevalier (1986) Edgar, R. J. & Chevalier, R. A. 1986, ApJ, 310, L27
- Feldman et al. (2001) Feldman, P. D., Sahnow, D. J., Kruk, J. W., Murphy, E. M., & Moos, H. W. 2001, J. Geophys. Res., 106, 8119
- Ferland et al. (1998) Ferland, G. J., Korista, K. T., Verner, D. A., Ferguson, J. W., Kingdon, J. B., & Verner, E. M. 1998, PASP, 110, 761
- Heckman et al. (1990) Heckman, T. M., Armus, L., & Miley, G. K. 1990, ApJS, 74, 833
- Heckman et al. (2000) Heckman, T. M., Lehnert, M. D., Strickland, D. K., & Armus, L. 2000, ApJS, 129, 493
- Heckman et al. (2001) Heckman, T. M., Sembach, K. R., Meurer, G. R., Strickland, D. K., Martin, C. L., Calzetti, D., & Leitherer, C. 2001, ApJ, 554, 1021
- Howarth (1983) Howarth, I. D. 1983, MNRAS, 203, 301
- Lehnert et al. (1999) Lehnert, M. D., Heckman, T. M., & Weaver, K. A. 1999, ApJ, 523, 575
- Martin (1999) Martin, C. L. 1999, ApJ, 513, 156
- Moos et al. (2000) Moos, H. W., et al. 2000, ApJ, 538, L1
- Otte et al. (2003) Otte, B., Murphy, E. M., Howk, J. C., Wang, Q. D., Oegerle, W. R., & Sembach, K. R. 2003, ApJ, 591, 821
- Shopbell & Bland-Hawthorn (1998) Shopbell, P. L. & Bland-Hawthorn, J. 1998, ApJ, 493, 129
- Shull & McKee (1979) Shull, J. M. & McKee, C. F. 1979, ApJ, 227, 131
- Slavin, Shull, & Begelman (1993) Slavin, J. D., Shull, J. M., & Begelman, M. C. 1993, ApJ, 407, 83
- Strickland & Stevens (2000) Strickland, D. K. & Stevens, I. R. 2000, MNRAS, 314, 511
- Strickland et al. (2002) Strickland, D. K., Heckman, T. M., Weaver, K. A., Hoopes, C. G., & Dahlem, M. 2002, ApJ, 568, 689
- Strickland et al. (2003) Strickland, D. K., Heckman, T. M., Colbert, E. J. M., Hoopes, C. G., & Weaver, K. A., 2003, ApJ, submitted (astro-ph/0306592)
- Sutherland & Dopita (1993) Sutherland, R. S. & Dopita, M. A. 1993, ApJS, 88, 253
- Weaver et al. (1977) Weaver, R., McCray, R., Castor, J., Shapiro, P., & Moore, R. 1977, ApJ, 218, 377