2Observatoire de Paris-Meudon, DAEC, Meudon, France
Universal spectral shape of high accretion rate AGN
The spectra of quasars and NLS1 galaxies show surprising similarity in their spectral shape. They seem to scale only with the accretion rate. This is in contradiction with the simple expectations from the standard disk model which predicts lower disk temperature for higher black hole mass. Here we consider two mechanisms modifying the disk spectrum: the irradiation of the outer disk due to the scattering of the flux by the extended ionized medium (warm absorber) and the development of the warm Comptonizing disk skin under the effect of the radiation pressure instability. Those two mechanisms seem to lead to a spectrum which indeed roughly scales, as observed, only with the accretion rate. The scenario applies only to objects with relatively high luminosity to the Eddington luminosity ratio for which disk evaporation is inefficient.
Key Words.:
Radiative transfer, Accretion disks, Galaxies:active, Galaxies:Seyfert, X-rays:galaxies1 Introduction
The idea of the universal spectral shape of AGN appears in the literature since many years. The first paper devoted to fitting accretion disk models to the observed optical/UV spectra stressed that the maximum disk temperature was always about 20 000 K (Malkan & Sargent 1982). The stream of data from the X-ray band seemed at first to reverse the direction of research, as the variety of the X-ray activity level with respect to the optical/UV was discovered, together with variety of X-ray spectral slopes. Nevertheless, the issue of universal shape kept reappearing.
Walter & Fink (1993) claim that the spectra of all active galactic nuclei (AGN) consist of two basic universal components. The first component is an IR-X ray power law, with the energy index of the order of 1. The X-ray part of this component is usually named the “primary power law” in X-ray data analysis (see e.g. Mushotzky et al. 1993). The second component is the Big Blue Bump, extending from the optical band through the UV up to the soft X-ray band. Walter & Fink (1993) argue that objects differ only in the normalization of the Big Blue Bump with respect to the IR-X-ray power law, with the shape of the Big Blue Bump being universal. This view is supported by the statistical analysis of the parameter measuring the mean spectral slope between 2500 Å and 2 keV. Such a parameter measures the relative strength of the Big Blue Bump and roughly represents the overall spectral shape. Again, surprisingly, this parameter does not show any strong trend (Bechtold et al. 2003), and the dispersion is partially due to the fact that some sources are significantly obscured in the optical/UV band, like e.g. MCG -6-15-30 (Reynolds et al. 1997). Also a recent study of the X-ray spectra of AGN with X-ray luminosity range between erg s-1 and erg s-1 did not reveal any trend in the X-ray slope with the luminosity (Reeves & Turner 2000).
Similar surprising uniformity is found in another line of research. Reverberation studies of the broad line region show that its size is quite well determined by a single parameter, in this case the value of the flux at 5100 Å (Kaspi et al. 2000). The dispersion in this relation is relatively low, less than a factor of 3.
This broad-band spectral-shape uniformity encouraged the researchers to connect uniquely the bolometric luminosity of the source with the flux measured at a single frequency. For example, many authors are using a simple formula to estimate the bolometric luminosity in a form (e.g. Kaspi et al. 2000), and this approach seems to reproduce the results of more accurate integrating over the broad-band spectra quite well (Collin et al. 2002, Nikołajuk et al., in preparation).
This kind of universal picture is by no means expected from the simple accretion disk model. The bolometric luminosity, including X-ray emission, should scale with the accretion rate, , while the optical flux, coming from the outer parts of the disk, should scale as (see e.g. Tripp et al. 1994), and thus is additionally influenced by the black hole mass, . The soft X-ray slope can in principle take any value, since apparently there are no constraints for the parameters of the Comptonizing plasma.
In the present paper we address the issue of the possible physical mechanisms which may account for the universality of the broad-band spectra in the case of objects accreting with high accretion rates.
2 Examples of spectra and corresponding standard disk models
Radio-quiet quasars and Narrow-line Seyfert 1 galaxies are the sources expected to accrete mass at a high rate (e.g. Pounds et al. 1995, Collin et al. 2002). Here we choose several extreme examples of such spectra.
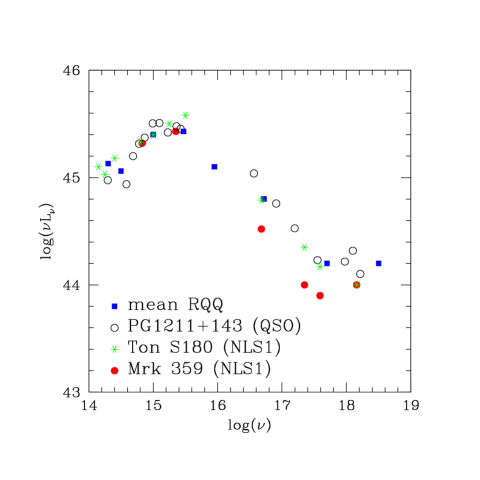
A particularly well-covered broad-band spectrum available is the composite spectrum of quasars (Laor et al. 1997) shown in Fig. 1. Such a composite seems to be indeed quite representative for all high-accretion-rate sources. As examples, we include in the same plot the broad-band spectrum of quasar PG1211+143 (Janiuk et al. 2001) and two Narrow-line Seyfert 1 galaxies - Ton S180 (Różańska et al. 2003) and Mrk 359 (Mathur et al. 2001; O’Brien et al. 2001). The bolometric luminosity corresponding to those spectra is erg cm-2s-1, erg cm-2s-1, erg cm-2s-1 and erg cm-2s-1, assuming a Hubble constant equal to 50 km s-1 Mpc-1. The optical flux for Mrk 359 has been corrected for starlight contribution (factor 2.5) on the basis of the ratio of the observed value of the flux in the starlight-free source Ton S180 (46 Å) and Mrk 359 (18 Å) (Véron-Cetty et al. 2001).
The sources covering two orders of magnitude in bolometric luminosity, and therefore possibly two orders of magnitude in mass, show nevertheless a surprisingly similar broad-band shape. The description of the X-ray spectra of Ton S180 and Mrk 359 may seem different (the X-ray photon index of Ton S180 is given as 2.44, Turner et al. 2001 and of Mrk 359 as 1.85, O’Brien et al. 2001). However, this apparent difference mostly reflects the fact that the instruments used are most sensitive at 2-3 keV and return, as ’representative’ X-ray slope, the slope around this energy. If for example, we fit the Ton S180 Chandra data of Turner et al. (2001) with a broken power law model (bknpower in XSPEC software) and fix the second slope at 1.85 we obtain a satisfactory fit, with the energy break at keV instead of at 2.0 keV, as apparently seen in the XMM data of Mrk 359. The two spectra seem to be shifted in energy only by a small factor of 1.35, or 0.13 in the logarithm!
The bolometric luminosity is dominated by the optical/UV/far-UV part ( %), the EUV-soft X-ray band contributes about 25 %, and a few per cent comes from the hard X-ray power law.
3 The model
It is well known that the simplest standard Shakura-Sunyaev disk model (Shakura & Sunyaev 1973), under assumption of local black-body emission, cannot account for the observed X-ray spectra of AGN (Czerny & Elvis 1987; Mushotzky et al. 1993; Krolik 1999; for a recent review, see e.g. Czerny 2002). The model is also not quite satisfactory in the optical/UV band since the observed spectra are frequently redder than predicted by the model. The model spectra, in the long wavelength limit, have the universal slope of 1/3 while the mean quasar slope above 1050 Å in the Zheng et al. (1997) sample is .
The problems with the model are progressively more serious with a decreasing Eddington ratio. There are several arguments in favour of the view that in low luminosity sources, like normal Seyfert 1 galaxies, the standard disk exists only in the outer part of the flow while closer to the black hole it is replaced by the inner hot optically thin flow, possibly ADAF(e.g. Ichimaru 1977; Narayan & Yi 1994; Abramowicz et al. 2002). We meet a similar situation in the galactic black holes in their hard/low luminosity state (e.g. Esin et al. 1997; Nowak et al. 2002). Modeling of the flow requires a deep change in the basic geometry, in comparison with the standard model. There were ideas of the optically thick (but highly ionized at the surface) disks dominating the flow even in the innermost part (e.g. Beloborodov 1999; Poutanen & Fabian 1999) but a recent study of the hard X-ray tail of the reflection component in Cyg X-1 suggests that the disk is indeed disrupted, and not just invisible due to high reflectivity (Barrio et al. 2002).
However, for sources with relatively high Eddington ratio, like quasars (see e.g. Collin et al. 2002) and Narrow-line Seyfert 1 galaxies, there are arguments in favour of the standard disk extending down to the marginally stable orbit. The reflection component in those sources is significantly ionized but strong. Relativistic smearing indicates that this component comes from the innermost part of the flow (e.g. Janiuk et al. 2001). Also the iron line is strong and (relativistically) broadened in many of those sources (MCG-6-30-15, Lee et al. 2002; Ark 564, Comastri et al. 2001; low redshift quasars, Mineo et al. 2000). In those sources (see Fig. 1) the bolometric luminosity is dominated by the Big Blue Bump which can be roughly explained as coming from the disk.
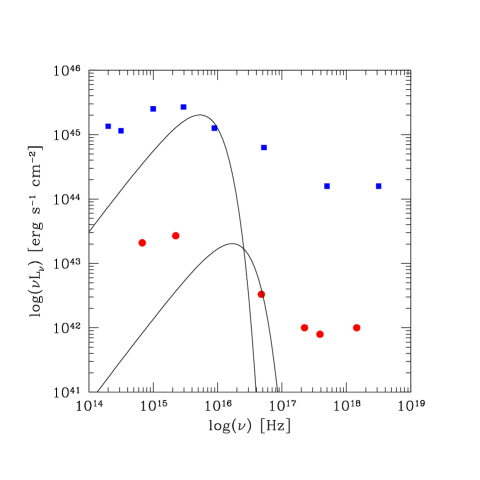
Therefore, in the case of high-luminosity sources, all we need is some modification of the standard model, and such modifications were introduced in the literature whenever the model was compared with the observational data. X-ray spectra were modeled by adding some kind of a corona or warm skin to the disk (Czerny & Elvis 1987; Shimura & Takahara 1995; Kawaguchi et al. 2001). Optical/UV spectra were modeled by introducing an irradiation of the outer disk by the innermost part (e.g. Czerny et al. 1994, Loska & Czerny 1997, Soria & Puchnarewicz 2002). However, those modifications were basically arbitrary from the point of view of our knowledge of the accretion process, and therefore do not explain the reason why the resulting spectral shape is so universal. Comparison of the data with the simplest standard disk models (see Fig 2) shows a significant trend with the black hole mass. It also indicates what fraction of the energy has to be reprocessed in order to explain the observed spectral shape.
In the two subsections below we propose two modifications to the standard model which directly result from our knowledge of accretion disk physics and AGN surroundings.
3.1 Irradiation and the optical/UV spectra
The irradiation of the outer parts of the disk may be either direct or indirect, through scattering the emission from the innermost part by some medium and redirecting part of the scattered flux towards the outer disk.
3.1.1 Direct irradiation
Direct irradiation was discussed by several authors in the context of AGN (e.g. Rokaki et al. 1993; Loska & Czerny 1997; Nayakshin & Kazanas 2002) or GBH (e.g. Cannizzo 2000), mostly concentrating on illumination of the disk by an X-ray source, arbitrarily located high above the disk. Since in high sources the hard X-ray flux is small this effect is not as important as the illumination by the inner disk emission.
Self-irradiation is efficient if the disk is strongly flaring, since the direct irradiation by the point-like source is roughly given by (see e.g. King 1998, Soria & Puchnarewicz 2002), where is determined by the disk thickness, , as . We can roughly estimate the effect at the distance of a few thousands of Schwarzschild radii from the Shakura-Sunyaev paper, their region (b) or (c). The value is of order of , since it is systematically smaller in AGN than in GBH due to the direct scaling with mass seen in the formula for the disk thickness. The same conclusion was reached in the paper of Kurpiewski et al. (1997).
Additionally, if we actually consider not a point-like isotropic source but an inner flat disk, with effective radiation flux proportional to the inclination angle measured with respect to the symmetry axis, the appropriate expression for is (see King et al. 1997 and references therein). The presence of an additional factor again lowers the effectiveness of direct self-irradiation.
Numerical computations, including a more accurate approach to the disk opacity (bound-free transitions), support this results (Loska et al., in preparation). Due to the complex dependence of the disk thickness on the distance only a relatively narrow belt at intermediate radii as well as very distant parts of the disk are irradiated directly by the disk central regions. Direct irradiation was efficient in the paper of Soria & Puchnarewicz (2002) since they adopted a much higher value of (of order of 0.03) than expected for an AGN.
Therefore, in the present paper we neglect the effect of direct irradiation.
3.1.2 Indirect irradiation
The indirect irradiation was studied in detail in a number of papers devoted to the accretion disk coronae (e.g. Ostriker et al. 1991; Murray et al. 1994; Kurpiewski et al. 1997; see also Esin et al. 1997 for the case of galactic sources). The effect was found to be important if the corona is of considerable optical depth and if it is geometrically thick. However, the existence of a corona with the appropriate parameters is neither obvious, nor widely accepted. Attempts to reproduce the corona on the physically sound basis of disk evaporation (e.g. Meyer & Meyer-Hofmeister 2000; Różańska & Czerny 2000; Liu et al. 2002) predict so far a very weak and optically thin corona in the case of sources with even moderately high .
In the present paper we propose a different mechanism for the indirect disk irradiation, namely scattering by the warm absorber.
3.1.3 Warm absorber properties
The warm absorber is a significantly ionized medium present in our line of sight towards sources classified as Seyfert 1 galaxies, Narrow Line Seyfert 1 galaxies or quasars. Observationally, it is seen through the presence of narrow absorption lines and absorption continua in the soft X-ray band which are well resolved now in the Chandra or XMM data (see Kaastra et al. 2002; Lee et al. 2001; Steenbrugge et al. 2003; Sabra et al. 2003). Most lines come from highly ionized species like CIV, OVII and OVIII, suggesting that the temperature of the medium is of the order of K. The column density of the warm absorber is frequently of the order of cm-2 or more, and the medium is extended but probably clumpy (see e.g. Krolik 2002).
Although we see the presence of the warm absorber due to absorption features superimposed onto the transmitted spectrum from the nucleus this medium actually predominantly scatters the incoming photons instead of absorbing them. Most of the radiation from the nucleus is emitted in the far UV band while at such wavelengths the electron scattering dominates the total cross-section.
We illustrate the scattering efficiency of the warm absorber in Fig. 3. It shows the ratio of the total optical depth of the warm absorber to the Thomson optical depth as a function of the energy, calculated for an exemplary case of a warm absorber model considered as appropriate for Ton S180 (Różańska et al. 2003). The model is computed with the use of the radiation transfer code titan developed by Dumont et al. (2000) and modified for the purpose of warm absorber modeling by Różańska et al. (2003). We assumed constant pressure throughout the medium, as advocated by Krolik (2002), since it may better represent the density profile within separate clumps.
The emission spectra of the considered objects (see Sect. 2) peak in the frequency range Hz where electron scattering dominates.

3.1.4 Modification of the disk spectrum due to fully ionized warm absorber
The effect of scattering slightly decreases the overall normalization of the spectrum, by a factor of , and redirects a fraction of the scattered radiation back towards the disk. In the further consideration the effect of absorption is neglected and only the effect of scattering is considered.
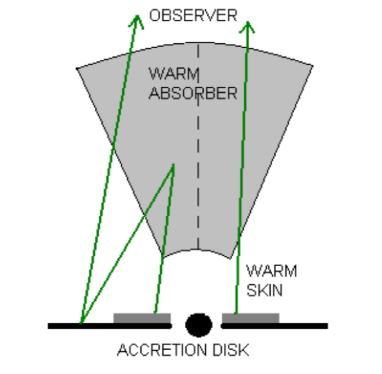
The radial extension of the warm absorber is not well constrained and distances from light days - weeks to tens of parsecs were proposed (see Krolik 2002). We envision the geometry in Fig. 4. We neglect the clumpiness of the medium and we parameterize the region by the total optical depth for electron scattering, , minimum and maximum distance of the warm absorber from the nucleus. We assume that the dependence of the density of the warm absorber on the distance can be described as a power law, , with the normalization fixed by the assumption of the total optical depth. For our purpose of a rough estimate of the effect we do not introduce any specific dependence on the distance from the symmetry axis but we assume that the irradiation of the disk at a distance r from the center can be approximately represented as
| (1) |
where is the bolometric luminosity of the accretion disk and the coefficient corresponds to the fraction of nuclear emission passing through the warm absorber, determined by the solid angle. The factor 2 is due to the disk emission anisotropy - the flat central parts of the accretion disk are well approximated by a central point-like source with luminosity dependent on the inclination angle measured with respect to the symmetry axis (see King et al. 1997 and references therein). Since the warm absorber is located predominantly along the symmetry axis, . We assume that the irradiation flux is subsequently thermalised within the disk, with albedo equal to 0.2, appropriate for the weakly ionized surface of an outer disk.
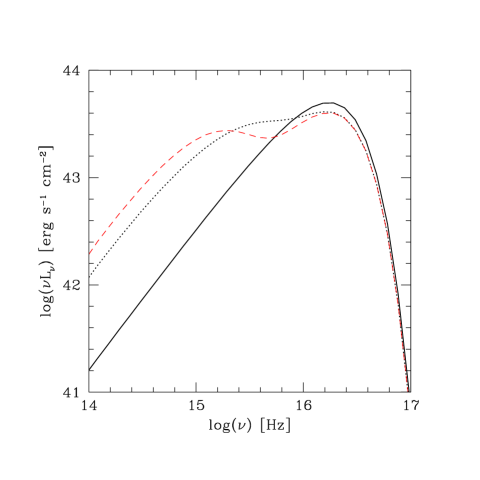
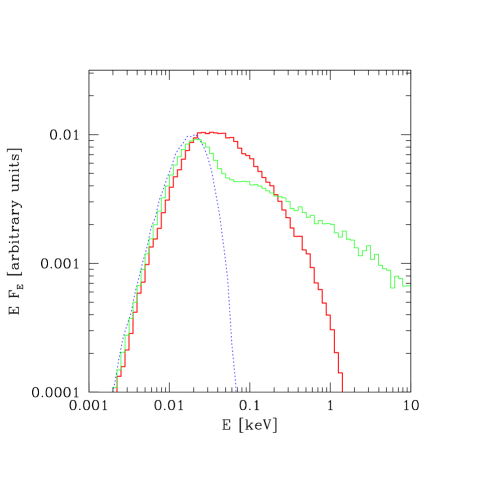
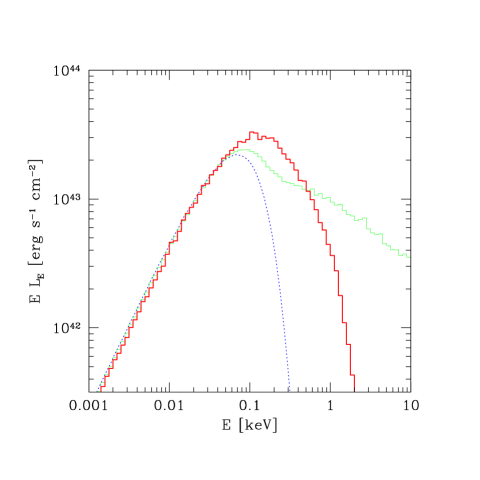
For the range of disk radii of the order of the spatial extension of the warm absorber such an irradiation decreases more slowly with the disk radius than the energy dissipation, which is proportional to . The outer disk temperature is enhanced and the disk spectrum is modified predominantly at longer wavelengths (optical and the IR band). The effect is only weakly influenced by the location of the outer edge of the warm absorber and the density distribution, more important is the exact location of the inner edge of the warm absorber (see Fig. 5).
Since the effect of irradiation depends mostly on the inner disk bolometric luminosity the resulting spectrum mostly depends on the bolometric luminosity of the source. The temperature profile in the intermediate parts approaches distribution, and the spectrum integrated over the disk surface, , scales roughly as . The exact shape computed from Eq. (1) is somewhat more complex than this simple law but it basically preserves the scaling with the bolometric luminosity.
3.2 Stabilization of the disk by a warm skin and formation of the soft X-ray spectra
Comptonization of a fraction of disk photons is clearly needed in order to reproduce the soft X-ray part of the spectrum. It is not clear what is the geometry of the Comptonizing medium. However, in the case of high-luminosity objects the favoured model is that of a disk extending down to the marginally stable orbit and of a warm skin covering the inner region. A similar interpretation holds both for galactic black holes in their High State or Very High State and for luminous AGN (e.g. Czerny 2002; Miller et al. 2002; Gierliński et al. 2001). The support comes from the high disk temperature (Puchnarewicz et al. 2001; Kubota et al. 2001), the presence of broad line (MCG-6-30-15, Tanaka et al. 1995; Lee et al. 2002) and relativistically broadened reflection by the ionized material (e.g. PG 1211+143, Janiuk et al. 2001). The hard X-ray power law may come from separate coronal flares, or possibly from a contribution of non-thermal electrons to a mostly thermal population of warm skin electrons, as suggested by Vaughan et al. (2002) on the basis of the Ton S180 data analysis. Such a view is observationally supported by the data for Cyg X-1 in its high/soft state where the hard X-ray tail is faint but extends up to MeV (Gierliński et al. 1999).
The properties of the Comptonizing material are not specified from a theoretical point of view. They are usually adopted as model parameters to be fitted to the observational data (see e.g. Vaughan et al. 2002). In the present section we propose a mechanism which leads in a natural way to a certain value of the Compton amplification factor, , of the warm skin, and consequently, similar soft X-ray slopes in many objects. We neglect the issue of the non-thermal fraction of the electron population and the hard X-ray tail of the spectra.
3.2.1 General stationary model of the warm skin
We assume that the accretion disk is divided into two layers: an inner cold part and a warm Comptonizing skin. This is a typical assumption made in many disk/corona models (e.g. Haardt & Maraschi 1991; Misra & Taam 2002). We further assume that a fraction of the energy is transported from the disk interior towards the skin as a magnetic flux. Therefore, the energy balance of the disk interior reads:
| (2) |
where is the radiative cooling of the disk interior, is the magnetically transported flux and is the energy flux dissipated in the disk interior.
We describe the radiative cooling of the optically thick disk and the dissipative heating in the disk interior as in the basic model of Shakura & Sunyaev (1973) with the vertically averaged approach
| (3) |
where is the disk interior temperature, is the disk surface density, is the opacity coefficient for electron scattering and is related to the Stefan-Boltzman constant through ;
| (4) |
where is the standard viscosity coefficient, is the pressure and is the Keplerian angular velocity.
We now assume that the magnetically transported flux is proportional to the energy density of the magnetic field, (which is in turn proportional to the total pressure with the disk), to the Alfven velocity , and to the fraction of the surface developing active regions, which we assume to be proportional to the disk thickness, ,
| (5) |
We illustrate the idea of localized magnetic tubes in Fig. 6.

The first two factors in Eq. (5) arise in a natural way from considerations of magnetic activity in the context of a disk corona (e.g. Heyvaerts & Priest 1989; Merloni & Fabian 2002) or the formation of stellar coronae (e.g. Fawzy et al. 2002). The third factor is more difficult to estimate on the basis of theoretical considerations. Flux tubes at any moment usually cover only a fraction of the boundary surface between the deep interior and the upper stellar coronae but this covering factor is frequently introduced as a free parameter, of the order of 0.1 (e.g. Fawzy et al. 2002). We assume that this covering is proportional to the disk thickness, and our argument is the following.
The size of any convective cell in the disk interior scales with the disk thickness, as argued by Shakura & Sunyaev (1973), with the viscosity parameter providing the proportionality constant. A similar approach was used in the corona model by Galeev et al. (1979). Recent 3-D numerical simulations of the development of the magnetorotational instability also support such a view (e.g. Miller & Stone 2000). Therefore, disk thickness defines in a natural way the radial size of the active region at the border between the inner disk and a warm skin. In the azimuthal direction, the motion is much faster than the characteristic convective motion (the sound speed is much smaller than the Keplerian velocity) so the structures become immediately elongated and their azimuthal sizes scale with radius and do not depend on the disk thickness. The number of active zones may be constrained if their number is related to the observed hard X-ray emission flare. The variability of the hard X-ray component was studied in a number of galactic sources and AGN using power spectra analysis. The basic and general result is that the power spectra and rms (root mean square) variability depend on the luminosity but when renormalized (i.e. if rms and power spectrum are divided by the mean luminosity and its square, correspondingly) they become luminosity-independent. This fact, stressed recently by Uttley et al. (2002) means that the number of active regions directly responsible for the observed variations is independent of the luminosity. If the number of active regions is constant, their azimuthal extension is independent of the disk thickness and the radial size is proportional to the disk thickness. Therefore, we can assume that effectively the active fraction of the surface between the inner disk and the warm skin is proportional to the disk thickness.
The energy density of the magnetic field in the disk interior is expected to be proportional to the pressure, , i.e. , and the Alfven speed can be expressed as a function of the disk surface density, and the disk thickness, , .
Therefore we obtain the following characteristic dependence
| (6) |
3.2.2 Thermal stability of the disk interior
We perform next the stability analysis of the disk interior in the thermal timescale, closely following the analysis done by Czerny et al. (1987). We assume that in such a short timescale the surface density remains constant throughout perturbation. Since the dynamical timescale is in turn much shorter than the thermal timescale we assume that the expanding/contracting disk adjusts its structure to preserve hydrostatic equilibrium. The hydrostatic equilibrium equation reads
| (7) |
where is the hydrogen mass, and is the Boltzman constant. The first term of Eq. (7) represents the gas pressure and the second term the radiation pressure. Perturbing this equation for gives us the relation between the change of the disk thickness and the perturbation of the disk temperature. It can be most conveniently expressed as
| (8) |
where is the gas-to-total-pressure ratio. Using Eq. (8) we can express the perturbed energy transport terms as functions of :
| (9) |
| (10) |
| (11) |
The disk is thermally stable if the increase in the heating rate is smaller than the increase of the cooling rate for positive temperature perturbation (e.g. Piran 1978), i.e.
| (12) |
Introducing a convenient parameter measuring the importance of the magnetically transported flux
| (13) |
and using the equilibrium condition given by Eq. (2) we can express the condition given by Eq. (12) as
| (14) |
For the criterion reduces to the standard criterion of Shakura & Sunyaev (1976).
The presence of magnetic transport stabilizes the disk since its dependence on the temperature is steep enough (the same as in the case of an advection term). When the disk already becomes stable even if strongly dominated by the radiation pressure (i.e. ).
3.2.3 Marginal stability solution for the warm skin
We therefore consider it possible that the disk in a natural way develops this magnetically mediated transport in the radiation-pressure-dominated region and that the transport efficiency saturates at the value corresponding to a marginal stability,
| (15) |
This region of the disk would be therefore covered with a warm skin. We named it ’warm’, and not a ’hot’ skin since we have in mind a medium with the temperature well below the typical temperature 100 keV invoked for the hot Comptonizing medium responsible for the hard X-ray power law with the energy index seen in most (perhaps all) objects instead of, or in addition to, the much steeper soft X-ray power law which we intend to model.

The warm skin cools predominantly by Comptonization, as suggested by the roughly power law character of the spectrum in the soft X-ray band. We further assume that the effect of bremsstrahlung and synchrotron emission are negligible. We also assume that the disk surface layers underlying the warm skin are strongly ionized, i.e. the albedo at the disk/skin division surface is equal to 1.
The cooling efficiency of the Comptonization is therefore fixed by the parameter , i.e. the Compton amplification factor, , is given by
| (16) |
Our model therefore roughly corresponds to the original Haardt & Maraschi (1991) analytical model with the fraction of the energy dissipated in the corona and the albedo . However, we provide a physical justification for the specific choice of in the case of the underlying disk dominated by radiation pressure.
The obtained value of the Compton amplification factor, , for the warm skin of a marginally stable disk interior, , is significantly lower than the value determined from the model of Haardt & Maraschi (1991) for the corona-dominated solution ( in their Eq. (3b)).
Since the Compton amplification factor is related to the Compton parameter , it roughly determines the slope of the radiation spectrum, , through simple analytical formulae (see Rybicki & Lightman 1979). Therefore, warm skin spectra are expected to be much softer than the corona of Haardt & Maraschi (1991). For example, an approximate analytical formula of Beloborodov (1999): gives the expected slope for and for . However, analytical formulae are not accurate; quantitative results can be conveniently obtained from Monte Carlo computations.
3.2.4 Radiation spectrum from disk/warm skin system
We perform Monte Carlo simulations assuming plane parallel geometry. We developed our code from the code used by Janiuk et al. (2000). The slab is parameterized by the electron temperature, , and the optical depth, . Photons are emitted isotropically at the bottom of the slab. The spectral distribution of the injected photons is described either by a black body distribution or provided in a numerical form. Since the disk is highly ionized we assume a perfect mirror at the bottom of the slab. Photons trying to leave the slab through the bottom surface are collected and returned to the medium with their energy unchanged and their velocity reversed. This means we neglect, for simplicity, the energy losses during the scattering of the photons with the bottom surface which in principle is important for higher energy photons (above 15 keV) due to the inelastic scattering. All photons are finally collected at the slab upper surface. The final spectrum is obtained by summation of all photons over the angle at which they leave the surface, i.e. the spectrum represents the average over all inclination angles.
We perform computations for both the optically thin and optically thick warm skin. We compute the amplification factor for a set of models. For each optical depth we find a value of the temperature corresponding to the amplification factor equal to 2. The resulting plot is shown in Fig. 7.

Although the condition roughly determines the slope of the power-law part of the spectrum, the Monte Carlo computations make it possible to see some trends with the change of optical depth. In Fig. 8 we show the spectral slope determined by a linear fit to the resulting spectrum in two soft X-ray bands, for 0.5 keV to 2 keV and for 0.1 to 2.4 keV, for the temperature of the input photons fixed at 5 eV. We see that generally the spectrum steepens with increasing optical depth. Analogous trends were already seen by Haardt & Maraschi (1991) as well as for example by Abrassart & Czerny (2000) when they fixed the spectral slope but determined the amplification factor as a function of the temperature of the medium. The effect is more strongly visible for the slope measured in a narrower band since the spectrum displays some curvature due to the low value of the electron temperature. Extreme examples of the Comptonized black body emission by optically thin and optically thick skin are shown in Fig. 9.
For very low optical depth/high temperature we see a considerable effect of the first scattering. This effect, well known from Monte Carlo simulations, might in principle allow to determine independently the optical depth of the Comptonizing medium. However, this effect is not seen in the real data. This is not surprising - for example, the effect is considerably reduced if we take the disk spectrum (instead of a single black body), as a source of the soft photons. A broader input spectrum smears the first scattering feature, as we can see from direct comparison of Fig. 10 with Fig. 9.

We can compare the expected range of soft X-ray slopes with the ROSAT data for NLS1 galaxies (see Fig. 11). High-accretion-rate objects tend to have a spectral slope of the order of 1.7 (see Fig. 1 and Fig. 11) but with some dispersion around this value. Our model does not favour any specific value of the temperature so the observed dispersion is not surprising. Judging from the slope range (and accepting our theoretical determination of the amplification factor) the optical depth of the warm skin is typically between 1 and 10. This agrees with the determination of the optical depth of the warm skin by detailed modeling the X-ray data of PG1211+143 by Janiuk et al. (2000).
Computations of the radiation spectrum formed from the disk require the determination of the disk fraction covered by the skin and subsequent Comptonization of the locally emitted spectrum. The extension of the radiation-pressure-dominated zone was roughly estimated by Shakura & Sunyaev (1973) in their Eq. (2.13). It depends only weakly on the black hole mass and the viscosity coefficient. The extension of the instability zone was computed more accurately by Janiuk & Czerny (2000), taking into account the disk vertical structure and a rather accurate description of the opacity in the disk interior. The numerical results preserve the scaling with accretion rate for large accretion rates but give the extension of the unstable zone by a factor of 2 smaller than the simple Shakura & Sunyaev formula.
3.3 Combined effect of warm skin and irradiation
The fate of the radiation emitted by the disk and backscattered by the warm absorber towards the disk surface depends on whether we deal with the outer, bare part of the disk or with the inner part of the disk covered by the warm skin.
The part of the disk not covered by the warm skin is only weakly ionized The incident flux, given by Eq. (1) is efficiently thermalised so finally the disk radiates locally as a black body emitter with the effective temperature, , determined by the condition
| (17) |
where is the energy dissipated viscously by the disk and described by the standard Shakura-Sunyaev formula. Here we assume that the albedo is equal to 0.2. This radiation is integrated over the disk surface.
The part of the disk covered by the warm skin is practically fully ionized. Photons from the optical/UV/soft X-ray band are scattered by such a medium. Those photons however also contribute to the cooling by Comptonization. In principle we should include those photons as entering the warm skin slab from above but this would complicate the numerical scheme. Therefore, at present, those photons are also treated as a black body photons entering the slab from the bottom. A future, more sophisticated approach should treat these photons more carefully, in an iterative way.
Since Comptonization is a linear process with respect to the input photons, and the parameters of the warm skin do not depend in our model on the disk radius, the radiation going into the warm skin is first integrated over the disk surface, and next the spectrum of radiation leaving the warm slab is computed by a Monte Carlo simulation for such an incident flux.
The radiation from the outer and the inner disk part are summed. Finally, the radiation reaches the observer diluted by a factor .
3.4 Modeled exemplary spectra
Since the aim of our model is to reproduce in a possibly natural way the scaling of the spectra with mass we do not try to actually fit the data points. Instead, we fix the model parameters in a possibly unique way, following the presented model outline.
We fix the accretion rate at , appropriate for high-Eddington-ratio objects.
We fix the warm absorber properties assuming that the solid angle of the warm absorber is equal to and the optical depth of the warm absorber for electron scattering is equal to 0.25 (i.e. the column density is equal to cm-2.). We assume that the warm absorber extends from 100 to .
The extension of the warm skin covering the disk is determined by the extension of the radiation pressure instability zone. For , Janiuk & Czerny (2000) give and we adopt this value.
The Compton amplification is fixed at which determines the relation between the optical depth and the electron temperature. We choose keV and but any combination from Fig. 7 can be used.
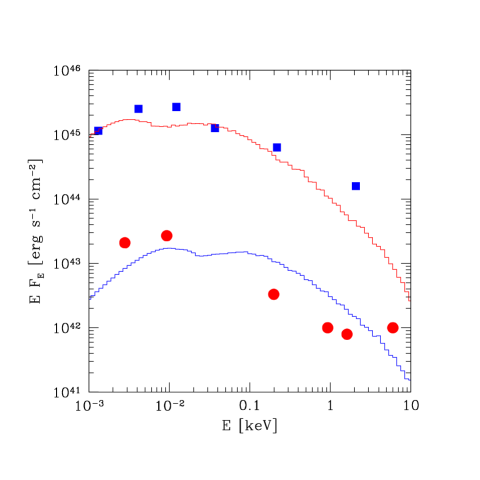
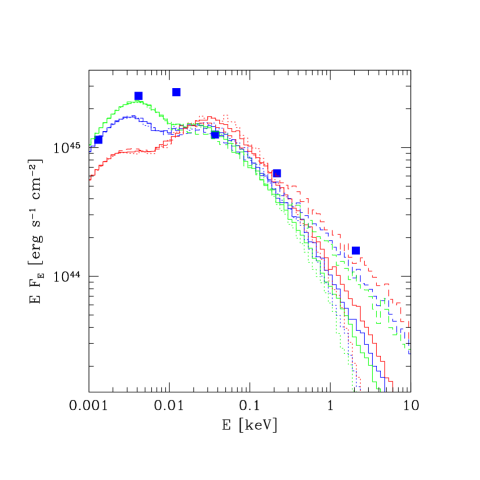
We now apply this model, without any specific adjustments of the parameters, both to the low mass objects (Mrk 359, ) and to the high mass composite spectrum (). The result is shown in Fig. 12, together with the data points representative for the low and the high mass objects.
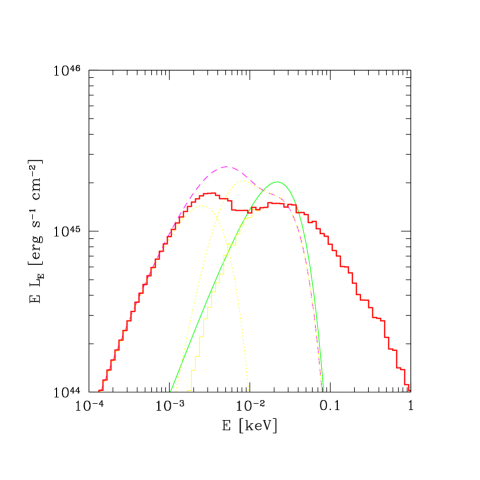
The role of the irradiation and the Comptonization by the warm absorber is illustrated in Fig. 13 which shows the decomposition of the exemplary final spectrum and separately the effect of the warm absorber scattering and the warm skin. The initial standard disk spectrum is lowered down due to the presence of the warm absorber since only a fraction of the radiation is transmitted to the observer. On the other hand the returning radiation enhances predominantly the optical part of the spectrum due to absorption and reemission of the incident flux by the outer parts of the disk.
The model provides a reasonable description of the data. Interestingly, it roughly reproduces the normalization of the spectrum in the soft X-ray band without any specific adjustments of the model. The spectral shape does not show a strong dependence with the mass although some systematical trends are visible. The spectrum is still systematically steeper in the optical/near-IR band and the soft X-ray excess is more pronounced for low mass objects.
The arbitrariness in parameters still remaining in the model - neither warm absorber column nor the warm skin temperature are specified - leads to the dispersion in the predicted spectra. In Fig. 14 we show the family of 9 solutions determined as a combination of three values of the warm absorber optical depth and three values of the warm skin temperature. Solutions with lower skin temperature/optically thicker skin are more appropriate for softer spectra while those with higher skin temperature/thinner skin are appropriate for harder spectra. Higher warm absorber optical depth increases the radiation flux in the optical/UV band. Modelling any specific objects would require adjustment of the all model parameters, including the mass and the accretion rate. However, the overall dispersion among the solutions is not very large.
| Parameter | quasar composite | Mrk 359 |
|---|---|---|
| 0.3 | ||
| 300 | ||
| 3.32 | ||
| [keV] | 3 | |
| 0.25 | ||
| 0.5 | ||
| 2 | ||
| 100 | ||
| 10 000 | ||
The scaling of the model with mass is not perfectly linear, as might have been indicated by simple analytical arguments but it roughly holds, and the spectrum of the high mass object looks roughly as the spectrum of the low mass one, shifted up by a mass ratio in logarithmic scale.
4 Discussion
The model presented in this paper applies to radio quiet AGN with relatively high Eddington ratio, like quasars and NLS1 galaxies. In these objects the accretion disk basically extends down to the marginally stable orbit but the spectra show significant deviations from the simple prediction of a classical disk.
The model presented in this paper does not rely on many arbitrary parameters, as is usually the case for models supposed to reproduce precisely the observed spectra. The basic model parameters are just the black hole mass and the accretion rate. The inner part of the disk is covered by a warm skin, and its radial extension is given by the condition of radiation pressure domination. The soft X-ray spectrum is formed by Comptonization within this warm skin and the Compton amplification factor is given by the stability criterion formulated in our paper. The optical depth and the warm skin temperature separately are not specified but the spectra do not depend dramatically on the choice, as we can see from extreme cases presented in Fig. 9. Some dispersion of the spectral slopes is also seen in the data, which may indicate that there is indeed no additional strong constraint on these two parameters and they may vary from source to source. The optical part of the spectrum is in turn affected by the back-scattering of a fraction of the photons towards the disk by the warm absorber. The warm absorber parameters currently are not as constrained by physical considerations as the warm skin.
Still, the model is based on several assumptions which may, or may not be, appropriate.
4.1 Scaling of the magnetically transported flux towards warm skin
Since the adopted (linear) dependence of the flux tube covering factor adopted in Eq. (5) may be questioned we also consider a more general approach
| (18) |
with being an arbitrary coefficient.
In this case our previous stability criterion (see Eq. (14)) takes a more general form
| (19) |
This means that the radiation pressure dominated disk (with ) is stable if
| (20) |
The predicted Compton amplification factor of the warm skin is therefore
| (21) |
and the soft X-ray slope of the resulting spectrum gets steeper (softer) if the dependence of the covering factor on the disk thickness is stronger than linear (). A considerably weaker dependence leads to very hard spectra and in the limit of all energy must be dissipated in the warm skin in order to stabilize the disk. In this limit our approach reduces to the result obtained by Svensson & Zdziarski (1994): if all energy is dissipated in the hot corona the underlying disk is dominated by the gas pressure, and therefore it is stable.
4.2 High and Very High State in our model
Our model may also explain why the flow in galactic sources is rather stable in the High State but becomes unstable when the source enters the so called Very High State.
The luminosity corresponding to the High State is roughly about 0.1 in Eddington units while at the Very High State it is about 1. A standard disk dominated by the radiation pressure is expected to be unstable at these luminosities and the stabilization is possible at luminosities by a factor of a few higher than the Eddington limit due to the effect of advection (Abramowicz et al. 1988).
The observed sources show the opposite behaviour. The disk component in the Soft State spectrum of Cyg X-1 was shown to be stable (Churazov et al. 2001). A brighter source, the microquasar GRS 1915+105 (which is radiating roughly at the Eddington limit, see e.g. Sobolewska & Życki 2003) frequently enters the extended state in which it shows strong outbursts (e.g. Belloni et al. 2000 and references therein) lasting a few thousands of seconds, corresponding to the viscous timescale in the inner disk region.
We can interpret this behaviour within the frame of our model. When the source is below the Eddington limit, the presence of the warm skin stabilizes the disk. When the source approaches and/or exceeds the Eddington limit, the disk thickness approaches the disk radius, . In this case the surface covered by the magnetic tubes approaches the whole surface and ceases to respond to the temperature changes. In this limit, the situation practically reduces to the case of and the radiation-pressure-dominated disk interior remains unstable, which leads to semi-periodic outbursts of a large amplitude, as usually predicted by computations of the disk time evolution under radiation pressure instability (e.g. Szuszkiewicz & Miller 1998, Szuszkiewicz & Miller 2001, Janiuk et al. 2002).
Of course we should keep in mind that there are two alternative explanations of the stability of the disk in the High State. The first one is that the assumption about the viscosity scaling with the total pressure is incorrect and should be modified (e.g. Milsom et al. 1994, Szuszkiewicz 1990). The second one is the possibility of an uncollimated outflow which also stabilizes the disk (Janiuk et al. 2002). Nevertheless, the warm skin offers an interesting possibility.
It is more difficult to give a similar discussion in the case of AGN due to intrinsically longer timescales and, consequently, poor knowledge of the evolutionary trends. Analogs of outbursts in GRS 1915+105 lasting s would take yr in an AGN. However, large variations seen in NLS1 may be related to the discussed disk instability. This would mean that NLS1 are massive counterparts to galactic sources in their Very High States, as already argued by Różańska & Czerny (2000).
4.3 Optically thin or optically thick skin/corona?
The recent Chandra and XMM observations show no or very weak spectral features in the soft X-ray range in a number of NLS1 galaxies (e.g. Ton S180, Różańska et al. 2003, Vaughan et al. 2002). Therefore, in those sources the soft X-ray slope must be of Compton origin. However, as discussed e.g. by Vaughan et al. (2002), the knowledge of the spectral slope does not allow us to determine the optical depth and the temperature of the medium, and more generally, does not allow us to tell whether the medium is Compton-thick or Compton-thin. In the present paper we do not provide any constraints for the optical depth of the heated layer. Comparing the predicted range of soft spectral slopes with the observed slopes we may favour, a posteriori, an optically thick medium with a relatively low temperature.
4.4 Skin/corona or outflow?
The location of the Comptonizing medium is also not known. In the present paper we assumed that this medium constituted a layer above the accretion disk. However, an alternative picture is also possible - that of an extended medium surrounding the nucleus, possibly in a form of an uncollimated outflow.
Such an outflow was considered by Janiuk et al. (2002) in the context of galactic sources and it was advocated by Pounds et al. (2003) and King & Pounds (2003). The argument for the presence of an outflow comes from the detection of narrow but blueshifted absorption lines in the soft X-ray spectrum of a Narrow-line quasar PG0844+349, indicating an outflow velocity of order of 0.2 .
The bulk motion of the outflowing medium is high enough to cause significant Comptonization of the scattering medium if the flow is optically thick (see e.g. Janiuk et al. 2000). In this case the disk would be also stabilized, as shown by Janiuk et al. 2002.
The two models are difficult to distinguish at present. Perhaps the most promising approach would be through the variability studies.
4.5 Irradiation by warm absorber
In order to modify the spectral slope of the standard disk model in the optical band the irradiation must be considerable, i.e. the optical depth of the warm absorber for scattering should be at least of the order of 0.2.
The observations do not well constrain the total hydrogen column since the medium is highly ionized. For example, the model producing the soft X-ray tail of an AGN spectrum in an outflowing medium (Pounds et al. 2003) requires an optical depth larger than 1 and King & Pounds (2003) actually argue that a photosphere surrounds an active nucleus at a radius significantly larger than the Schwarzschild radius. A detailed spectroscopic analysis of more objects in the soft X-ray band may possibly provide stronger constraints.
5 Conclusions
We develop a model which is appropriate for high luminosity sources in terms of the Eddington ratio, such as radio-quiet quasars and NLS1 galaxies.
We propose two mechanisms - irradiation and marginal stability of the accretion disk warm skin - which together may be responsible for the relatively uniform spectral shape of those AGN.
Irradiation results in softer optical/UV spectra than predicted by the classical disk models. The warm skin stabilizes the radiation-pressure-dominated disk and Comptonizes the disk emission thus producing the soft X-ray part of the spectrum. The condition of stability leads to a specific value of the Compton amplification factor () which roughly determines the soft X-ray slope. Both effects lead to a radiation spectrum whose shape does not strongly depend on the parameters.
Our results are in agreement with the conclusion of Woo & Urry (2002) that there is no strong correlation between the Eddington ratio and the mass. Masses of high-accretion-rate objects span a broad range, and a correspondingly broad range is covered by the bolometric luminosities.
Both mechanisms are studied at present in the simplified form and further research is clearly needed to confirm their effectiveness and applicability for the modeling of the broad-band data. Future model should also account for the hard X-ray emission.
Lower-luminosity AGN (in terms of the Eddington ratio), like Seyfert galaxies, are not expected to be represented by the discussed model. In those sources the disk evaporation is most probably very effective, as expected from the models (e.g. Różańska & Czerny 2000, Liu et al. 2002), and the inner disk is replaced with a hot, possibly advection dominated flow (e.g. Narayan & Yi 1994). The small soft X-ray excess, if present, is due to reprocessing of the X-ray emission by the outer disk (e.g. Czerny & Życki 1994), and the iron line also formed in the outer disk is mostly narrow. The skin-dominated part does not develop in those sources.
Acknowledgements.
We thank Michał Czerny, Joasia Kuraszkiewicz and Catherine Boisson for helpful discussions and the anonymous referee for very careful reading of the manuscript and for comments which helped to clarify several points. Part of this work was supported by grants 2P03D00322 and PBZ-KBN-054/P03/2001 of the Polish State Committee for Scientific Research, and by Jumelage/CNRS No. 16 “Astronomie France/Pologne”.References
- (1) Abramowicz M.A., Czerny B., Lasota J.-P., Szuszkiewicz E., 1988, ApJ, 332, 646
- (2) Abramowicz M.A., Igumenshchev I.V., Quataert E., Narayan R., 2002, ApJ, 565, 1101
- (3) Abrassart A., Czerny B., 2000, A&A, 356, 475
- (4) Barrio F.E., Done C., Nayakshin S., 2002, astro-ph/0209102
- (5) Bechtold J., Siemiginowska A., Shields J., Czerny B., Janiuk A. et al., 2003, ApJ, in press (astro-ph/0204462)
- (6) Belloni T., Klein-Wolt M., Mendez M., van der Klis M., van Paradijs J., 2000, A&A, 355, 271
- (7) Beloborodov A.M., 1999, ApJ, 510, L123
- (8) Boller Th., Brandt W.N., Fink H., 1996, A&A, 305, 53
- (9) Cannizzo J.K., 2000, ApJ, 534, L35
- (10) Churazov E., Gilfanov M., Revnivtsev M., 2001, MNRAS, 321, 759
- (11) Collin S., Boisson C., Mouchet M., Dumont A.-M, Coupé S. et al., 2002, A&A, 388, 771
- (12) Comastri A., Stirpe G.M., Vignali C., Brandt W.N., Leighly K.M. et al., 2001, A&A, 365, 400
- (13) Czerny B., Jaroszyński M, Czerny M., 1994, MNRAS, 268, 135
- (14) Czerny B., Elvis M., 1987, ApJ, 321, 305
- (15) Czerny B., Życki, P.T., 1994, ApJ, 439, L5
- (16) Czerny B., 2002, to appear in Proceedings of the Conference Active Galactic Nuclei: From central engine to host galaxy, Meudon, France, 23-27 July 2002, Editors: S. Collin, F. Combes & I. Shlosman
- (17) Czerny M., Czerny B., Grindlay J.E., 1987, ApJ, 312, 112
- (18) Dumont A.M., Abrassart A., Collin S., 2000, A&A, 357, 823
- (19) Esin A.A., McClintock J.E., Narayan R., 1997, ApJ, 489, 865
- (20) Fawzy D., Rammacher W., Ulmschneider P., Musielak Z.E., Stȩpień K., 2002, A&A, 386, 971
- (21) Galeev A.A., Rosner R., Vaiana G.S., 1979, ApJ, 229, 318
- (22) Gierliński M., Maciołek-Niedźwiecki A., Ebisawa K., 2001, MNRAS, 325, 1253
- (23) Gierliński M., Zdziarski A.A., Poutanen J., Coppi P.S., Ebisawa K., Johnson W.N., 1999, MNRAS, 309, 496
- (24) Haardt F., Maraschi L., 1991, ApJ, 380, L51
- (25) Heyvaerts J.F., Priest E.R., 1989, A&A, 216, 230
- (26) Ichimaru S., 1977, ApJ, 214, 840
- (27) Janiuk A., Czerny B., 2000, New Astron., 5, 7
- (28) Janiuk A., Czerny B., Madejski G., 2001, ApJ, 557, 408
- (29) Janiuk A., Czerny B., Siemiginowska A., 2002, ApJ, 576, 908
- (30) Janiuk A., Czerny B., Życki P.T., 2000, MNRAS, 318, 180
- (31) Kaastra J.S., Steenbrugge K.C., Raassen A.J.J., van der Meer R.L.J., Brinkman A.C. et al., 2002, A&A, 386, 427
- (32) Kaspi S., Smith P.S., Netzer H., Maoz D., Jannuzi B.T. et al., 2000, ApJ, 533, 631
- (33) Kawaguchi T., Shimura T., Mineshige S., 2001, ApJ, 546, 966
- (34) King A.R., 1998, MNRAS, 296, L45
- (35) King A.R., Kolb U., Szuszkiewicz E., 1997, ApJ, 488, 89
- (36) King A.R., Pounds K.A., 2003, astro-ph/0305541
- (37) Krolik J.H., 1999, Active galactic nuclei : from the central black hole to the galactic environment, Princeton, N. J., Princeton University Press
- (38) Krolik J.H., 2002, in Workshop on X-ray Spectroscopy of AGN with Chandra and XMM-Newton, held at MPE Garching, December 3-6, 2001, MPE Report 279, p. 131 (astro-ph/0204418)
- (39) Kubota A., Makishima K., Ebisawa K., 2001, ApJ, 560, 147
- (40) Kurpiewski A., Kuraszkiewicz J., Czerny B., 1997, MNRAS, 285, 725
- (41) Laor A., Fiore F., Elvis M., Wilkes B.J., McDowell J.C., 1997, ApJ, 477, 93
- (42) Lee J.C., Ogle P.M., Canizares C.R., Marshall H.L., Schultz N.S. et al., 2001, ApJ, 554, L13
- (43) Lee J.C., Iwasawa K.H., Fabian J.C., Marshall H.L., Canizares, C.R., 2002, ApJ, 570, L47
- (44) Liu B.F., Mineshige S., Meyer F., Meyer-Hofmeister E., Kawaguchi T., 2002, A&A, 575, 117
- (45) Loska Z., Czerny B., 1997, MNRAS, 284, 946
- (46) Malkan M.A., Sargent W.L.W., 1982, ApJ, 254, 22
- (47) Mathur S., Kuraszkiewicz J., Czerny B., 2001, New Astron., 6, 321
- (48) Merloni A., Fabian A.C., 2002, MNRAS, 332, 165
- (49) Meyer F., Meyer-Hofmeister E., 2000, A&A, 361, 175
- (50) Miller J.M., Wijnands R., Rodriguez-Pasqual P.M., Ferrando P., Gaensler B.M. et al. 2002, ApJ, 566, 358
- (51) Miller K.A., Stone J.M., 2000, ApJ, 534, 398
- (52) Milsom J.A., Chen X., Taam R.E., 1994, ApJ, 421, 668
- (53) Mineo T., Fiore F., Laor A., Constantini E., Brandt W.N. et al., 2000, A&A, 359, 471
- (54) Misra R., Taam R.E., 2002, ApJ, 573, 764
- (55) Murray S.D., Castor J.I., Klein R.I., McKee C.F., 1994, ApJ, 435, 631
- (56) Mushotzky R.F., Done C., Pounds K.A., 1993, ARA&A, 31, 717
- (57) Narayan R., Yi I., 1994, ApJ 428, L13
- (58) Nayakshin S., Kazanas D., 2002, ApJ, 567, 85
- (59) Nowak M.A., Wilms J., Dove J.B., 2002, MNRAS, 332, 856
- (60) O’Brien P.T., Page K., Reeves J.N., Pounds K.A., Turner M.J.L., Puchnarewicz E.M., 2001, MNRAS, 327, L37
- (61) Ostriker E.C., McKee C.F., Klein R.I., 1991, ApJ, 377, 593
- (62) Piran T., 1978, ApJ, 221, 625
- (63) Pounds K.A., Done C, Osborne J.P., 1995, MNRAS, 277, L5
- (64) Pounds K.A., Reeves J.N., King A.R., Page K.L., O’Brien P.T., Turner M.J.L., 2003, astro-ph/0303603
- (65) Poutanen J., Fabian A.C., 1999, MNRAS 306, L31
- (66) Puchnarewicz E.M., Mason K.O., Siemiginowska A., Fruscione A., Comastri A., Fiore F., Cagnoni I., 2001, ApJ, 550, 644
- (67) Reeves J.N., Turner M.J.L., 2000, MNRAS, 316, 234
- (68) Reynolds C.S., Ward M.J., Fabian A.C., Celotti A., 1997, MNRAS, 291, 403
- (69) Rokaki E., Collin-Souffrin S., Magnan C., 1993, A&A, 272, 8
- (70) Różańska A., Czerny B., 2000, A&A, 360, 1170
- (71) Różańska A., Czerny B., Siemiginowska A., Dumont A.-M., 2003, ApJ (submitted)
- (72) Rybicki, G.B., & Lightman, A.P., 1979, Radiative processes in astrophysics (Wiley, New York)
- (73) Sabra B.M., Hamman F., Jannuzi B.T., George I.M., Shields J.C., 2003, ApJ (in press), astro-ph/0302555
- (74) Shakura N.I., Sunyaev R.A., 1973, A&A, 24, 337
- (75) Shakura N.I., Sunyaev R.A., 1976, MNRAS, 175, 613
- (76) Shimura T., Takahara F., 1995, ApJ, 445, 780
- (77) Sobolewska M., Życki P.T., 2003, A&A, 400, 553
- (78) Soria R., Puchnarewicz E.M., 2002, MNRAS, 329, 456
- (79) Steenbrugge K.C., Kaastra J.S., de Vries C.P., Edelson R., 2003, astro-ph/0302494
- (80) Svensson R., Zdziarski A.A., 1994, ApJ, 436, 599
- (81) Szuszkiewicz E., 1990, MNRAS, 244, 377
- (82) Szuszkiewicz E., Miller J.C., 1998, MNRAS, 298, 888
- (83) Szuszkiewicz E., Miller J.C., 2001, MNRAS, 328, 36
- (84) Tanaka Y., Nandra K., Fabian A.C., Inoue H., Otani C. et al., 1995, Nat., 375, 659
- (85) Tripp T.M., Bechtold J., Green R.F., 1994, ApJ 433, 533
- (86) Turner T.J., George I.M., Yaqoob T., Kriss G., Crenshaw D.M., Kraemer S. et al., 2001, ApJ, 548, L13
- (87) Uttley P., McHardy I.M., Papadakis I.E., 2002, MNRAS, 332, 231
- (88) Vaughan S., Boller Th., Fabian A.C., Ballantyne D.R., Brandt W.N, Truemper J., 2002, MNRAS, 337, 247
- (89) Véron-Cetty M.P., Véron P., Gonçalves A.C., 2001, A&A, 372, 730
- (90) Walter R., Fink H.H., 1993, A&A, 274, 105
- (91) Woo J.-H., Urry C.M., 2002, ApJ, 579, 530
- (92) Zheng W., Kriss G.A., Telfer R.C., Grimes J.P., Davidsen A.F., 1997, ApJ, 475, 469