Searching for unknown open clusters in the Tycho-2 catalog ††thanks: Based on observations of the ESA Hipparcos satellite
We present 11 new open cluster candidates found in a systematic search for unknown star clusters using the astrometric and photometric data included in the Tycho2 catalog. The possible existence of these stellar aggregates is supported by the analysis of proper motions, color-magnitude diagrams, stellar density distributions, and by the visual inspection of the Digitized Sky Survey (DSS) plates. With these tools we were able to determine mean absolute proper motions as well as preliminary reddenings, distances and ages for the majority of the candidates. We found that most of them are possibly nearby (closer than 600 pc) open clusters never studied before.
Key Words.:
Galaxy: open clusters and associations: general1 Introduction
The new generation of high precision astrometric catalogs such as Hipparcos (ESA 1997) and Tycho2 (Høg et al. 2000) offers an important opportunity to study the kinematics of the nearby known open clusters and associations (Dias et al. 2001; Baumgardt et al. 2000; Robichon et al. 1999; de Zeeuw et al. 1999). Moreover, these catalogs also provide data for systematic searches for new open cluster candidates based on proper motions and trigonometric parallaxes (Platais et al. 1998).
In this work, we present the first results of a search for previously unknown open clusters in the solar neighborhood. The search is based on the analysis of observational data (proper motions, photometry and images) provided by the Tycho2 catalog, and by the Digitized Sky Survey (DSS) plates.
The cluster candidates described here are all previously unknown, or at least unlisted, according to the the most up-to-date catalog of open clusters presently available (Dias et al. 2002). The objects were named Alessi 1, 2, 3, etc, sorted by right ascension. These clusters are all large (20′ - 110′), rather bright and poor, indicating that they are possibly nearby sparse clusters or some sort of Open Cluster Remnants (hereafter OCR). As we will show later on, most candidates are possible nearby objects, closer than 600 pc. This is interesting because it enlarges the sample of nearby open clusters, and also because of the increasing interest in clusters in late stages of dissolution, as demonstrated by the recent studies of POCRs - Possible Open Cluster Remnants - performed by Bica et al. (2001), and the controversial cases of NGC~1252 (Baumgardt 1998; Pavani et al. 2001) and NGC~6994 (Odenkirchen & Soubiran 2002; Carraro 2000; Bassino et al. 2000).
2 Cluster search and analysis strategy
A stellar field in which an open cluster is present, exhibits a number of particular characteristics which reveal its existence. The cluster members are within a limited volume, resulting in an increased stellar density when compared to the surrounding field. Furthermore, they display similar radial velocities and proper motions, which produce clumps in phase space, and have the same age, chemical composition and a broad range in mass, which produce distinctive sequences in a color-magnitude diagram. So, in theory, it is possible to distinguish cluster members from field stars in a certain region of the sky. One should, however, be careful about jumping into conclusions solely based on one of these characteristics: star counts, common proper motions, or apparent cluster sequences in the color-magnitude diagram. In fact, extinction patterns or chance alignment of bright stars along the same approximate line-of-sight can give the illusion of the presence of a cluster. Also, certain combinations of stellar populations and reddening can produce sequences in the color-magnitude diagram that can be confused with a cluster sequence.
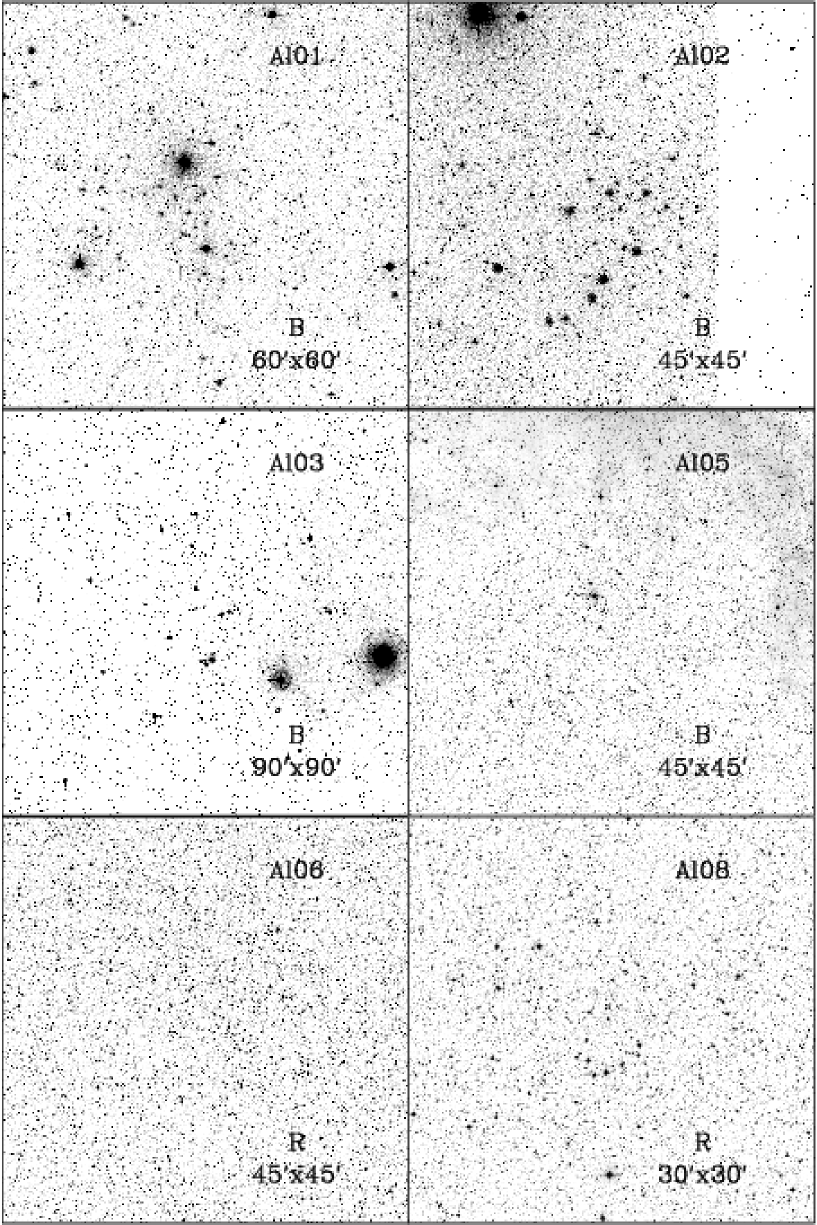
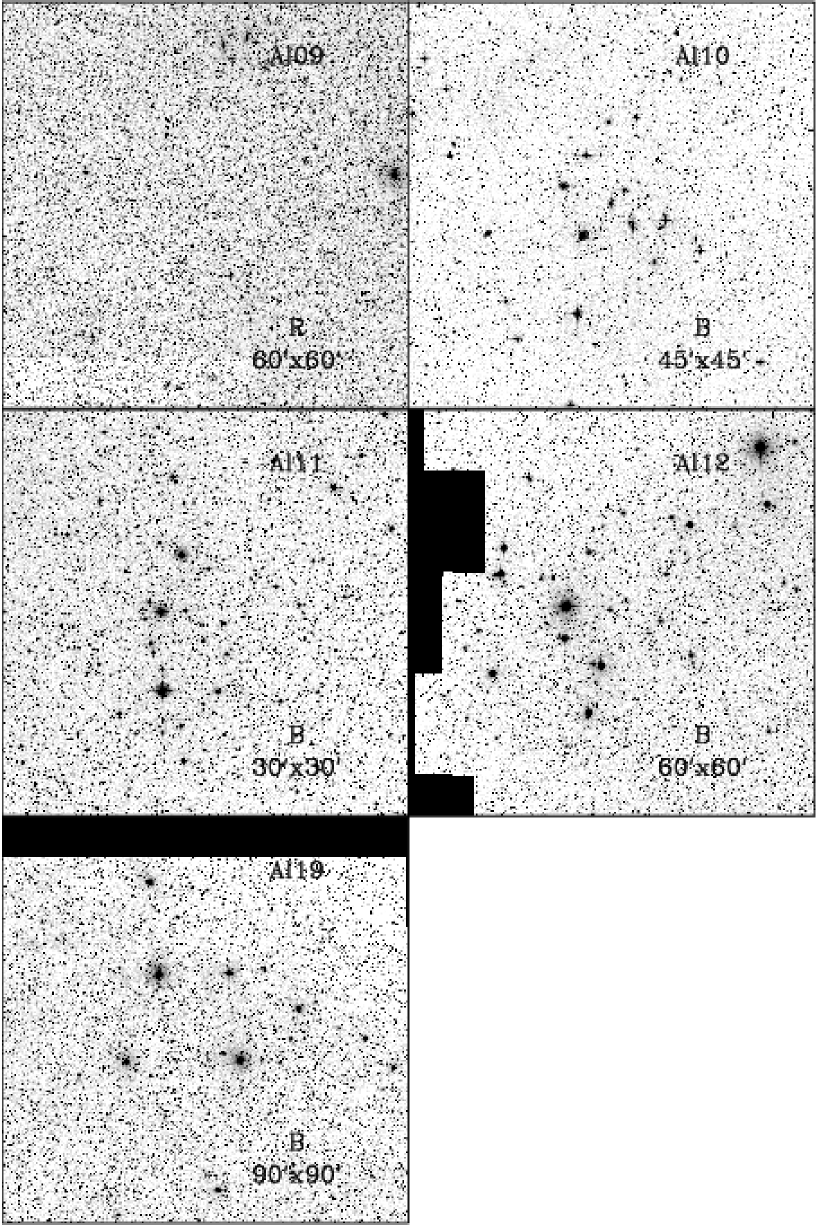
We started by searching the Tycho2 catalog for groups of bright stars that show simultaneously a small deviation in proper motions and a noticeable enhancement in the local stellar density. As a result, several fields were selected as containing potential open cluster candidates. These fields were then visually inspected in the DSS plates, and those seeming to host actual clusters were included in a final list of open cluster candidates. The DSS images of two of the selected fields (Alessi~6 and 9) show no obvious concentrations of stars. These two cases will be discussed below. The finding charts for the selected objects are shown in Figs. 1 and 2.
Then, for each field, individual membership probabilities were determined by applying the statistical method of Sanders (1971) to the Tycho2 proper motions. For further details on the method and its utilization we refer the reader to papers such as Dias et al. (2001), among others.
For 10 of the 11 objects studied here, we found significant results for the statistical analysis of proper motions, as well as a good separation between the cluster and field populations in the proper motion vector-point diagrams (hereafter VPD). The VPDs are shown in Fig. 3.
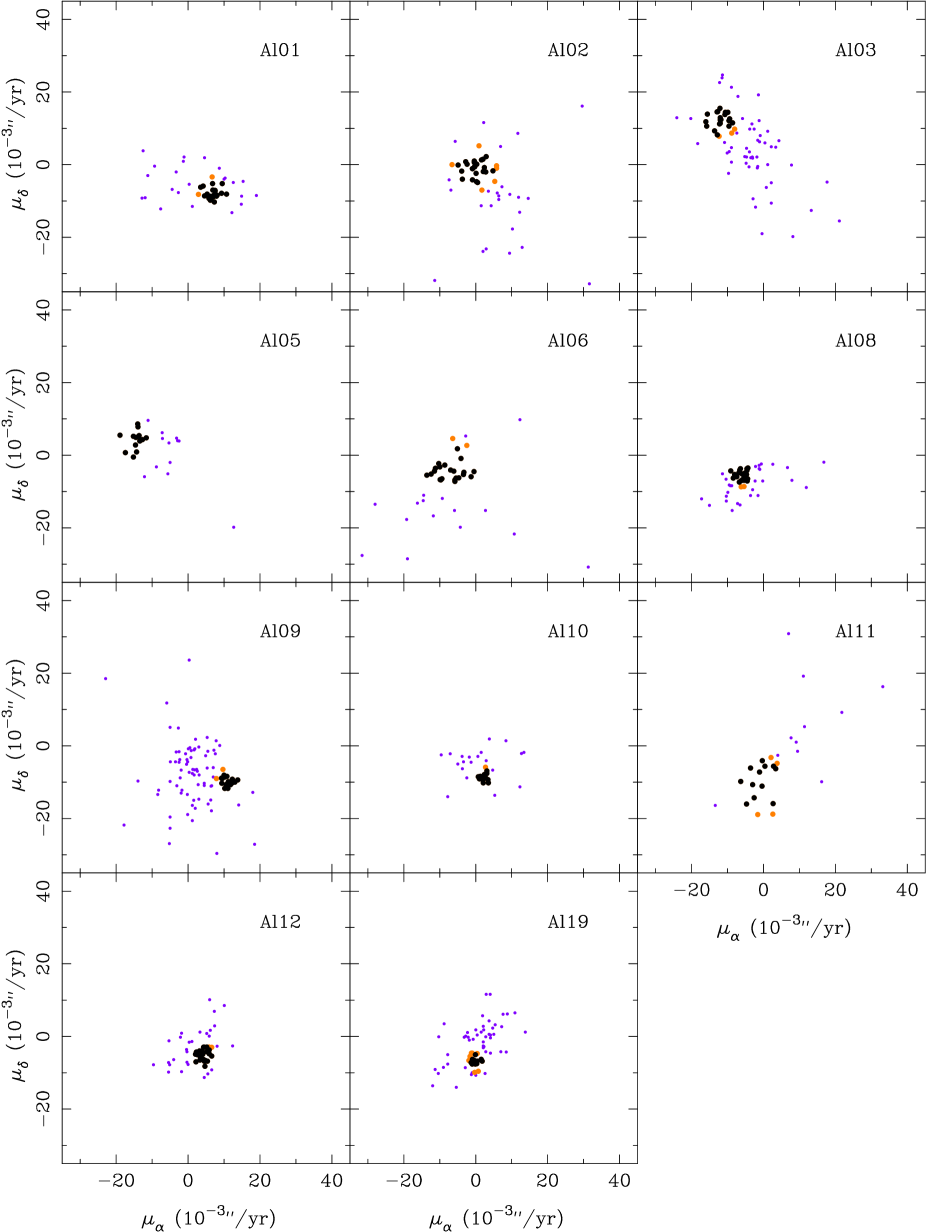
The validity of the VPD analysis was tested by comparing to a number of control fields. For each candidate field we took four nearby fields (north, south, east, west) 2 cluster radii from the center. These comparison fields were selected with the same diameter of the probable cluster. For most objects we found a good contrast between the candidate VPD and the control fields’ VPDs, further assessing that the feature observed in the candidate VPD could correspond to an open cluster.
As mentioned in the beginning of this section, another indicator of the presence of a stellar aggregate is an enhancement of the stellar density with respect to the surrounding field. We have plotted the Radial Density Profile Diagrams (hereafter RDPs) shown in Fig. 4 to address this point. The construction of the RDP requires the determination of the central coordinates of each cluster candidate. For this purpose, marginal distributions in RA and DEC were built using Tycho2 stars with membership probability higher than , and brighter than mag (Tycho2 is 90 complete in this range). The central coordinates were then taken to be the highest peaks exhibited in each marginal distribution.
The RDPs were built using the same selection criteria (Tycho2 stars with membership probability higher than , and brighter than mag). The same selection criteria were also applied to each of the 4 control fields in order to derive their mean densities. Densities were calculated by counting stars in a number of concentric rings and then dividing the counts by the area of the ring. For each RDP, we have also plotted a line indicating the average value of the densities of the four nearby control fields above mentioned. Although we are dealing with small numbers and the statistical fluctuations are high, we have used the proper motion criteria to isolate the potential cluster members from the field stars. Thus, we considered a concentration of stars with similar motions around the candidate cluster center as an indication of the presence of a cluster. All the candidates display clear over-densities of Tycho2 stars. A further check on the first and second generation DSS images also reveals all, but two objects (Alessi~6, 9) as slight concentrations of bright stars, corroborating the results from the RDP analysis. Despite not being evident in the DSS images, Alessi~6 and 9 have been included in the final list of candidates presented in this article. Alessi~6 is an interesting case because it could be related to the open cluster BH~164. As for Alessi~9, all the results indicate the presence of a genuine open cluster.
The field levels of the RDPs (horizontal line in Fig. 4) are not exactly zero as would be expected if we were using only members. This is because the RDPs were built using stars with membership probability , so some field interlopers are still present. Each candidate’s radius was estimated from the RDP as the radius where the density profile reaches the mean density of its control fields. Due to the limited photometric depth of the Tycho2 data, these radii will not include the cluster coronae and should therefore be considered as lower limits.
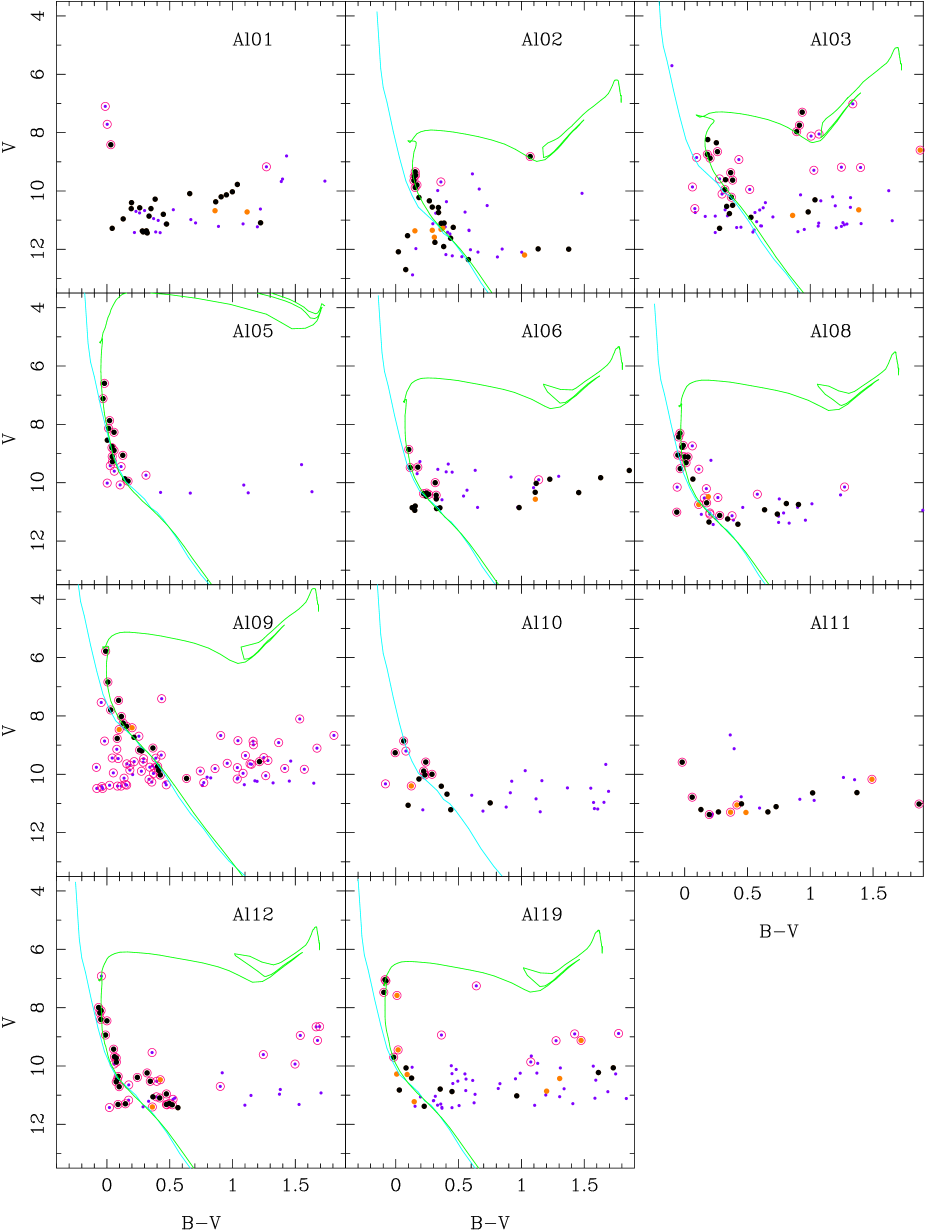
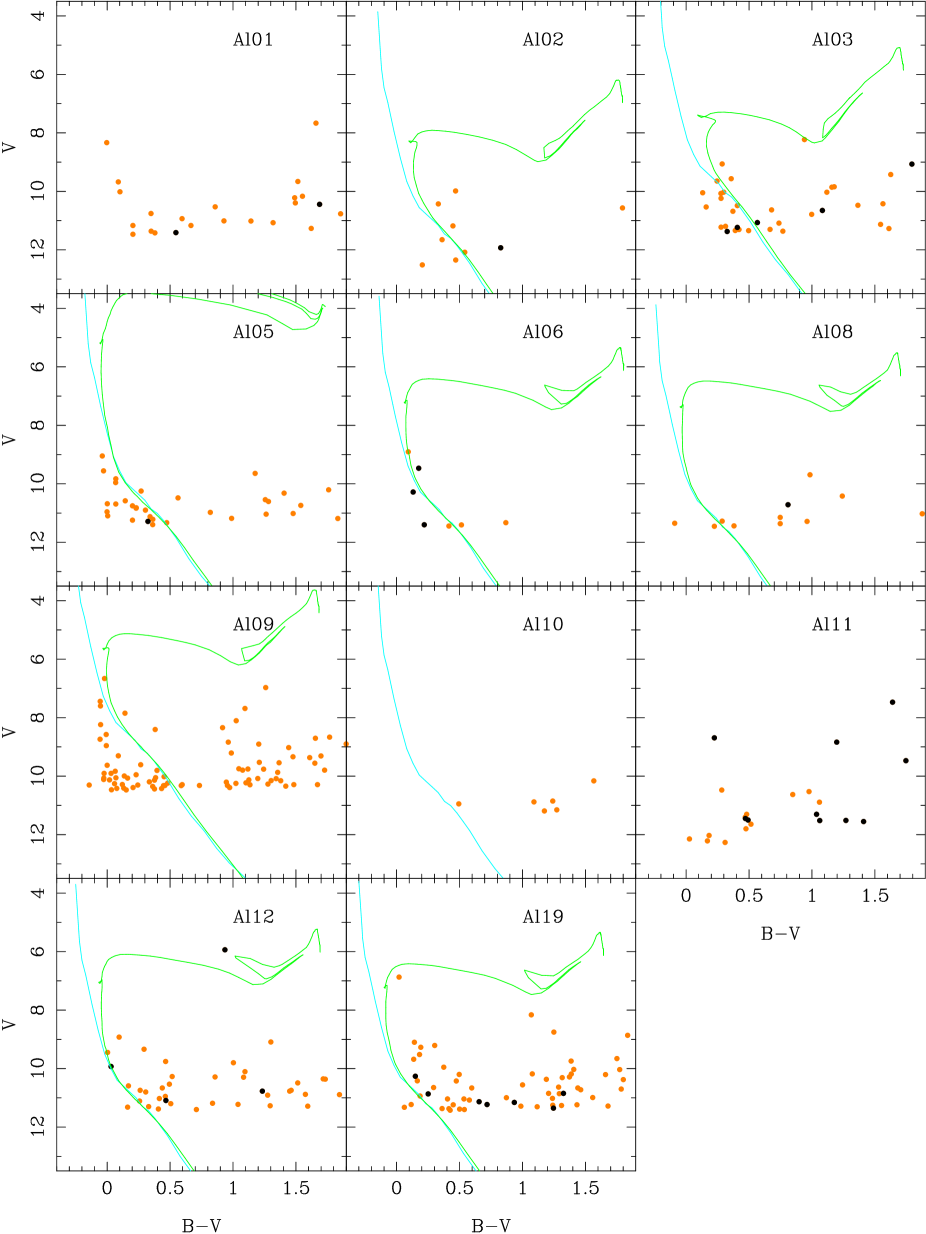
The next step was to perform a photometric analysis. Color-magnitude diagrams (Fig. 5; hereafter CMDs) of the cluster fields were plotted using the Tycho2 BV photometry transformed to the Johnson system using the relations given in the Hipparcos catalog. Membership probabilities were used to select the probable cluster members, reducing the effects of contamination by field stars and allowing the construction of clearer CMDs. For 7 of the 11 candidates we found good CMDs, for 2 we have hints of a main sequence (MS), and for 2 we do not identify any sign of a MS. Nevertheless, although the Tycho2 magnitudes are reasonably precise for the brighter stars (), for the fainter ones the errors in B and V become large yielding almost useless colors for greater than . So our failure to identify a MS does not necessarily reflect the nonexistence of a cluster.
For each candidate field, there were some stars with published spectral types. These were used to derive intrinsic colors by interpolating over the tables relating spectral types and colors given by Schmidt-Kaler (1982), taking care not to use stars with peculiar spectral features (Be, Ap, etc). Once the intrinsic colors were determined, individual color excesses were computed. The color excess distributions of the member stars were then used in deriving the mean reddenings for the candidate clusters. In a similar fashion, the spectral types were used to estimate the absolute magnitudes, and from there the apparent and absolute distance moduli distributions. However, contrary to the reddening determination, where stars were used regardless of their luminosity class, only stars of luminosity class V (dwarfs) were used in the distance determination. Also, although the reddening values obtained from spectral types are quite precise, the distances are much more uncertain. Using the distance to the cluster derived from spectral types as a rough estimate, we then refined the determination via ZAMS fitting in the CMD. The errors in the derived reddenings, distances and ages have been estimated by applying the sames procedures to a few well studied clusters (Blanco~1, IC~2391, Pleiades, NGC~1662 and NGC~7092). The comparison of our values with those derived from previous detailed studies has allowed us to estimate mag, and .
Fig. 5 shows the CMDs for the 11 fields under study. We have superimposed the Schmidt-Kaler (1982) ZAMS and solar composition isochrones from Girardi et al. (2000) shifted to account for the effects of reddening and distance. Further comments on the fits (reddening, distance and age) will be given below in Sect. 3 when discussing each cluster.
As done for the RDPs and VPDs, each candidate CMD was compared to 4 control fields, 2 cluster radii from the center, adopting the same limiting magnitude. The combined N,S,E,W control fields’ CMDs are shown in Fig. 6. In order to produce diagrams with stars covering the same effective area as the clusters’ CMDs and make the comparisons more meaningful, a radius of half a cluster radius was used for each of the N,S,E,W fields. Stars with P% are plotted in black while all the others are plotted in a lighter tone. The ZAMS and isochrones that delineate the sequence detected in the clusters’ CMDs have also been plotted. It is readily seen that the control fields do not exhibit the sequences seen in the clusters’ CMDs. In some cases there is an occasional “member” that appears on top of, or very close to, the reference lines. The number of “members” in the control fields is small in all cases (they could be interlopers or even cluster stars that escaped), and do not define the more populated sequences seen in the cluster candidates’ CMDs.

3 Discussion and results
In this section, we discuss each of the 11 investigated fields. The main results are summarized in Tabs. 1 and 2.
In Tab. 1 we present the candidates’ positions, angular diameters, reddenings, distances and ages, plus the derived linear diameters and velocity dispersions. The adopted procedures were described in Sect. 2 and the results confirm that if real, the clusters are likely to be situated in the solar vicinity. The results from the kinematic analysis are given in Tab. 2. Finally, in Tab. 3 we list the Hipparcos members found in the regions of several candidates. The identification of possible Hipparcos members allows us to estimate the distance to these objects in a different way. Because of the small number of such stars, the mean cluster parallax was simply taken as the mean of the individual stellar parallaxes, and no special corrections were applied. When only one measurement was available, it was adopted as the cluster parallax. The distances obtained from the CMDs are also listed for comparison purposes. Some clusterings (Alessi~2, 6, 12, 19) had Hipparcos members in their fields with large errors due to their small (or even negative) parallaxes. These stars are also listed in Tab. 3 for the sake of completeness. Overall, despite that the small number and precision of the parallaxes of member stars does not allow rigorous distance determinations, they do provide a very useful consistency check of the photometrically derived distances.
Considering together the results obtained from each point of view - astrometric, photometric and star counts - nearly all the investigated fields show signs of the existence of open clusters. Except for 2 fields (Alessi~1 and 11) all the candidates show signs of a cluster sequence in the CMD, while the comparison fields show nothing. A final conclusion regarding the true nature and parameters of the clusterings will require, however, more precise and deeper photometry.
We will now proceed to discuss each of the 11 investigated fields.
| Name | d | D | Disp | ||||||||
|---|---|---|---|---|---|---|---|---|---|---|---|
| (′) | (pc) | (pc) | () | ||||||||
| Alessi~1 | 54 | ||||||||||
| Alessi~2 | 36 | 500 | 8.50 | 0.18 | 8.50 | 5.2 | 6.6 | ||||
| Alessi~3 | 72 | 290 | 7.30 | 0.11 | 8.70 | 6.1 | 2.9 | ||||
| Alessi~5 | 36 | 400 | 8.00 | 0.15 | 7.60 | 4.2 | 4.2 | ||||
| Alessi~6 | 36 | 440 | 8.20 | 0.19 | 8.20 | 4.6 | 7.0 | ||||
| Alessi~8 | 24 | 570 | 8.80 | 0.09 | 8.15 | 4.0 | 4.6 | ||||
| Alessi~9 | 144 | 190 | 6.45 | 0.07 | 8.40 | 8.0 | 1.1 | ||||
| Alessi~10 | 36 | 380 | 7.90 | 0.18 | 4.0 | 2.0 | |||||
| Alessi~11 | 28 | ||||||||||
| Alessi~12 | 64 | 540 | 8.65 | 0.08 | 8.10 | 10.1 | 3.5 | ||||
| Alessi~19 | 84 | 550 | 8.70 | 0.03 | 8.20 | 13.4 | 4.1 |
| Cluster | Field | |||||||||
|---|---|---|---|---|---|---|---|---|---|---|
| Region | ||||||||||
| Alessi~1 | 6.7 | -7.8 | 1.7 | 28 | 2.2 | -5.3 | 10.3 | 5.8 | 19 | 278.0 |
| Alessi~2 | 0.2 | -1.1 | 2.8 | 23 | 6.2 | -9.5 | 11.7 | 14.6 | 33 | 77.9 |
| Alessi~3 | -11.5 | 12.4 | 2.1 | 22 | -3.8 | 4.4 | 12.7 | 11.6 | 55 | 35.2 |
| Alessi~5 | -14.3 | 4.4 | 2.2 | 13 | -5.4 | 0.1 | 7.8 | 9.8 | 13 | 335.1 |
| Alessi~6 | -7.3 | -4.3 | 3.4 | 18 | -9.2 | -14.1 | 19.8 | 17.0 | 23 | 244.5 |
| Alessi~8 | -6.1 | -5.8 | 1.7 | 22 | -3.8 | -7.8 | 8.5 | 5.0 | 28 | 255.7 |
| Alessi~9 | 10.9 | -9.7 | 1.3 | 21 | 1.0 | -9.8 | 10.5 | 13.4 | 78 | 74.6 |
| Alessi~10 | 2.3 | -8.6 | 1.1 | 17 | 0.9 | -4.8 | 6.7 | 4.4 | 16 | 268.0 |
| Alessi~11 | -0.3 | -9.6 | 4.4 | 12 | 8.4 | 1.5 | 16.2 | 16.6 | 15 | 133.1 |
| Alessi~12 | 4.3 | -5.3 | 1.4 | 28 | 2.0 | -2.9 | 7.1 | 6.2 | 28 | 161.8 |
| Alessi~19 | 0.4 | -6.6 | 1.6 | 18 | 1.2 | -2.5 | 8.2 | 7.3 | 52 | 147.5 |
| Name | HIP | Plx | ePlx | P | Par | d | d(CMD) | |
|---|---|---|---|---|---|---|---|---|
| Alessi~2 | 22283 | -0.54 | 1.67 | 94 | 500 | |||
| Alessi~3 | :35207 | AB | 2.79 | 1.02 | 85 | 4.17 | 240 | 290 |
| 34974 | 4.17 | 0.59 | 88 | |||||
| Alessi~5 | :52436 | AC | 3.86 | 1.08 | 95 | 3.11 | 320 | 400 |
| :52437 | B | 5.89 | 3.59 | 83 | ||||
| 52534 | 3.11 | 0.84 | 96 | |||||
| Alessi~6 | 71613 | 0.19 | 1.20 | 92 | 440 | |||
| 71560 | -1.34 | 1.91 | 92 | |||||
| 71674 | -1.38 | 1.62 | 89 | |||||
| 71435 | -2.05 | 1.29 | 91 | |||||
| Alessi~9 | 86552 | 4.94 | 0.90 | 95 | 4.94 | 200 | 190 | |
| :86658 | AB | 5.59 | 2.62 | 84 | ||||
| Alessi~10 | 98899 | 2.72 | 1.39 | 97 | 2.82 | 355 | 380 | |
| 98904 | 2.92 | 1.71 | 39 | |||||
| Alessi~12 | 102277 | 0.62 | 0.89 | 92 | 540 | |||
| 102374 | 0.22 | 0.84 | 90 | |||||
| 102287 | 0.95 | 0.91 | 91 | |||||
| Alessi~19 | 89767 | 0.50 | 0.78 | 81 | 550 | |||
| 89665 | 1.56 | 0.83 | 76 | |||||
| 89798 | 1.03 | 0.88 | 67 | |||||
| 89776 | 1.07 | 0.96 | 81 | |||||
3.1 Alessi~1
This candidate is a large (), isolated group of stars located relatively far from the Galactic plane (). It stands fairly well in the DSS image (Fig. 1), and shows significant features in both the RDP and VPD diagrams. All this evidence points to the presence of an open cluster. In fact, the kinematic analysis yielded 28 probable members.
The photometric result is not good since the CMD presented in Fig. 5 does not exhibit any cluster sequence. Instead, we find one bright member followed by a gap of mag and then number of fainter stars badly spread out in the CMD. These fainter stars have or fainter than 10.5 mag, so the scatter is expected to be mainly a result of the photometric precision of the Tycho2 data. A final confirmation of the reality of this cluster and the determination of its fundamental parameters will require deeper and more precise photometric data.
3.2 Alessi~2
Alessi~2 resembles a slightly fainter and smaller version of Alessi~1 in the DSS image (Fig. 1). The VPD (Fig. 3) shows a noticeable concentration centered nearly at the 0,0 point. The RDP (Fig. 4) shows a significant over-density in the cluster core when compared to the control fields. Despite its faintness, the CMD (Fig. 5) is fairly well defined with a visible main-sequence, turn-off and even one star considered as member in the giant branch.
The only Hipparcos member in the field happens to have a negative parallax (see Tab. 3). We note, however, that the distance estimated from the CMD is 500 pc, for which the errors in the Hipparcos parallaxes are greater than 100% (distance greater than 400 pc) and therefore negative parallaxes are expected. In this sense, although useless in providing an independent distance estimate, the small (in this case, negative) parallax is consistent with the CMD derived distance.
3.3 Alessi~3
Alessi~3 stands out as a chain of bright stars that dominates the entire 90 arcmin of the DSS image (Fig. 1). As Alessi~1, this candidate lies far from the plane of Milkyway with pc. The region has a nice VPD (Fig. 3) with a clear separation between cluster members and field stars. The RDP (Fig. 4) also agrees well with the existence of a concentration of kinematically related stars. Although somewhat scattered, the CMD (Fig. 5) shows the characteristic features expected for a cluster: a main sequence, a turn-off and three stars considered members in the giant branch. The photometric analysis yields Alessi~3 as the oldest cluster candidate in the sample with probably half a billion years.
The field contains two Hipparcos stars considered as members but with very different parallaxes (see Tab. 3). One of them, HIP35207AB, belongs to a multiple system so we expect its parallax not to be so reliable. Based on the other star, HIP34974, we find a distance of 240 pc which is in excellent agreement with the 290 pc derived photometrically.
A subsequent verification in Tycho2 shows probable members out to a diameter of 80′ or even more, including two other Hipparcos (giant) stars which are also possible members. This is not surprising since this candidate is presumably a nearby one.
3.4 Alessi~5
Apparently, this is the most compact candidate in the investigated sample. It appears in the DSS plates (Fig. 1) as a few bright stars concentrated around the bright multiple star DUN~97 (HIP~52437) and seen in projection against a crowded area of the Carina arm. The concentration of stars is easily seen as the sharp central peak displayed by its RDP (Fig. 4). Its VPD (Fig. 3) shows an evident, although poor, concentration of members.
The CMD (Fig. 5) shows a clear main sequence. The absence of stars in the giant branch and a nearly vertical main sequence containing mainly B3-B8 stars are indicative of a young aggregate. As with many young open clusters, the absence of clear evolutionary features together with poor statistics result in somewhat uncertain age determinations. There are three Hipparcos members (Tab. 3) in the Alessi~5 region and the distance estimated from their parallaxes (320 pc) is consistent with the photometric distance (400 pc). We do note, however, that two of the Hipparcos stars are multiple systems that present large errors in their parallaxes.
It is interesting to point out that the nearby classical cepheid EY~Car (HIP~52380) is certainly not a member of Alessi~5 despite the coincidence of its kinematic parameters in the Hipparcos catalog ( mas/yr and mas/yr). According to the distance determined by Berdnikov et al. (2000) (2.02 kpc) this cepheid is located behind of the candidate, probably in the Carina arm.
3.5 Alessi~6
The DSS image of the field of Alessi~6 (Fig. 1) does not reveal any evident clustering of stars. Interestingly, the VPD analysis allowed to identify a clump of stars with high membership probabilities whose RDP (Fig. 4) reveals a significant spatial concentration of stars with similar kinematics. Although the concentration in the VPD (Fig. 3) is not very tight, the statistical solution is compatible with the existence of an open cluster, and there is a good separation between the distribution of the stars considered as members and the field population.
The CMD (Fig. 5) shows a poorly populated cluster sequence with no clear evolutionary features, which makes the derived age quite uncertain. As with most of the fields presented in this work, the scatter in the lower MS is likely to be due mainly to photometric errors, although the redder stars could be field giant interlopers.
Similarly to Alessi~2, the Hipparcos members in the field have large errors, being most of them negative. Again, no useful distance can be derived from the parallaxes although they do support the indication given by the CMD that Alessi~6 is beyond 400 pc.
The cluster candidate Alessi~6 is an interesting case because it forms a close pair with the nearby cluster BH~164 (the centers of both aggregates are 51′ apart). Curiously, the Lyngå (1987) coordinates of BH~164, taken from van den Bergh & Hagen (1975), show no evidence of a cluster. New coordinates, fundamental parameters and mean absolute proper motions of BH~164 have been recently determined by Moitinho et al. (2003) and by Kharchenko et al. (2003). Both studies were based on Tycho2 data.
Besides their small separation, both clusters have similar ages and are located at 440 pc (Moitinho et al. 2003) which corresponds to a separation of about 15 pc. Their close distance could indicate a real physical relation between both groups of stars. On the other hand, Kharchenko et al. (2003) puts BH~164 at a distance of 540 pc, which would imply that it is not physically related to Alessi~6. Despite the different distance determinations, both studies give similar proper motions for BH~164 ( mas/yr; mas/yr), which are not very different from those estimated for Alessi~6 ( mas/yr; mas/yr). A final word regarding the true nature of the possible pair BH~164/Alessi~6 will require deeper photometric data and radial velocities for both clusters.
3.6 Alessi~8
This is a possible poor cluster in the Lupus-Norma border. Alessi~8 is seen in the DSS image (Fig. 1) as a compact arc of a few bright stars surrounded by fainter stars almost not detached from the background.
3.7 Alessi~9
Despite not being easily seen in the DSS image (Fig. 2), Alessi~9 is from all points of view (astrometric, photometric and star counts) one of the best candidates studied here. The RDP (Fig. 4) shows an obvious concentration of stars and the VPD (Fig. 3) exhibits a clear segregation of the cluster and field populations. Due to the aggregate’s large extent (about ) and richness of the Milkyway background, only Tycho2 stars brighter than where considered in the astrometric analysis in order to reduce the contamination by field stars. The CMD (Fig. 5) has a well defined morphology (ZAMS and turn-off) that indicate the existence of a true open cluster and allow to obtain good reddening, distance and age estimates. We find that Alessi~9 is the nearest (190 pc) open cluster in the sample.
Two interesting Hipparcos stars were found in the region of the cluster (see Tab. 3): one analyzed member (HIP~86552) and one possible member (HIP~86658) that is a Lyr type eclipsing binary. Comparison of the distance obtained from the CMD analysis and that provided by the Hipparcos parallaxes shows a good agreement between both values.
3.8 Alessi~10
This is a very isolated group of late and early stars situated far from the Galactic plane ( pc), in a poor field with almost nothing but faint anonymous galaxies. It stands as a chain of bright stars in the DSS image (Fig. 2). This group is very interesting because its VPD (Fig. 3) shows one of the best separations between field and cluster populations in the sample of candidates presented here. Its RDP (Fig. 4) shows a clear density enhancement of kinematically related stars relative to its very underpopulated background. The CMD shown in Fig. 5 is not very clear, exhibiting considerable spreading, which results in rather uncertain estimates of both reddening and distance and no age estimate. Despite the limited quality of the data, analysis of the published spectral types for the 8 brightest members seems to indicate that the scatter could be due to variable reddening. A more conclusive analysis will require more and deeper astrometric and photometric data. Nevertheless, the existence of a physical cluster seems to be the best explanation for the presence of a tight group of kinematically similar early type stars far from the Galactic plane.
The field of Alessi~10 also hosts two Hipparcos stars (HIP~98899 and HIP~98904) with high membership probabilities. Once again we find a good agreement between the distance obtained from the Hipparcos parallaxes of these two stars and that derived from the photometric data and spectral types. Although the number of detected members is small, we do find a few possible members inside an area of nearly one degree, almost twice the cluster’s estimated diameter.
3.9 Alessi~11
This group lies in an interesting field with three relatively bright variable stars in its radius and a fourth one in the immediate vicinity: BX~Del a pop II cepheid; BW~Del an eclipsing algol-type binary; UV~Del a semi-regular and GR~Sge an irregular variable. The available studies of these stars do not allow us to assess the possibility of their association to Alessi~11. According to the only information found in the literature, BX~Del is at a distance of 1.355 kpc (Beers & Sommer-Larsen 1995).
The analyzed group of stars is not well detached from the background as its RDP indicates (Fig. 4). The VPD shows a large scatter which is expressed in the standard deviation obtained by the statistical analysis (Tab. 2). Even more dramatically than in the case of Alessi~1, the faint magnitudes of the Tycho2 stars render a useless CMD for Alessi~11, allowing no estimates of reddening, distance or age.
Due to the limitations of the present dataset, the nature of Alessi~11 remains quite doubtful, although the RDP seems to support the existence of a cluster, and so does the kinematic analysis (at least marginally).
3.10 Alessi~12
Alessi~12 is a large () sparse group of the stars, as seen in the DSS image (Fig. 2). Nevertheless, its RDP (Fig. 4) shows an evident concentration of kinematically related stars well above the background. The VPD (Fig. 3) also displays a good separation between the cluster and field populations. The CMD (Fig. 5) displays a well defined main sequence and turn-off which allow us to be fairly confident on the estimated reddening, distance and age.
The field of Alessi~12 contains three Hipparcos proper motion members (see Tab 3). Again, as with Alessi~2 and 6, the errors in the parallaxes are higher than 100%, which we take as indicative of a distance greater than pc.
3.11 Alessi~19
This is another very large group of bright stars. Its RDP reveals an evident concentration of kinematically related stars and the VPD shows a very small dispersion and good separation between members and non-members. The CMD, however, is not very clear since it is poor and exhibits a large gap that results in a not well defined ZAMS and turn-off. The large derived diameter of 14 pc is not characteristic of a standard open cluster and may indicate that Alessi~19 could be possibly a loose association.
The 4 Hipparcos members presented in Tab. 3 have errors close to 100% in their parallaxes and do not allow a usefull distance estimate. Once more, as in the cases of Alessi~2, 6, and 12, we take this as indicative of a possible stellar aggregate located at a distance greater than , which is consistent with the 550 pc derived from the CMD.
4 Summary
The Sanders technique applied to the Tycho2 proper motions has proved to be a powerful tool to search for new, bright and nearby open cluster candidates.
Radial density profiles, built using stars sharing similar proper motions, have revealed the existence of 11 previously undetected star clusterings. Because the stars in each cluster candidate have similar kinematics, their spatial concentration is not likely due to projection or extinction effects. In order to verify whether these concentrations correspond to real open clusters, CMDs were built using Tycho2 photometry. Except for two objects (Alessi~1 and 11), we have been able to identify cluster sequences, further assessing the reality of the stellar aggregates. The kinematic analysis yielded the candidates’ mean proper motions and membership probabilities. The CMDs together with published spectral types have allowed us to obtain preliminary estimates of their reddenings, distances and ages. We found that all the studied objects have diameters larger than and are closer than 0.6 kpc, which puts them in the solar vicinity. They are also relatively young or of intermediate age.
Regarding the nature of the open cluster candidates, we find that Alessi 2, 3, 5, 6, 8, 9, 10 and 12 are likely open clusters. Alessi 19 is a possible loose cluster or association and finally, Alessi 1 and 11 are ambiguous cases that need more and deeper data before reaching any further conclusion.
The characteristics of most of the studied clusters (morphology, poor core with the presence of remote members, among others) could indicate that some of them are dissolving clusters. We expect that more data (deeper imaging and radial velocities) will allow to establish if some of the clusters are indeed OCRs, and if so, whether they have been dissolved by natural dynamical evolution, or by striping due to encounters with giant interstellar clouds or tidal interactions with the Galactic disk.
Acknowledgements.
The authors wish to thank J.R.D. Lépine for reading and commenting the manuscript, and the anonymous referee whose comments helped making the text clearer and more precise. Extensive use has been made of the SIMBAD, WEBDA and DSS databases and of the Sky Charts (http://astrosurf.com/astropc/) facility. AM acknowledges financial support by CONACyT (Mexico; project I33940-E), DGAPA (Mexico; project IN111500), and FCT (Portugal; grant BPD/20193/99). WSD is supported by FAPESP (grant number 99/11781-4).References
- Bassino et al. (2000) Bassino, L. P., Waldhausen, S., & Martínez, R. E. 2000, A&A, 355, 138
- Baumgardt (1998) Baumgardt, H. 1998, A&A, 340, 402
- Baumgardt et al. (2000) Baumgardt, H., Dettbarn, C., & Wielen, R. 2000, A&AS, 146, 251
- Beers & Sommer-Larsen (1995) Beers, T. C. & Sommer-Larsen, J. 1995, ApJS, 96, 175
- Berdnikov et al. (2000) Berdnikov, L. N., Dambis, A. K., & Vozyakova, O. V. 2000, A&AS, 143, 211
- Bica et al. (2001) Bica, E., Santiago, B. X., Dutra, C. M., Dottori, H., de Oliveira, M. R., & Pavani, D. 2001, A&A, 366, 827
- Carraro (2000) Carraro, G. 2000, A&A, 357, 145
- de Zeeuw et al. (1999) de Zeeuw, P. T., Hoogerwerf, R., de Bruijne, J. H. J., Brown, A. G. A., & Blaauw, A. 1999, AJ, 117, 354
- Dias et al. (2002) Dias, W. S., Alessi, B. S., Moitinho, A., & Lépine, J. R. D. 2002, A&A, 389, 871
- Dias et al. (2001) Dias, W. S., Lépine, J. R. D., & Alessi, B. S. 2001, A&A, 376, 441
- ESA (1997) ESA. 1997, The Hipparcos and Tycho Catalogues (European Space Agency (ESA))
- Girardi et al. (2000) Girardi, L., Bressan, A., Bertelli, G., & Chiosi, C. 2000, A&AS, 141, 371
- Høg et al. (2000) Høg, E., Fabricius, C., Makarov, V. V., Urban, S., Corbin, T., Wycoff, G., Bastian, U., Schwekendiek, P., & Wicenec, A. 2000, A&A, 355, L27
- Kharchenko et al. (2003) Kharchenko, N. V., Pakulyak, L. K., & Piskunov, A. E. 2003, Astron. Rep., 47, 263
- Lyngå (1987) Lyngå, G. 1987, Computer Based Catalogue of Open Cluster Data, 5th ed. (Strasbourg: CDS)
- Moitinho et al. (2003) Moitinho, A., Alessi, B. S., & Dias, W. S. 2003, proc. JENAM in press
- Odenkirchen & Soubiran (2002) Odenkirchen, M. & Soubiran, C. 2002, A&A, 383, 163
- Pavani et al. (2001) Pavani, D. B., Bica, E., Dutra, C. M., Dottori, H., Santiago, B. X., Carranza, G., & Díaz, R. J. 2001, A&A, 374, 554
- Platais et al. (1998) Platais, I., Kozhurina-Platais, V., & van Leuwen, F. 1998, AJ, 116, 2423
- Robichon et al. (1999) Robichon, N., Arenou, F., Mermilliod, J.-C., & Turon, C. 1999, A&A, 345, 471
- Sanders (1971) Sanders, W. L. 1971, A&A, 14, 226
- Schmidt-Kaler (1982) Schmidt-Kaler, T. 1982, Landolt-Börnstein, Group VI, Vol. 2b, Stars and Star Clusters (Berlin: Springer), 15
- van den Bergh & Hagen (1975) van den Bergh, S. & Hagen, G. L. 1975, AJ, 80, 11