Gas and Dust in the Extremely Red Object ERO J164502+4626.4
Abstract
We report the first detection of the lowest CO transition in a sub-millimetre bright galaxy and extremely red object (ERO) at using the Very Large Array111The Very Large Array (VLA) is operated by the National Radio Observatory, which is a facility of the National Science Foundation, operated under cooperative agreement by Associated Universities, Inc.. The total line luminosity of ERO J164502+4626.4 is K km s-1 pc2, which yields a total molecular gas mass of . We also present a map of the 850-m continuum emission obtained using SCUBA, from which we infer a far-IR luminosity and dust mass of and . We find tentative evidence that the CO and sub-mm dust emission is extended over several tens of kpc. If confirmed by high-resolution imaging, this implies that ERO J164502+4626.4 is not simply a high redshift counterpart of a typical Ultra Luminous Infrared Galaxy (ULIRG).
1 Introduction
Observations of CO provide one of the most powerful methods of probing the interstellar medium (ISM) in galaxies – i.e. determining the amount of molecular gas available to fuel star formation and accretion onto active galactic nuclei (AGN), the two processes believed to generate the large far-infrared (far-IR) luminosities of star-forming galaxies (Sanders et al., 1991). The first detection of CO at high redshift (Brown and vanden Bout, 1991) revealed its potential to trace metal-enriched molecular gas in the early Universe. CO is thus key to our understanding of galaxy formation and evolution.
Extremely red objects (EROs - usually defined as galaxies with , e.g. Moriondo, Cimatti & Daddi 2000) constitute a bi-modal population - a combination of dusty, starbursting systems (Dey et al., 1999) and evolved ellipticals (Dunlop et al., 1996). While both types of objects appear similar in the optical/near-IR, the detection of sub-millimetre continuum emission and/or CO unambiguously pinpoints the dusty EROs. A significant fraction of the sub-mm-selected population of high-redshift dust-enshrouded starburst galaxies is believed to be associated with EROs (Smail et al., 1999). Since the advent of large-format bolometer arrays such as SCUBA (Holland et al., 1999) and MAMBO (Kreysa et al., 1998), over a hundred sources have been detected in (sub)millimetre surveys (Smail et al., 1997; Hughes et al., 1998; Bertoldi et al., 2001). In cases where optical/IR counterparts of sub-mm galaxies are available, it is found that the sources typically are distorted, multi-component systems with one or more components being an ERO (Ivison et al., 2002). The sub-mm population has a median redshift of (Chapman et al., 2003), and is widely believed to comprise the progenitors of present-day spheroids and massive ellipticals. At present, however, the molecular gas content of sub-mm selected galaxies remains largely unknown, and a systematic inventory of the molecular gas and its properties in these sources is required in order to properly address the question of their typical mass and evolutionary status. Of particular importance is the ratio of gas and dynamical masses in such objects, since it can help determine whether sub-mm galaxies are merely high-redshift analogues of local ultra luminous infra-red galaxies (ULIRGs) or massive, large-scale galaxy-formation events. The difficulties arise mainly because sub-mm selected galaxies have proved extremely difficult to identify in the optical (cf. Ivison et al. 1998, 2000). As a result only a handful of sub-mm selected galaxies have been detected in CO to date (Frayer et al., 1998, 1999; Ivison et al., 2001; Downes & Solomon, 2003; Genzel et al., 2003; Neri et al., 2003)
ERO J164502+4626.4 (Graham & Dey, 1996) was amongst the first EROs discovered by Hu & Ridgway (1994). Deep near-IR and optical spectroscopy of J164502 put it at a redshift of (Graham & Dey, 1996; Dey et al., 1999), and the detection of the H line and the [O II]3726,3729 doublet in its spectrum suggested that J164502 is an actively star-forming galaxy, possibly containing an AGN, and not an evolved elliptical at as initially suggested by Hu & Ridgway (1994). The presence of large amounts of dust was inferred from sub-mm observations by Cimatti et al. (1998) and Dey et al. (1999), the latter detecting J164502 in the continuum at 450, 850 and 1350 m. These observations together with detections of CO and by Andreani et al. (2000), which revealed the presence of large quantities of molecular gas, unamibiguously demonstrated that J164502 is a gas-rich dust-enshrouded starburst galaxy.
Here we present observations of the CO emission from J164502 using the VLA, providing the first detection of the lowest, and thus least excitation biased, CO line in a galaxy typical of the sub-mm population. We also present the 850-m SCUBA map of this source. Throughout this paper we have assumed km s-1 Mpc-1, and . In this cosmology the luminosity distance of J164502 is 11.2 Gpc and corresponds to 9.1 kpc.
2 Observations and data reduction
2.1 Very Large Array observations
At the CO line from J164502 falls within the VLA’s Q-band at 0.7 cm. The line widths of the CO and lines were km s-1 FWHM (Andreani et al., 2000), and a similar line width could be expected for the line. In order to cover the entire CO line, two adjacent 50 MHz IF pairs (left and right circular polarisation) were centred at 47.235 and 47.285 GHz giving 635 km s-1 of coverage. Measurements of J164502 in the radio have yielded Jy and Jy (Frayer, 1996). Fitting a power law spectrum to these data points yields a spectral index of . Adopting a more conservative spectrum with , we find that the extrapolated synchroton flux at 0.7 cm amounts to no more than Jy. Furthermore, the dust contributes by less than Jy at these wavelengths (Dey et al., 1999). Hence, any contribution from continuum emission is neglible and no continuum subtraction was necessary. Observations were obtained in D and C configurations (see Table 1). Due to bad weather, all the C-configuration data were of poor quality and discarded, leaving a total of 11.6 hr of observing time on source. The primary calibrator, 3C 286, was observed at the beginning and end of each observing run in order to fix the absolute flux density scale. Every 3-4 minutes the antennas were pointed toward a phase calibrator to ensure phase coherence throughout the run. This fast-switching technique resulted in a residual phase rms, after calibration, of less than . Calibration and data reduction was done using standard recipes in the NRAO Cookbook. D-configuration data taken at different times were combined using dbcon, weighting each dataset by its total gridded weight.
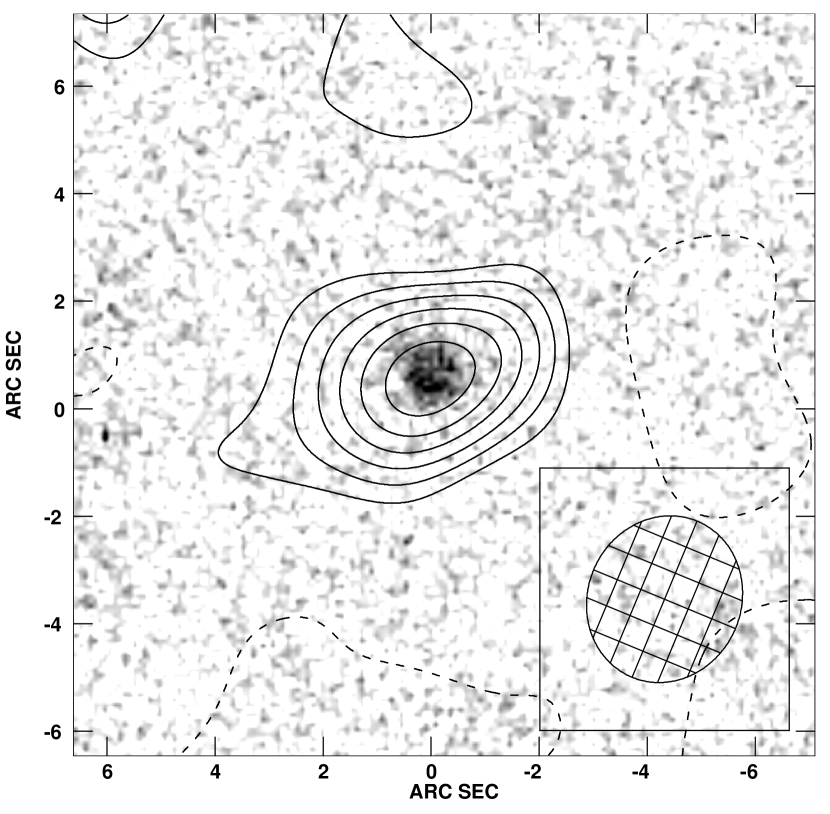
The astrometrical uncertainty in the final CO map is given by , where is the uncertainty of the assumed position of the phase calibrator, is the residual rms phase error after the phase correction, and is the positional error due to the presence of thermal noise. In our case the latter is by far the most dominant source of error and is given by . Adopting and (see Fig. 1) we find the total positional error in the final CO map to be .
2.2 Submillimetre observations
Imaging data at 450 and 850-m were obtained for J164502 using the Submillimetre Common User Bolometer Array (SCUBA – Holland et al. (1999)) during periods of exceptionally low opacity at the James Clerk Maxwell Telescope (JCMT222The JCMT is operated by the Joint Astronomy Centre on behalf of the United Kingdom Particle Physics and Astronomy Research Council (PPARC), the Netherlands Organisation for Scientific Research, and the National Research Council of Canada.) on Mauna Kea, Hawaii.
Data for J164502 were acquired during 1998 July 28–30 and 1998 September 03–05, a total integration time of 28.8 ks using a 45′′ east-west nod/chop. In brief, data were flat-fielded, corrected for atmospheric losses, edited both automatically and by hand, plotted onto an astrometric grid and flux calibrated using observations of planets and secondary calibration sources. The map was convolved with a Gaussian resulting in a resolution of .
2.3 Near-IR Observations
Near-IR K-band imaging was obtained of J164502 in June 2002 using the United Kingdom IR Telescope’s (UKIRT333UKIRT is operated by the Joint Astronomy Centre on behalf of the United Kingdom Particle Physics and Astronomy Research Council (PPARC)) UFTI imager, a 10242 HgTeCd array with pixels. Nine individual frames taken during good to moderate seeing conditions were co-registered and combined yielding a total exposure time of 2700s. The seeing in the final image is .
Using 5 stars also detected in the USNO A2.0 catalogue (Monet et al., 1998), the UKIRT image was calibrated on to the USNO reference frame to within rms. The CO map was aligned to the K-band frame using the tasks geo and hgeom in resulting in a relative positional accuracy between the two of .
3 Results
In order to sensitively search for possible faint extended CO emission, at the expense of high spatial resolution, we used the compact D-configuration data tapered down using a Gaussian with a full-width of 60 k at 30 per-cent amplitude, yielding a synthesized beam of . The resulting CO map overlaid on the UKIRT K-band image is shown in Fig. 1. CO emission is detected at the significance level in J164502. Assuming that we cover the entire line with the two IFs, and that we have rectangular passbands, we estimate the velocity-integrated flux-density using
| (1) |
where is the width of the IF and is the average of the flux density measured in the two IFs. Using the task imean to get the flux density of the source in the two IF maps we find mJy which yields a velocity-integrated flux density of Jy km s-1, where we have used GHz and an IF bandwidth of 45 MHz instead of 50 MHz due to bandpass rollover.
As first noted by Dey et al. (1999) using high-resolution HST WFPC2 images, J164502 in the optical has a reflected S-shaped morphology with two bright knots at each end. A comparison with Keck K-band imaging revealed that the bulk of the near-IR emission comes from the region between the two bright knots located north of the brightest optical knot (Dey et al., 1999). As seen from Fig. 1, the peak intensity in the CO map coincides with the peak in the UKIRT K-band image both of which are coincident with the region of low optical emission found by Dey et al. (1999). A similar offset between the HST position and the CO emission was reported by Andreani et al. (2000). While the near-IR emission traces the dust-enshrouded stars in J164502, the optical emission corresponds to regions of low extinction, and it is therefore not surprising to see such an offset between the two types of emission. Since gas should be a good tracer of dust one would expect the CO to coincide with the K-band emission, as it appears to do within the limits of our astrometric errors.
A Gaussian fit to the CO data in the image plane yields a deconvolved source size of , suggesting that even in the D-configuration we have resolved the CO emission, albeit marginally. Different weighting schemes and tapering functions were tried in order to see the effects on the extended emission. Using a less restrictive tapering function (FWHM) and a robust parameter of 2 instead of 5 (natural weighting), thereby increasing the weight of the long baselines, the source still appeared extended although at a lower significance due to the larger noise on the longest baselines (see Figure 1). In order to confirm or dismiss the reality of the extended emission we shifted the peak of the CO emission to the phase center, and then plotted the binned real and imaginary parts of the complex visibilities as a function of baseline distance, Fig. 1. The complex visibilities are the Fourier components of the source brightness distribution. Hence, for a Gaussian source brightness distribution the real part of the complex visibilities is a Gaussian while the imaginary part will be zero since a Gaussian is an even function. The dashed curves in Fig. 1 represents a least-squares fit of a circular Gaussian to the visibilities. The position of the Gaussian was fixed to the phase center during the fit and only the amplitude and width were allowed to vary. We find that the real part of the visibilities is consistent with a Gaussian source model with a in agreement with the Gaussian fit in the image plane. The imaginary part is consistent with zero at all baselines within the limits of our residual rms phase error of . The phase error would give rise to a dispersion around zero of 1.0 mJy mJy which is close to the observed scatter.
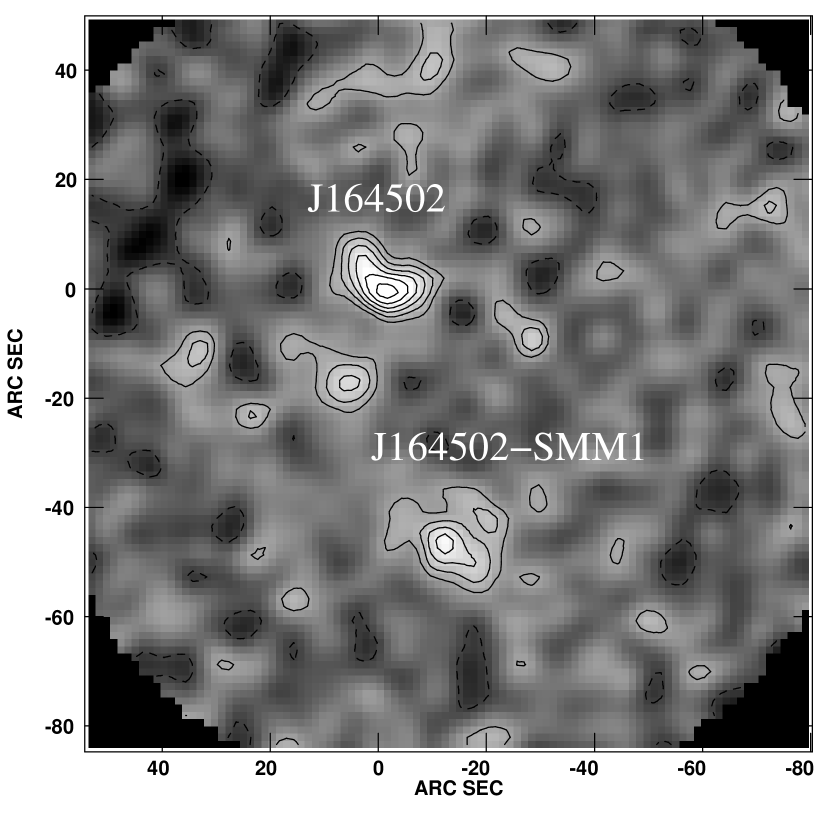
The 850-m SCUBA map of J164502 is shown in Fig. 2, and is seen to contain at least two statistically significant sources. A emission feature showing in the map is detected at a position which coincides with the near-IR and CO-detections of J164502, and we take this to unambiguously be the 850-m SCUBA detection of J164502. Another source, marked as J164502-SMM1 in Fig. 2, detected at the level is seen to the south, with faint emission at the level also seen just south of J164502. We estimated the 850-m flux density in four different ways. Two estimates were made by measuring the flux within apertures of and diameter. A third measurement was made by fitting a Gaussian to the emission, and a fourth by fitting a Gaussian with a fixed of to the emission. The values derived from each of these measurements are given in Table 2 for J164502 as well as J164502-SMM1. For J164502 we find mJy where we have adopted the average of the four different measurements. While this is in good agreement with the 850-m measurement by Cimatti et al. (1998), it is larger than the flux quoted by Dey et al. (1999). Both of these measurements were obtained using SCUBA in its photometry mode but the latter value is based on twice as large a data-set as the former, taken in excellent weather conditions and is therefore the most reliable estimate. If this is the case, the large discrepancy between the flux density derived from our map and the value derived from photometry-measurement by Dey et al. (1999) could be due to extended emission from J164502 which would have been missed by the single pixel measurement.
From the 850-m map in Fig. 2 it is seen that the emission from J164502 does in fact appear to be extended, with emission to the NE. The reality of this extended emission is strengthened by the high-resolution Keck K-band image obtained by Dey et al. (1999) which shows an emission feature extending in the same direction, albeit on a smaller scale of (see Fig. 2 of Dey et al. (1999)). However, the fact that the stars traced by the K-band emission is extended on scales of 9 kpc means that cold dust is distributed on at least the same scales, and likely on much larger scales. Fitting a Gaussian to the SCUBA image yields a source size of along the major axis, which is comparable to the resolution of the map, though very tentatively suggestive of a slight extension. In Fig. 2 we compare the azimuthally averaged radial profiles of J164502 and J164502-SMM1 with the point spread function (PSF) of SCUBA at 850-m derived from a beam map of a bright blazar obtained during the same observing run. The radial profile of J164502 agrees with the PSF out to beyond which it displays excess emission over that of a point source. This bump in the radial profile is due to the emission feature south ( kpc) of J164502. The reality of this emission feature is questionable but if real its close vicinity to J164502 could mean that it is a system in the process of merging with J164502. While there is thus tentative evidence that J164502 is extended, the large beam size of SCUBA does not allow for a firm conclusion on this issue.
For comparison we note that J164502-SMM1 is consistent with the PSF at all radii. The SCUBA 850-m beam is too large to make a reliable identification of J164502-SMM1 with an near-IR/optical source. If J164502-SMM1 is a dusty system at the same redshift as J164502 one might expect that it too would shine in CO. No CO emission was detected at the position of J164502-SMM1, however, and we set an upper limit on the velocity-integrated line flux using the equation , where is the rms noise, the velocity resolution, and the line width which we assume to be equal to the line width, i.e. km s-1 (Andreani et al., 2000). The measured rms noise in the image is mJy beam-1 which yields Jy km s-1 for a velocity- coverage of km s-1. The failure to detect CO-emission from J164502-SMM1 does not rule out a association since cluster velocity dispersions can go up to km s-1, and in some cases even closely associated CO-emitting regions can have velocity differences of km s-1 as was seen in the high redshift radio galaxy 4C 60.07 (Papadopoulos et al., 2000). The probability of finding by chance a source with a flux density brighter than or equal to 6 mJy within from J164502 is given by , where is the average surface density of sources with mJy (Downes et al., 1986). Adopting a surface density of deg-2 (Borys et al., 2003) one finds that . On that basis we conclude that J164502-SMM1 is most likely unrelated to J164502.
4 Analysis & Discussion
Table 2 summarises the CO and sub-mm observations of J164502 and J164502-SMM1 as well as the physical quantities derived from them.
4.1 Molecular gas and dust in J164502
For an observed velocity-integrated line flux density of the CO line, the intrinsic CO line luminosity is given by
| (2) |
where is the luminosity distance, and is the rest-frame frequency of the CO transition. Inserting astrophysical units, the equation reads
| (3) |
where is the so-called pseudo-luminosity which is measured in units of K km s-1 pc2. The observed CO line flux density for J164502 implies an intrinsic CO luminosity of K km s-1 pc2. From the CO line the molecular gas mass can be found using the scaling relation where is the standard Galactic CO-H2 conversion factor. The standard conversion factor, has been calibrated using Giant Molecular Clouds (GMCs) in our Galaxy (e.g. Strong et al., 1988). However, the conditions of the interstellar medium in active starbursting galaxies such as ULIRGs is markedly different from that in our Galaxy, and applying the Galactic conversion factor would result in seriously underestimated gas masses. In particular, the concept of isolated and virialised GMCs breaks down, and instead the bulk of the CO emission is found to originate from a warm diffuse phase. In effect, this yields a lower conversion factor of , more appropriate for such extreme environments (Downes & Solomon, 1998). It is reasonable to assume that in high-redshift starbursts similar conditions prevail and the aforementioned value of is also adopted for J164502. In doing so we estimate the molecular gas mass present in J164502 to be . This is in agreement with the detection by Andreani et al. (2000), which yields a molecular gas mass of when converted to the cosmology adopted in this paper.
The CO line luminosity and the implied molecular gas mass of J164502 is somewhat lower than those found in the quasars APM 08279+5255 and PSS 2322+1944, and in the high redshift radio galaxy 4C 60.07 ( K km s-1 pc2 and - see Papadopoulos et al. 2001; Carilli et al. 2002; Greve et al. in preparation). This is not surprising since these objects are among the most luminous systems in the Universe, and might therefore be expected to contain more gas. Solomon et al. (1997) observed CO in a sample of 37 local ULIRGs out to a redshift of , and found an average luminosity of K km s-1 pc2 which is roughly the luminosity of Arp 220 and Mrk 231. The scatter on this result was only 30 per cent. A more recent survey of CO observations of a complete sample of 60 ULIRGs selected from the SCUBA Local Universe Galaxy Survey (SLUGS - Dunne et al. (2000)) yielded similar results (Yao et al., 2003). Hence, we find that J164502 has a CO luminosity and consequently a molecular gas mass which is about an order of magnitude larger than is found for local ULIRGs.
The dynamical mass of the system can be calculated from the observed size and line width of the source and assuming the gas is distributed in a disk with diameter in Keplerian rotation, in which case it can be shown that the dynamical mass is given by
| (4) | |||||
| (5) |
where is the inclination angle of the disk, and is a correction factor of order unity (Bryant & Scoville, 1996). Adopting a line width of km s-1 (Andreani et al., 2000), a source size of , which corresponds to a maximum linear diameter of kpc at a redshift of we estimate the enclosed dynamical mass within the CO-emitting region to be . The inferred ratio of the molecular-to-dynamic mass for the system as a whole is then . Hence, geometrical factors aside, the amount of molecular gas accounts for at least 10 per cent of the total dynamical mass within the CO-emitting region. The dynamical mass should be considered an upper limit on the total amount of molecular gas present in J164502, and the two mass estimates would only coincide if the CO emission was concentrated within the inner kpc. Due to the higher spatial resolution and the fact that the line provides an unbiased estimate of , our constraint on the molecular-to-dynamical mass ratio should be an improvement over that of Andreani et al. (2000). A gas mass fraction of per cent is compatible with the range of gas mass fractions found for local ULIRGs (Downes & Solomon, 1998) yet, unlike the latter, it is distributed over significantly larger scales.
The extrapolated synchroton radiation flux at 850-m is less than Jy, and it is therefore safe to assume that the observed 850-m flux from J164502 is dominated by thermal dust emission, with the radio synchroton emission contributing a negligible amount. The dust mass can therefore be estimated using
| (6) |
where is the rest-frame frequency, is the CMB temperature at redshift , and is the dust absorption coefficient. The emissivity index, , depends on the dust temperature, , (Dunne et al., 2000) both of which are poorly constrained for high-redshift objects - typical values are . Dey et al. (1999) found the spectral energy distribution (SED) of J164502 to be well described by an optically thin modified black body law with a dust temperature of K and an emissivity law of , and we adopt those values here. In doing so we estimate the dust mass to be , where we have used a dust absorption coefficient of m2 kg-1 after Hildebrand (1983). The uncertainty in is large, so we present this estimate for comparison only. We can estimate the total far-IR luminosity by integrating the thermal spectrum
| (7) |
which yields a total far-IR luminosity of . This almost puts J164502 in the class of hyperluminous infrared galaxies (HyLIRGs) which have . The dust masses and far-IR luminosities typically found in local ULIRGs are and (Sanders & Mirabel, 1996; Dunne et al., 2000), i.e. nearly an order of magnitude smaller than what we find for J164502. It is comparable, however, to what is found in high-redshift QSOs and HzRGs (Omont et al., 2003; Archibald et al., 2001) and, perhaps more importantly, similar to the dust masses and far-IR luminosities found in sub-mm-selected dust-enshrouded starbursts at high redshifts (Ivison et al. 1998, 2000). From the above we estimate the gas-to-dust mass ratio of J164502 to be which is well within the range of 50-100 found for local ULIRGs. Note, however, that significant uncertainty is attached to the normalisation of , and values differing by as much as a factor of two has been reported (Draine & Lee, 1984; Mathis & Whiffen, 1989), which in turn could lead to a similar change in the dust mass but not in which is independent of the normalisation value of the dust absorption coefficient. Using instead of 1.5 would decrease the dust mass by nearly a factor of two, but increase by a similar amount.
If the bulk of the far-IR emission can be ascribed to starburst activity the corresponding star formation rate is given by
| (8) |
where is a function of the initial mass function, and is the fraction of the FIR emission which is heated by the starburst (Omont et al., 2001). Assuming a conservative value of , we estimate the starformation rate in J164502 to be . It is possible that J164502 harbours an AGN in its center, so a significant fraction of the far-IR luminosity could be due to dust being heated by the AGN and not by the starburst. The derived value for the SFR could therefore be overestimated. However, the narrow linewidths seen in optical and NIR spectra of J164502 (Dey et al., 1999) favours young hot stars over an AGN as the main source of energy. Furthermore, as pointed out by Dey et al. (1999), J164502 deviates from the 60 m - 6 cm relation obeyed by local star-forming galaxies by having almost an order of magnitude less radio emission at 6 cm, which is unlikely if an AGN dominated the energetics of the system (Dey & van Breugel, 1994). In addition, it is found that the bulk of the far-IR emission from local ULIRGs is powered by starburst activity even though an AGN is present (Downes & Solomon, 1998). Finally, if the sub-mm emission is extended it would strongly suggest that the main power source for the far-IR emission is a massive starburst since it is difficult to imagine the AGN heating the dust on scales of tens of kpc. The large quantity of molecular gas revealed by the CO detections in this system could provide the necessary fuel for such a massive starburst for a period of years.
The efficiency of star formation should be measured relative to the amount of molecular gas available to form stars. Such a measure of the star-formation efficiency is the rate of star formation per solar mass of molecular hydrogen, i.e. . For J164502 we find . Probably a better gauge of the star-formation efficiency is the continuum-to-line ratio since it is independent of . Giant Molecular Cloud (GMCs) in our Galaxy typically have values of and similar ratios are found in nearby spirals (Mooney & Solomon, 1988). Starburst galaxies and ULIRGs have ratios which are 10 times higher than this, ranging in values from 80 to 250 with a median of K km s-1 pc (Solomon et al., 1997). For J164502 we find K km s-1 pc, i.e. in line with what is found for local ULIRGs. Recent studies of large samples of ULIRGs at low and intermediate redshifts have shown that the ratio increases with increasing (Young et al., 1986; Tutui et al., 2000; Yao et al., 2003). Such behaviour can be explained if the more far-IR luminous galaxies, in addition to having more dust and gas which would just continue the linear relation between and , have higher dust temperatures due to extra heating by an AGN or a higher star-formation efficiency. Assuming that there is no contribution to from an AGN, the derived -ratio should probably be taken as a lower limit on the star-formation efficiency since in the extreme starburst regions dominating the emission from ULIRGs, the bulk of the CO luminosity comes from a diffuse inter-cloud medium, rather than from the dense gas gravitationally bound in clouds where the stars are formed (Downes et al., 1993; Solomon et al., 1997). The dense gas is better traced by HCN, and as shown by Gao et al. (1999) the -ratio is the same for GMCs to ULIRGs, indicating that anywhere in the Universe only the dense gas is relevant to star-formation. In ULIRGs the dense/diffuse gas mass ratio (roughly quantified by ) is particularly high which is not a surprise given their merger status and the way the gas responds to a merger.
4.2 Excitation conditions of the molecular gas in J164502
The velocity/area-averaged brightness temperature ratio between CO and CO is
| (9) |
Andreani et al. (2000) estimated the CO and luminosities to be and K km s-1 pc2, respectively, where we have converted the luminosities to the cosmology adopted here. The line ratios estimated from eq. 8 are and . The majority of high-redshift systems detected in CO to date are strongly gravitationally lensed. This makes estimating the excitation conditions in such systems complicated since differential magnification of the high-J lines compared to lower transitions may bias the line ratios significantly. There is nothing to suggest that J164502 is gravitationally lensed, and the above derived line ratios ought to represent the intrinsic excitation conditions of the gas, albeit still averaged over the entire galaxy.
We used the observed line ratios of and as constraints to a Large Velocity Gradient (LVG) code in order to gain some insight on the bulk properties of the molecular gas in J164502. A lower limit on gas temperature K is assumed since this value is deduced for the bulk of the dust (Dey et al., 1999) and is expected for FUV-heated gas/dust (e.g. Tielens & Hollenbach, 1999). A wide range of temperatures ( K) offers an acceptable fit to the aforementioned line ratios, with K being the optimal value. This wide range is due to the poor constraints offered by only two line ratios while the high gas temperatures may reflect the UV-intense environment of the molecular gas in J164502 and/or turbulent motions heating only the gas, a situation that has already been noted for molecular gas in the Galactic center (Rodriguez-Fernandez et al., 2001).
A common feature of all the LVG solutions is the low gas densities . This has already been noted when only the CO line ratio was available (Papadopoulos & Ivison, 2002) and is a property often found for the bulk of the gas in extreme starbursts (e.g. Aalto et al., 1995; Downes & Solomon, 1998). Interestingly for such low gas densities all CO transitions with have flux density ratios with respect to the lowest transition of for any plausible gas temperature ( K), thus no longer offering the advantage of a higher flux density with respect to the latter.
As a consequence, any estimate of the H2 mass based on the assumption of optically thick, thermalised high-J CO lines could be severely underestimated. Using the 5–4 line in J164502 only, and assuming it is optically thick and thermalised (), one would find a molecular gas mass which is an order of magnitude lower than that inferred from the line. There is no significant flux advantage between the 2–1 and 1–0 lines, since even for a very subthermal ratio of , say. This is consistent with the fact that we find the molecular masses derived from the two lines to be similar (section 4.1). The above demonstrates the importance of using low-J CO lines in order to infer the amount of molecular gas in a galaxy. This is particularly true at redshifts beyond 3, since at those redshifts the current mm-interferometers can only hope to detect CO , , and the the excitation bias of the high-J lines could become very severe.
4.3 Comparison with high-redshift sub-mm galaxies
Although J164502 was originally selected as an ERO and not a (sub)millimetre galaxy, subsequent observations at optical/IR and sub-mm wavelengths have shown that it can in fact be considered a typical sub-mm galaxy (Dey et al. 1999; see also Smail et al. 1999). Our detection of CO in J164502 is therefore the first detection of this transition in a galaxy which is thought to be similar to the SCUBA population of dust-enshrouded galaxies at high redshifts. J164502 has a far-IR and CO luminosity about ten times that of the average values found in ULIRGs, and the amount of molecular gas present in J164502 is comparable to the median gas mass () of the five SCUBA galaxies detected in CO to date (Neri et al., 2003), although a thorough characterisation of the gas content of this population has to await CO observations of a large, unbiased sample of submm-selected galaxies. Hence, the observations presented here further supports that J164502 is more similar in its properties to sub-mm galaxies than a high-redshift analogue of Arp 220.
Recently, a subject of some debate has been whether the CO emission detected from high-redshift sub-mm galaxies originates from a huge, massive resevoir of molecular gas kpc in size or from a much more compact circumnuclear disk, typically of radius pc, as seen in local ULIRGs such as Arp 220 (Ivison et al., 2001; Genzel et al., 2003; Downes & Solomon, 2003). If, as the observations seem to suggest, the starburst in J164502 is extended over several tens of kpc that would set apart from the local ULIRG population and point toward the former scenario.
References
- e.g. Aalto et al. (1995) Aalto, S., Booth, R. S., Black, J. H. & Johansson, L. E. B. 1995, A&A, 300, 369.
- Andreani et al. (2000) Andreani, P., Cimatti, A., Loinard, L. & Röttgering, H. 2000, A&A, 354, L1.
- Archibald et al. (2001) Archibald, E. N., Dunlop, J. S., Hughes, D. H., Rawlings, S., Eales, S. A. & Ivison, R. J. 2001, MNRAS, 323, 417.
- Bertoldi et al. (2001) Bertoldi, F., Menten, K.M., Kreysa, E., Carilli, C.L. & Owen, F. 2001, 24th meeting of the IAU, Manchester, England (astro-ph 0010553).
- Borys et al. (2003) Borys, C., Chapman, S., Halpern, M. & Scott, D. 2003, MNRAS , in press, astro-ph/0305444.
- Brown and vanden Bout (1991) Brown, R.L. & vanden Bout, P.A. 1991, A&A, 102, 1956.
- Bryant & Scoville (1996) Bryant, P.M. & Scoville, N.Z. 1996, ApJ, 457, 678.
- Carilli et al. (2002) Carilli, C.L., Cox, P., Bertoldi, F., Menten, K.M., Omont, A., Djorgovski, S.G., Petric, A., Beelen, A., Isaak, K.G. & McMahon, R.G. 2002, ApJ, 575, 145.
- Chapman et al. (2003) Chapman, S.C., Blain, A.W., Ivison, R.J. & Smail, I. 2003, Nature, accepted.
- Cimatti et al. (1998) Cimatti, A., Andreani, P., Röttgering, H. & Tilanus, R. 1998, Nature, 392, 895.
- Dey & van Breugel (1994) Dey, A. & van Breugel, W. 1994, ”Mass Transfer Induced Activity in Galaxies”, Cambridge Univ. Press, ed. Shlosman, I.
- Dey et al. (1999) Dey, A., Graham, J. R., Ivison, R. J., Smail, I., Wright, G. S. & Liu, M. C. 1999, ApJ, 519, 610.
- Downes et al. (1986) Downes, A. J. B., Peacock, J. A., Savage, A., Carrie, D. R. 1986, MNRAS, 218, 31.
- Downes et al. (1993) Downes, D., Solomon, P.M. & Radford, S.J.E. 1993, ApJ, 414, L13.
- Downes & Solomon (1998) Downes, D. & Solomon, P.M. 1998, ApJ, 507, 615.
- Downes & Solomon (2003) Downes, D. & Solomon, P.M. 2003, ApJ, 582, 37.
- Draine & Lee (1984) Draine, B. & Lee, H. 1984, ApJ, 285, 89.
- Dunlop et al. (1996) Dunlop, J., Peacock, J., Spinrad, H., Dey, A., Jimenez, R., Stern, D. & Windhorst, R., Nature, 381, 581.
- Dunne et al. (2000) Dunne, L., Eales, S, Edmunds, M., Ivison, R.J., Alexander & P. Clements, D.L. 2000, MNRAS, 315, 115.
- Frayer (1996) Frayer, D.T. 1996, PhD Thesis, University of Virginia.
- Frayer et al. (1998) Frayer, D.T., Ivison, R.J., Scoville, N.Z., Yun, M., Evans, A.S., Smail, I., Blain, A.W. & Kneib, J.-P. 1998, ApJ, 506, 7.
- Frayer et al. (1999) Frayer, D.T., Ivison, R.J., Scoville, N.Z., Evans, A.S., Yun, M.S., Smail, I., Barger, A.J., Blain, A.W. & Kneib, J.-P. 1999, ApJ, 514 L13.
- Gao et al. (1999) Gao, Y., Solomon, P.M. & Philip, M. 1999, ApJ, 512, 99.
- Genzel et al. (2003) Genzel, R., Baker, A.J., Tacconi, L.J., Lutz, D., Cox, P., Guilloteau, S. & Omont, A. 2003, ApJ, 584, 633.
- Graham & Dey (1996) Graham, J. R. & Dey, A. 1996, ApJ, 471, 720.
- Hildebrand (1983) Hildebrand, R. 1983, QJRAS, 24, 267.
- Holland et al. (1999) Holland, W. S., Robson, E. I., Gear, W. K., Cunningham, C. R., Lightfoot, J. F., Jenness, T., Ivison, R. J., Stevens, J. A., Ade, P. A. R., Griffin, M. J., Duncan, W. D., Murphy, J. A. & Naylor, D. A. 1999, MNRAS, 303, 659.
- Hu & Ridgway (1994) Hu, E. M. & Ridgway, S. E. 1994, AJ, 107, 1303.
- Hughes et al. (1998) Hughes, D.H., Serjeant, S., Dunlop, J., Rowan-Robinson, M., Blain, A., Mann, R. G., Ivison, R., Peacock, J., Efstathiou, A., Gear, W., Oliver, S., Lawrence, A., Longair, M., Goldschmidt, P. & Jenness, T. 1998, Nature, 394, 241.
- Ivison et al. (1996) Ivison, R.J., Papadopoulos, P.P., Seaquist, E.R. & Eales, S.A. 1996, MNRAS, 278, 669.
- Ivison et al. (1998) Ivison, R.J., Smail, I., Le Borgne, J.-F., Blain, A.W., Kneib, J.-P., Bezecourt, J., Kerr & T.H., Davies, J.K. 1998, MNRAS, 298, 583.
- Ivison et al. (2000) Ivison, R.J., Smail, I., Barger, A.J., Kneib, J.-P., Blain, A.W., Owen, F.N., Kerr, T.H. & Cowie, L.L. 2000, MNRAS, 315, 209.
- Ivison et al. (2001) Ivison, R.J., Smail, I., Frayer, D.T., Kneib, J.-P. & Blain, A.W. 2001, ApJ, 561, L45.
- Ivison et al. (2002) Ivison, R.J., Greve, T.R., Smail, I., Dunlop, J., Roche, N., Scott, S., Page, M., Stevens, J., Almaini, O., Blain, A., Willott, C., Fox, M., Gilbank, D., Serjeant, S. & Hughes, D. 2002, MNRAS, 337, 1.
- Kreysa et al. (1998) Kreysa, E., Gemuend, H.-P., Gromke, J., Haslam, C.G., Reichertz, L., Haller, E.E., Beeman, J.W., Hansen, V., Sievers, A. & Zylka, R. 1998, Proc SPIE 3357, 319.
- Mathis & Whiffen (1989) Mathis, J. & Whiffen, G. 1989, ApJ, 341, 808.
- Monet et al. (1998) Monet, D., Bird A., Canzian, B., Dahn, C., Guetter, H., Harris, H., Henden, A., Levine, S., Luginbuhl, C., Monet, A. K. B., Rhodes, A., Riepe, B., Sell, S., Stone, R., Vrba, F. & Walker, R. 1998, USNO-SA2.0 (U.S. Naval Observatory, Washington DC).
- Mooney & Solomon (1988) Mooney, T. & Solomon, P.M. 1988, ApJ, 334, L51.
- Moriondo et al. (2000) Moriondo, G., Cimatti, A., Daddi, E. 2000, A&A, 364, 26.
- Neri et al. (2003) Neri, R., Genzel, R., Ivison, R.J., Bertoldi, F., Blain, A.W., Chapman, S.C., Cox, P., Greve, T.R., Omont, A. & Frayer, D.T. 2003, ApJ, submitted.
- Omont et al. (2001) Omont, A., Cox, P., Bertoldi, F., McMahon, R., Carilli, C., & Isaak, K. G. 2001, A&A, 374, 371.
- Omont et al. (2003) Omont, A., Beelen, A., Bertoldi, F., Cox, P., Carilli, C. L., Priddey, R. S., McMahon, R. G. & Isaak, K. G. 2003, A&A, 398, 857.
- Papadopoulos et al. (2000) Papadopoulos, P. P., Röttgering, H. J. A., van der Werf, P. P., Guilloteau, S., Omont, A., van Breugel, W. J. M. & Tilanus, R. P. J. 2000, ApJ, 528, 626.
- Papadopoulos et al. (2001) Papadopoulos, P.P., Ivison, R.J., Carilli, C.L. & Lewis, G. 2001, Nature, 409, 58.
- Papadopoulos & Ivison (2002) Papadopoulos, P. P. & Ivison, R.J. 2002, ApJ, 564, L9.
- Rodriguez-Fernandez et al. (2001) Rodriguez-Fernandez, N. J., Martin-Pintado, J., Fuente, A., de Vicente, P., Wilson, T. L., & Hüttemeister, S. 2001, A&A, 365, 174.
- Sanders et al. (1991) Sanders, D.B., Scoville, N.Z. & Soifer, B.T. 1991, ApJ, 370, 158.
- Sanders & Mirabel (1996) Sanders, D.B. & Mirabel, I.F. 1996, ARA&A, 34, 749.
- Smail et al. (1997) Smail, I., Ivison, R.J. & Blain, A.W. 1997, ApJ, 490, L5.
- Smail et al. (1999) Smail, I., Ivison, R.J., Kneib, J.-P., Cowie, L.L., Blain, A.W., Barger, A.J., Owen, F.N. & Morrison, G. 1999, MNRAS, 308, 1061.
- Solomon et al. (1997) Solomon, P.M., Downes, D., Radford, S.J.E. & Barrett, J.W. 1997, ApJ, 478, 144.
- e.g. Strong et al. (1988) Strong, A. W., Bloemen, J. B. G. M., Dame, T. M., Grenier, I. A., Hermsen, W., Lebrun, F., Nyman, L.-A., Pollock, A. M. T. & Thaddeus, P. 1988, A&A, 201, 1.
- e.g. Tielens & Hollenbach (1999) Tielens, D.J. & Hollenbach, A.G.G.M. 1999, Rev. Modern Physics, 71, 174.
- Tutui et al. (2000) Tutui, Y., Sofue, Y., Honma, M., Ichikawa & T., Wakamatsu, K.-i. 2000, PASP. 52, 803.
- Yao et al. (2003) Yao, L., Seaquist, E.R., Kuno, N. & Dunne, L. 2003, AJ, accepted.
- Young et al. (1986) Young, J.S., Schloerb, F.P., Kenney, J.D. & Lord, S.D. 1986, ApJ, 304, 443.


| Date | Configuration | Frequency, (GHz) | Integration time, (hrs) |
|---|---|---|---|
| 2001 Oct 9 | D | 47.235,47.285 | 5.2 |
| 2002 Oct 26 | C | 47.235,47.285 | 2.9 |
| 2002 Nov 14 | C | 47.235,47.285 | 2.4 |
| 2002 Dec 24 | C | 47.235,47.285 | 2.6 |
| 2003 Feb 21 | D | 47.235,47.285 | 2.6 |
| 2003 Mar 1 | D | 47.235,47.285 | 3.8 |
| Parameter | J164502 | J164502-SMM1 |
|---|---|---|
| (J2000) | 16:45:02.26 | 16:45:01.20 |
| (J2000) | +46:26:26.50 | +46:25:39.0 |
| 1.439 | ||
| [Jy km s-1] | ||
| [mJy] | aaThe average of 7.5/7.9/7.3/9.8 mJy which was the flux densities obtained using the four different methods described in section 3. | bbThe average of 6.7/6.5/6.0/6.5 mJy which was the flux densities obtained using the four different methods described in section 3. |
| L [K km s-1 pc-1] | ccThis value assumes that J164502-SMM1 has a redshift of . | |
| [] | ccThis value assumes that J164502-SMM1 has a redshift of . |