11email: jborisso@astro.puc.cl 22institutetext: Department of Astronomy, Sofia University, Bulgaria, and Isaac Newton Institute of Chile, Bulgarian Branch, 5 James Bourchier, 1164 Sofia, Bulgaria
22email: pessev, kurtev, givanov@phys.uni-sofia.bg 33institutetext: European Southern Observatory, Karl-Schwarzschild-Str. 2, D-85748 Garching bei Mnchen, Germany
33email: vivanov@eso.org 44institutetext: European Southern Observatory, Ave. Alonso de Cordova 3107, Casilla 19, Santiago 19001, Chile
44email: isaviane@eso.org
Discovery of New Milky Way Star Cluster Candidates in the 2MASS
Point Source Catalog II.
Physical Properties of the Star Cluster CC 01
Three new obscured Milky Way clusters were detected as surface density peaks in the 2MASS point source catalog during our on-going search for hidden globular clusters and massive Arches-like star clusters. One more cluster was discovered serendipitously during a visual inspection of the candidates.
The first deep , , and imaging of the cluster [IBP 2002] CC 01 is presented. We estimated a cluster age of 1-3 Myr, distance modulus of (m-M)0=12.560.08 mag (D=3.5 Kpc), and extinction of AV7.7 mag. We also derived the initial mass function slope for the cluster: =2.230.16 (Salpeter=2.35). The integration over the initial mass function yielded a total cluster mass 1800200. CC 01 appears to be a regular, not very massive star cluster, whose formation has probably been induced by the shock front from the nearby Hii region Sh 2-228.
Key Words.:
(Galaxy:) open clusters and associations: general - Infrared: general1 Introduction
All-sky infrared surveys offer the opportunity to study for the first time the obscured cluster population in the disk of the Milky Way that is hidden by severe dust extinction (=10-20 mag). A major drive for such studies are the discovery of new globular clusters (i.e. Hurt et al. hur00 (2000)) and massive () Arches-like young clusters (Nagata et al. nag93 (1993)). While the former offer the chance to reveal the full extent of the old stellar population in the Milky Way disk – the so-called disk globulars, the latter help to probe the most extreme star formation environments, together with more traditional problems such as the spiral structure of the Galaxy and the abundance gradients.
A number of searches have already been undertaken and the most recent catalogs contain about 500 newly discovered objects (Bica et al. bic03 (2003)). The techniques vary from simple visual inspection of regions with known mid-infrared or radio emission (Dutra et al. dut02 (2002)) to fully automated density variation searches (Ivanov et al. iva02 (2002), hereafter Paper I; Reylé & Robin rey02 (2002)). The former ones take advantage of the radio- and mid-infrared emission of young clusters, and the later are sensitive to all clusters regardless of their age and population. Our on-going project is aimed at discovery of previously unknown Galactic globular clusters or/and massive Arches-like young clusters.
Here we present a set of new clusters. This paper concludes our search with 55 arcmin bin size which determines the scale of the objects. Next, we will concentrate on smaller structures.
We also report a mass estimate of [IBP 2002] CC 01 (hereafter CC 01) that was selected from the list in Paper I as a massive cluster candidate. This study is a demonstration of the follow up we will carry out on the most promising clusters. Fortuitously, the two brightest stars in CC 01 have optical spectroscopy available in the literature that allows us to determine the distance and the cluster mass. However, we intend to use near infrared spectroscopy for the objects with higher obscuration.
2 New Cluster Candidates
2.1 Search Technique and Strategy
Our search technique is based on local fluctuations in the stellar surface density. The first step is to build a 2-dimensional histogram in terms of number of stars per unit area on the sky. Next, the value in each bin is compared with the background, calculated from the surrounding bins. The bin size determines the characteristic size of the selected structures. The main advantage of the surface density method is that it is sensitive to all populations of clusters. Our strategy was to search first for larger cluster candidates. Therefore, we started with 55 arcmin bins. For more detailed description see Paper I.
This technique has one caveat - the density peaks produced by objects close to the bin borders can fall into two or more bins. Such peaks could be diluted beyond detection. To alleviate this problem we repeated the search shifting the centers of the bins by 2.5 arcmin along both axis. The present work is focused on the regions with Galactic latitude 10 degr, because our previous experience showed that only clusters hidden behind A mag have evaded previous detection. We plan to decrease the size of the bins in our future searches, optimizing it to detect smaller objects.
3 New Clusters
Parameters of the new cluster candidates are given in Table 1. Three of them were discovered by our searching software, and one - during visual inspection of the candidates. The numbering continues that in Paper I and the ”CC” means ”cluster candidate”. Here we refrained from numerical estimates of the total cluster apparent luminosity because our experience with CC 01 showed that the cluster boundaries depend on the depth of the images, and the magnitudes determined from the 2MASS images are underestimated. The diameters are approximate eye-ball estimates from the band images. True-color reproductions of the 2MASS images of the new clusters are shown in Fig. 1.
| ID | R.A. Dec. | l b | D |
|---|---|---|---|
| CC | (J2000.0) | ||
| 11 | 06:33:27 12:03.5 | 200.17 1.55 | 0.6 |
| 12 | 08:16:31 35:40.0 | 253.72 0.21 | 0.5 |
| 13 | 20:31:34 45:05.8 | 83.09 3.28 | 1.0 |
| 14 | 05:28:59 34:23.2 | 173.50 0.06 | 1.0 |
Comments to individual objects:
CC 11: The objects appears as a compact group of reddened stars (1.5 mag) on the color-magnitude diagram. Some stars are so obscured that they are visible on the image only. Extended emission is present indicating that this might be a dust-rich young cluster.
CC 12: A compact group, dominated by few bright stars. It is located 0.5 arcmin away from the infrared source IRAS 08146-3529A.
CC 13: This object is in the outskirts of the Cygnus Complex which together with the presence of a molecular cloud ([DBY94] 083.1+03.3; Dobashi et al. dob94 (1994)) and two radio-sources (F3R 2728, MITG J2031+4505) makes it a likely young cluster. Note that the radio sources can well be misidentified as a single one. The spatial distribution of stellar colors indicates that the cluster is embedded into a large (10 arcmin) long dust lane.
CC 14: The cluster was serendipitously discovered in the field of CC 11 as a round group of red stars. The over-density is bellow our detection limit but the stellar colors are well distinguished on the color-magnitude diagram. The object has two tidal-tail-like structures pointing in opposite directions that can be traced out as far as 3 arcmin to the East and 5 arcmin to the West. Two nearby mid-IR sources are located in the vicinity of the cluster: IRAS 05257+3420 at 1.5 arcmin, and IRAS 0553+3421 at 2.5 arcmin. However there is no evidence of physical association. Deeper photometry is necessary to reveal the true nature of the object.
4 Physical Parameters of CC 01
The cluster candidate CC 01 (=05:13:26 =+37:27.0) was selected as a part of our on-going search (Paper I). It was chosen for this follow up study because it appeared richer and more massive than the rest of our candidates.
Some cluster members were detected in a study of embedded star clusters by Carpenter et al. (car93 (1993)). They are associated with a Hii region Min 2-58 (= Sh 2-228; Minkowski min48 (1948), Sharples sha59 (1959)). Optical photometry of the brightest four stars in the Hii region was reported by Lahulla (lah85 (1985)) who determined the spectral types of two stars from their colors. Later, Hunter & Massey (hun90 (1990)) and Hunter (hun92 (1992)) obtained optical spectra of two bright stars, and estimated that the Hii region is at 2.4 Kpc from the Sun, based on these spectral types, and assuming the stars are on the main sequence. They also determined the reddening toward the cluster to mag, corresponding to AV=3.90.7 mag (assuming RV=3.2).
4.1 Observations and Data Reduction
Infrared imaging observations were carried out on Jan 16, 2003, with the Isaac Newton Group Red Imaging Device (INGRID) at the Cassegrain focus of the 4.2m WHT. The instrument uses 1024x1024 Hawaii near-IR detector array. The scale is 0.238 arcsec giving a total field of view of 4.06x4.06 arcmin. We obtained two sequences of shallow and deep images, to extend the dynamical range of the photometry. The former series consists of 5 (6 for the band) 1 sec dithered images, alternated with off-cluster images for sky subtraction. The deep series follows the same pattern but the individual images consist of 6 averaged 10 sec frames (12 5 sec for the band).
The stellar photometry of the combined and sky-subtracted images was carried out using ALLSTAR in DAOPHOT II (Stetson ste93 (1993)). We consider only stars with DAOPHOT errors less than 0.2 mag. The median averaged photometric errors are for the magnitudes brighter than 17 mag and for the fainter stars. There is also an additional observational uncertainty of 0.03 mag due to the sky background variations. The six brightest stars are saturated in our photometry. We used instead the 2MASS data.
The photometric calibration was performed by comparing our instrumental magnitudes with the 2MASS magnitudes of 20-25 stars (depending on the band). The transformation equations are:
where are the instrumental magnitudes, and are the magnitudes in the 2MASS system. The standard error values for the coefficients are also given.
Our final photometric list contains 733 stars with location on the final images in pixels coordinates (x,y) and , and magnitudes and their photometric uncertainties. The complete data set is available in the electronic edition of the Journal. The artificial star technique (Stetson & Harris ste88 (1988); Stetson 1991a , 1991b ) was used to determine the completeness limits of the data: mag.
4.2 Star Counts: Location and Boundaries of the Cluster
The object has a complex morphology, as becomes evident from the true-color image of the region (Fig. 2). Carpenter et al. (car93 (1993)) reported a cluster that contained several bright stars associated with the Hii region Sh 2-228. Our data revealed a rich cluster of fainter stars, which are not visible on their images, and are only partially visible on the 2MASS (Paper I). It is no surprise since the formation of high-mass stars is often related to the formation of a cluster of less massive stars (i.e. Tapia et al. tap91 (1991), tap96 (1996); Lada & Lada lad91 (1991); Persi et al. per94 (1994), per00 (2000)).
To determine the location and the boundaries of the cluster we performed direct star counts, assuming spherical symmetry. We varied the center searching for the steepest radial profile. The new cluster coordinates are: =05:13:28 =+37:26:53, with uncertainty of about 10 arcsec, which are shifted by 0.4 arcmin to the South-East comparing with the ones determined by Carpenter et al. (car93 (1993)) and Paper I.
The cluster boundary was defined, perhaps conservatively, as the point of the profile where the excess density becomes twice the standard deviation of the surface density of the surrounding field. This yields a radius of 1.5 arcmin, indicated by a circle in the upper panel of Fig. 3. Note that the cluster might be larger as the radial profile flattens only at 2.3 arcmin but the excess is below the 2 significance this far.
Careful inspection of our deep images shows some cluster asymmetry – there is an excess of faint stars to the East – South-East (at =05:13:34 =+37:26:46; Fig. 2). The stellar surface density there is stars per sq. arcmin, significantly higher than the background of stars per sq. arcmin, measured in the member-free North-East region. This reveals an asymmetric and elongated cluster. Even on the infrared images however (Fig. 2) is evident that there is a big absorption gradient, along the NW-SE direction and the true shape of the cluster cannot be completely defined, until the cluster emerges from its obscure cloud.
Fig. 3 shows the positions of all stars measured in the and bands (top) and projected band star number density in number of stars per sq. arcmin (bottom). The best fitting King profile ( and arcmin, c=0.67) is shown just for comparison, because there is no physical reason to believe, that such an young cluster should follow a King profile.

4.3 Color-Color and Color-Magnitude Diagrams
To decontaminate the cluster’s CMD we used above determined cluster limiting radius encircling the most probable cluster members. This area contains cluster’s stars + field stars. The field stars alone are selected in an annulus around the cluster with inner radius and normalized to the same area covered by the CC 01. To check the location of field stars on the CMD we retrieved the photometry from 2MASS for a second comparison field situated 10 arcmin from CC 01 (open circles on (Fig. 4)). The CMDs of “cluster + field” and “field” are gridded and the stars in each box in the two diagrams are counted (Fig. 4). Then an equivalent number of stars is removed from the single boxes of the “cluster + field” CMD on the basis of the number of field stars found in the “field” CMD alone.

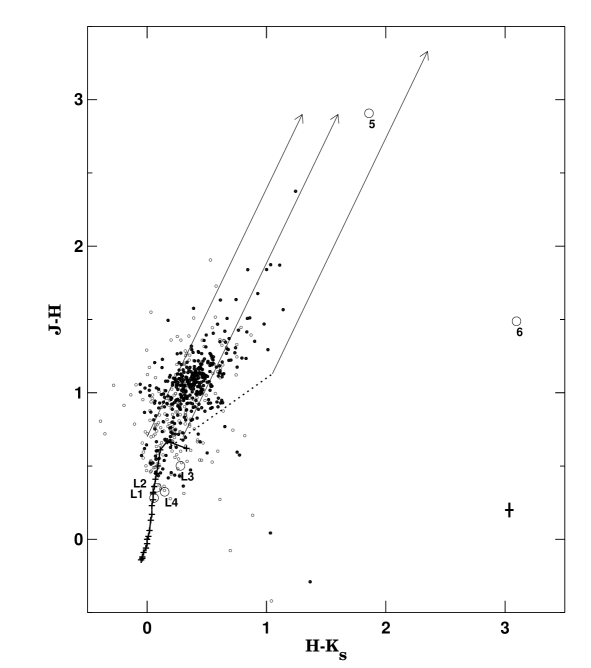
The vs. color-color diagram is show in Fig. 5. The cluster members are solid dots, and the field stars are open circles. As discussed above, we assume that the cluster is confined within 1.5 arcmin from the center and is statistically decontaminated for the field stars. Three reddening vectors are shown. The two on the left encompass the main sequence stars, whose unreddened sequence (Schmidt-Kaler sch82 (1982)) is represented as a solid line with crosses. The unreddened location of T Tauri stars (Meyer et al. mey97 (1997)) is indicated as a dashed line, and the rightmost reddening vector brackets the locus of the reddened T Tau stars. Throughout the paper we used the absorption ratios from Bessell et al. (bes98 (1998), Table A6). The six brightest stars with 2MASS photometry are shown as large open circles and are labeled from 1 to 6 (the label L stand for the stars with optical photometry of Lahulla (lah85 (1985))).
Clearly, Fig. 5 indicates that most of the stars are reddened main-sequence stars. Note that the color spread of cluster members is 0.1-0.2 mag – comparable with the of the typical photometric errors of 0.05 mag, – suggesting no differential extinction within the object at the level of (AV)1 mag.
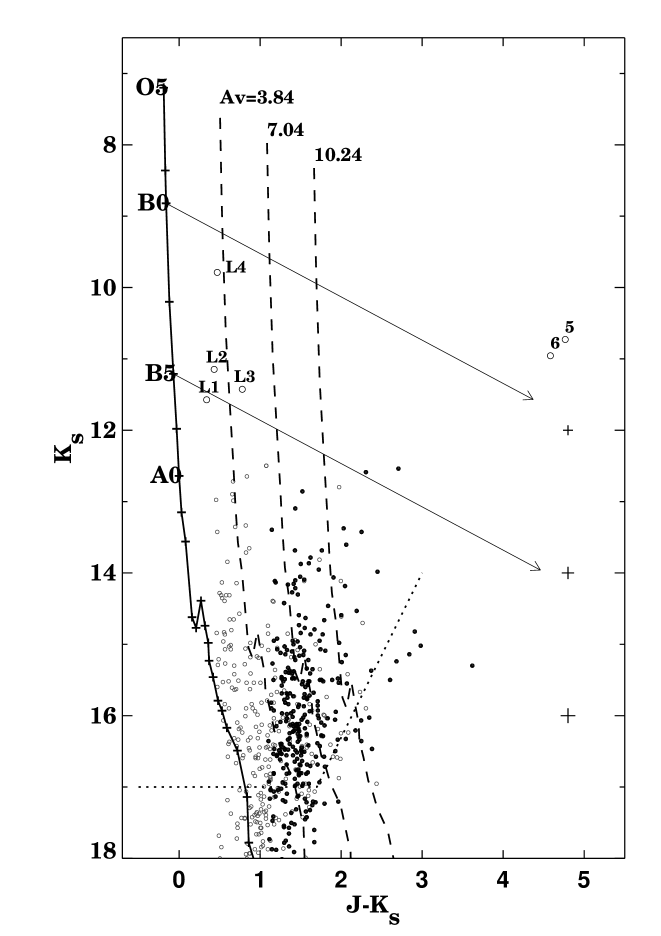
We will use the vs. color-magnitude diagram shown in Fig. 6 to estimate the extinction toward the cluster members. The basic symbols are the same as in Fig. 5. To plot the theoretical Main Sequence line (Schmidt-Kaler sch82 (1982)) we used as a first approximation the distance of mag (D=2.5 Kpc) determined by Hunter & Massey (hun90 (1990)), and based on the spectroscopy and optical photometry of the stars L3 and L4. The dashed lines are reddened Main Sequences for E()=1.2, E()=2.2, and E()=3.2 mag. The reddening vectors for B0V and B5V stars correspond to AV=20 mag and RV=3.2. We assumed that the brightest stars L1, L2, L3, and L4 are affected by a relatively small visual extinction - 2.5-5 mag, - compared with the fainter stars. A comparison with the location of “field” stars suggests that they are subject only to foreground extinction. In other words, the stellar winds from the most massive stars have already cleared out their own dust envelopes. The spectral type of L3 is B: and of L4 is B0V (Hunter & Massey hun90 (1990)). They are probably among the major contributors to the excitation of Sh 2-228. Note that in our following considerations we adopted for L3 the spectral types derived by Crampton et al. (cra78 (1978)) who give B2IV, since the classification of Hunter & Massey (hun90 (1990)) – B: – is somewhat uncertain.
Stars 5 (=05:13:26.08 =+37:27:08.27) and 6 (=05:13:25.7 =+37:27:10.7), located at the center of Sh 2-228 are extremely reddened. They have =10.73, =4.77, =1.86 and =10.96, =4.58, =3.10 mag, respectively. If they are main sequence stars with E()=4.93 and E()=4.74 mag, they have visual extinctions of AV=27.2 and AV=26.2 mag. Star 5 could be also T Tauri star and in this case AV=17.6 mag. And finally, this star could be an Herbig AB star. Most of the cluster members occupy the locus between E()=1.2 and E()=3.2 mag. Approximately 20 of them show indications of IR excess. We adopt as a mean reddening of the cluster E()=2.4.
4.4 Photometric Distance
An approximate distance estimate, was carried out, based on the optical spectral classification of individual stars, following the example of Hunter at al. (hun90 (1990)). However, we used the infrared luminosity of the stars, minimizing the reddening effects. For the stars with known spectral types (L3 and L4), we compared our observed color with the intrinsic one (Schmidt-Kaler sch82 (1982)) to determine E(), AV and A. Next, we used the apparent and the absolute (Schmidt-Kaler sch82 (1982)) magnitudes for the given spectral class to derive the distance moduli: =12.61 mag for L3 and =12.51 mag for L4. Our final distance modulus is =12.560.08 mag (D=3.50.1 Kpc). The error includes the standard deviation of the mean value, the uncertainties of photometry, and the photometric calibration. A possible unaccounted sources of systematic errors are the unreddened colors but we have no way of estimating them. Our result falls into the limits (2.4-5 Kpc) given by Hunter at al. (hun90 (1990)).
4.5 Cluster Age
We estimated approximately the age of the cluster and field stars by comparing the observed and theoretical luminosity functions (LF), closely following the method used by Porras et al. (por00 (2003)). Strom et al. (1993) presented an evolutionary sequence of six band LFs for 0.3, 0.7, 1, 3 and 7 Myr. We used E()=2.4 and E()=1.2 mag for the cluster and the filed stars, respectively, and =12.56 mag. We applied the Kolmogorov-Smirnov test to the observed and theoretical LFs, looking for the closest resemblance. With and the Kolmogorov-Smirnov favors 3 Myr for the cluster stars and 7 Myr for field population. Our best eye-ball match determined a similar age of 1-2 Myr for the cluster population, and 5-6 Myr for the fields. Model predicted and observed band LF are presented in Fig. 7.

The color-magnitude diagram of CC 01 is compared with the main sequence of S233IR with estimated age of 3 Myr (Porras et al. por00 (2003)) in the right panel of Fig. 7 . The main sequence stars in CC 01 are shown with solid dots, and the S233 stars – with asterisk. We adopted for CC 01: E()=2.4 and =12.56 mag. The parameters of S233IR are taken from Porras et al. (por00 (2003); Table 1). As can be seen we have a good agreement between our photometry and that 3 Myr young cluster.
4.6 Initial Mass Function and Total Cluster Mass
Once the distance, the extinction, and the age of the cluster are known, it is easy to determine approximately the slope of the initial mass function (hereafter IMF). We adopted the 3 Myr isochrone, and counted cluster stars between reddening lines, originating from positions on the isochrone for different initial masses (Fig. 8). The region between 2.5 and 5 was treated as a single bin to avoid ambiguity. The derived slope over the range 0.6-20 is 2.230.16, close to the Salpeter (sal55 (1955)) slope of 2.35 (Fig. 9). We used least square fit, weighted by the statistically uncertainly of the number of stars in each bin. The lower mass limit corresponds to the completeness limit of our photometry. However, the excellent agreement between the number of stars in the 0.4-0.6 bin and the IMF suggest that our completeness limit might be conservative.

This estimate of the IMF slope is an approximation because of both the observational errors, and the systematic uncertainties related to the isochrones, or model-generated luminosity functions. Only spectroscopic observations allow to obtain accurate stellar masses.

Finally, we estimated the total cluster mass by integrating the IMF over the entire range from 0.1 to 20, to obtain . The uncertainty – which takes into account the error in the slope, and the distance to the cluster – is dominated by the extrapolation toward the low mass stars.
We removed the fore- and background contribution only statictically and we extrapolated the IMF toward low mass stars linearly (in log-log space) while it has been shown that the IMF flattens or turns over at 0.8 (i.e. Briceño et al. bri02 (2002)). These effects are irrelevant for the goal of this work because we are searching for massive clusters, and therefore, an upper mass limit is sufficient. In fact, our extrapolation produces an overestimate nearly by a factor of two because about half of the total mass derived above falls into the 0.1-0.2 bin. The lower mass limit is also somewhat debatable, but the flattening of the mass function renders the uncertainty negligible.
5 Discussion and Summary
We report three new obscured Milky Way clusters discovered using our algorithm that searches for peaks in the stellar surface density histogram of the 2MASS point source catalog. This search completes the 5x5 arcmin bin survey. One more cluster was discovered serendipitously during a visual inspection of the candidates. In most of the cases the 2MASS photometry is insufficiently deep to assess the nature of the clusters. Follow-up near infrared imaging of some objects is planned.
We also present the first deep , , and imaging of the cluster CC 01. The goal of this project – to search for massive obscured clusters, analogs of the Arches, – makes it vital to derive the total mass or at least an upper limit to it. To achieve this we estimated the cluster age to 1-3 Myr, the distance modulus (m-M)0=12.560.08 mag (D=3.5 Kpc), and the extinction AV2.4 mag. Finally, we derived the slope of the IMF for clusters stars: =2.230.16, which is close to the canonical Salpeter slope of 2.35. The integration over the IMF yielded an upper limit to the total cluster mass of =1800200.
CC 01 appears to be a regular “run of the mill” star formation region, including the asymmetrical shape. For example, it is very similar to S233IR cluster (Porras et al por00 (2003)) and the clusters associated with Hii regions Sh 217 and Sh 219 (Deharveng et al. 2003a ). All they contain young stars with an upper mass limit of 10 , and are located at the periphery of the Hii regions. The presence of associated mid infrared, radio, and/or X-ray sources is also typical for this class of objects.
Deharveng et al. (2003b ) suggested that such companion clusters can be formed in the framework of the “collect and collapse” model (Elmegreen & Lada elm77 (1977); Whitworth et al. whi94 (1994); Elmegreen elm98 (1998)). This model predicts that when an Hii region expands, the dense neutral material accumulates between the ionization front and the shock front which precedes it on the neutral side. The decelerating shocked layer can become unstable and collapse, as it is probably the case of CC 01. Thus, CC 01 can well be another example of second-generation cluster, formed recently from the surrounding Hii region.
Acknowledgements.
This publication makes use of data products from the Two Micron All Sky Survey, which is a joint project of the University of Massachusetts and the Infrared Processing and Analysis Center/California Institute of Technology, funded by the National Aeronautics and Space Administration and the National Science Foundation. This research has made use of the SIMBAD database, operated at CDS, Strasbourg, France. J.B and V.I thanks to F. Cameron and M. Catelan for useful comments. The authors gratefully acknowledge the comments by an anonymous referee. J.B. is supported by FONDAP Center for Astrophysics grant number 15010003.References
- (1) Bessell, M.S., Castelli, F., & Plez, B. 1998, A&A, 333, 231
- (2) Bica, E., Dutra, C.M., & Badbuy, B. 2003, A&A, 397, 177
- (3) Bica, E., Dutra, C.M., Soares,J. & Badbuy, B. 2003, A&A, 404, 223
- (4) Briceño, C., Luhman, K.L., Hartmann, L., Stauffer, J.R., & Kirkpatrick, J.D. 2002, ApJ, 580, 317
- (5) Carpenter, J.M., Snell, R.L., Schloerb, F.P., & Skrutskie, M.F. 1993, ApJ, 407, 657
- (6) Crampton, D., Georgelin, Y.M. & Georgelin, Y.P. 1978, A&A, 66, 1
- (7) Dobashi, K., Bernard, J.-P., Yonekura, Y., & Fukui, Y. 1994, ApJS, 95, 419
- (8) Elmegreen, B., 1998, in ASP Conf. Ser., 148, Origins, eds. C.E.E. Woodward, J.M. Shull & H.A. Tronson, 150.
- (9) Elmegreen, B., Lada, C., 1977, ApJ, 214, 725
- (10) D’Antona, F., Mazzitelli, I., 1994, ApJS, 90, 467
- (11) Deharveng, L.,Zavagno, A., Caplan, J., Lefloch, B, Salas, L. et al., 2003a, RevMexAA, 15, 160
- (12) Deharveng, L.,Zavagno, A., Salas, L., Porras, A., Caplan, J. et al., 2003b, A&A, 399, 1135
- (13) Dutra, C.M. & Bica, E. 2002, A&A, 383, 631
- (14) Hunter, D.A. & Massey, P. 1990, AJ, 99, 846
- (15) Hunter, D.A. 1992, ApJS, 79, 469
- (16) Hurt, R.L., Jarrett, T.H., Kirkpatrick, J.D., Cutri, R.M., Schneider, S.E., Skrutskie, M., & van Driel, W. 2000, AJ, 120, 1876
- (17) Ivanov, V.D., Borissova, J., Pessev, P., Ivanov, G.R., Kurtev, R. 2002, A&A, 394, 1 (Paper I)
- (18) Lada, C., Lada, E., 1991, ASP Conf., SER., vol. 13, p.3
- (19) Lahulla, J.F. 1985, A&AS, 61, 537
- (20) Minkowski, R. 1948, PASP, 59, 257
- (21) Meyer, M., Calvet, N., Hillenbrand, L., 1997, AJ, 114, 228
- (22) Nagata, T., Hyland, A.R., Straw, S.M., Sato, S., & Kawara, K. 1993, ApJ, 406, 501
- (23) Persi, P., Tapia, M., Roth, M., 2000, A&A, 357, 1020
- (24) Persi, P., Roth, M., Tapia, M. et al., 1994, A&A, 282, 474
- (25) Porras, A., Cruz-Gonzalez, I., Salas, L., 2000, A&A, 361, 660
- (26) Reylé C. & Robin, A.C. 2002, A&A, 384, 403
- (27) Salpeter, E.E. 1955, ApJ, 121, 161
- (28) Schmidt-Kaler, T., 1982, in Landolt-Borstein, New Series, Group VI, vol. 2, ed. K. Schaifers & H.H. Voigt (Berlin: Springer-Verlag),1
- (29) Sharpless, S. 1959, ApJS, 4, 257
- (30) Stetson, P. B. 1991a, in ASP Conf. Ser. Vol. 13, The Formation and Evolution of Star Clusters, ed. K. A. Janes (San Francisco: ASP), 88
- (31) Stetson, P. B. 1991b, in Precision Photometry: Astrophysics of the Galaxy, ed. A. G. D. Philip, A. R. Upgren, & K. A. Janes (Schenectady: L. Davis Press), 69
- (32) Stetson, P. B. 1993, User’s Manual for daophot ii
- (33) Stetson, P. B., & Harris, W. E. 1988, AJ, 96, 909
- (34) Storm, K., Strom, S., Merrill, M., 1993, ApJ, 233
- (35) Tapia, M. , Roth, M.,Lopez, J. et al., 1991, A&A, 242, 388
- (36) Tapia, M. ,Persi, P., Roth, M., 1996, A&A, 316, 102
- (37) Whitworth, A., Bhattal, A., Chapman, S., Disney, M., Turner, J., 1994, MNRAS, 268, 291