Hot Gas in the Circumstellar Bubble S 308
Abstract
S 308 is a circumstellar bubble blown by the WN4 star HD 50896. It is one of the only two single-star bubbles that show detectable diffuse X-ray emission. We have obtained XMM-Newton EPIC observations of the northwest quadrant of S 308. The diffuse X-ray emission shows a limb-brightened morphology, with a clear gap extending from the outer edge of the diffuse X-ray emission to the outer rim of the nebular shell. The X-ray spectrum of the diffuse emission is very soft, and is well fitted by an optically thin plasma model for a N-enriched plasma at temperatures of K. A hotter gas component may exist but its temperature is not well constrained as it contributes less than 6% of the observed X-ray flux. The total X-ray luminosity of S 308, extrapolated from the bright northwest quadrant, is ergs s-1. We have used the observed bubble dynamics and the physical parameters of the hot interior gas of S 308 in conjunction with the circumstellar bubble model of García-Segura & Mac Low (1995) to demonstrate that the X-ray-emitting gas must be dominated by mixed-in nebular material.
1 Introduction
Fast winds from massive stars can interact with their ambient medium and blow bubbles. The physical structure of a bubble in a homogeneous interstellar medium (ISM) has been modeled by Weaver et al. (1977). In their model of a pressure-driven bubble, the shocked fast wind reaches temperatures of 107–108 K and forms a contact discontinuity with the cool (104 K), dense shell of swept-up ambient medium. Heat conduction and mass evaporation across this interface lowers the temperature and raises the density of the hot interior gas, producing 105–106 K gas that can be observed at ultraviolet and X-ray wavelengths.
Of all known bubbles blown by single massive stars, only two show detectable diffuse X-ray emission: NGC 6888 and S 308 (Bochkarev, 1988; Wrigge et al., 1994; Wrigge, 1999). PSPC and SIS observations of NGC 6888 showed a limb-brightened X-ray morphology and spectra that were best fitted by a dominant component at 1.5106 K and a weaker component at 8106 K (Wrigge et al., 1994, 1998, 2003). PSPC observations of S 308 detected X-ray emission near the shell rim, but detailed analysis was hampered by the low surface brightness and the obstruction of the PSPC window support structure projected near the shell rim (Wrigge, 1999).
Both NGC 6888 and S 308 have Wolf-Rayet (WR) central stars and show enhanced N and He abundances in the nebulae, suggesting that they consist of stellar material ejected by the central stars during the red supergiant (RSG) phase (Esteban et al., 1992). If the RSG mass loss rate was constant, the density of the circumstellar material would fall off with a dependence, where is the radius. The formation and evolution of a bubble blown in such a circumstellar medium has been calculated analytically by García-Segura & Mac Low (1995), and numerically simulated by García-Segura et al. (1996) specifically for WR central stars with RSG progenitors.
Wrigge et al. (1998, 2003) modeled the diffuse X-ray emission from NGC 6888 by incorporating Weaver et al.’s (1977) heat conduction in the analytical solution of García-Segura & Mac Low (1995), and found that the model could not explain simultaneously the observed limb-brightened morphology, surface brightness, and the presence of a high temperature component. By reducing the efficiency of heat conduction at the interface, it was possible to reproduce the limb-brightened morphology but not the surface brightness.
The recently launched XMM-Newton Observatory has unprecedented sensitivity in the soft X-ray band, and thus provides an excellent opportunity to observe the hot gas in bubble interiors. We have obtained XMM-Newton observations of S 308. This paper reports our analysis of this new X-ray observation and discusses the implications of our results on the physical structure of S 308’s hot interior.
2 XMM-Newton Observations of S 308
S 308 was observed with the XMM-Newton Observatory on 2001 October 23-24, in Revolution 343, using the EPIC/MOS1, EPIC/MOS2, and EPIC/pn CCD cameras (Observation ID 79570201). The two EPIC/MOS cameras were operated in the full-frame mode for a total exposure time of 47.0 ks, and the EPIC/pn camera in the extended full-frame mode for 43.0 ks. For all observations, the medium optical blocking filter was used. The angular resolution of the EPIC cameras at energies below 1 keV is 6″, and the energy resolutions of the EPIC/MOS and EPIC/pn CCDs are 60 eV and 100 eV at 1 keV, respectively (Dahlem, 1999; Strüder et al., 2001).
We received the XMM pipeline products, and processed them further using the XMM-Newton Science Analysis Software (SAS version 5.3.3) and the calibration files from the Calibration Access Layer available on 2002 October 22. The event files were screened to eliminate bad events, such as those due to charged particles. For the EPIC/MOS observations, only events with CCD patterns 0–12 (similar to ASCA grades 0–4) were selected; for the EPIC/pn observation, only events with CCD pattern 0 (single pixel events) were selected. As the background directly affects the detectability of diffuse X-ray emission, periods of high background have to be excluded. We assessed the background by binning the data over 100 s time intervals for each instrument in the 10–12 keV energy band; the background was considered high if the count rates were 0.3 cnts s-1 for the EPIC/MOS or 1.5 cnts s-1 for the EPIC/pn. Unfortunately, 15 ks after the observation of S 308 started, a high-background flare occurred and persisted throughout the rest of the observation. The useful exposure times were thus reduced to 22.7 ks and 16.9 ks for the EPIC/MOS and EPIC/pn observations, respectively.
3 Spatial Distribution of Diffuse X-ray Emission from S 308
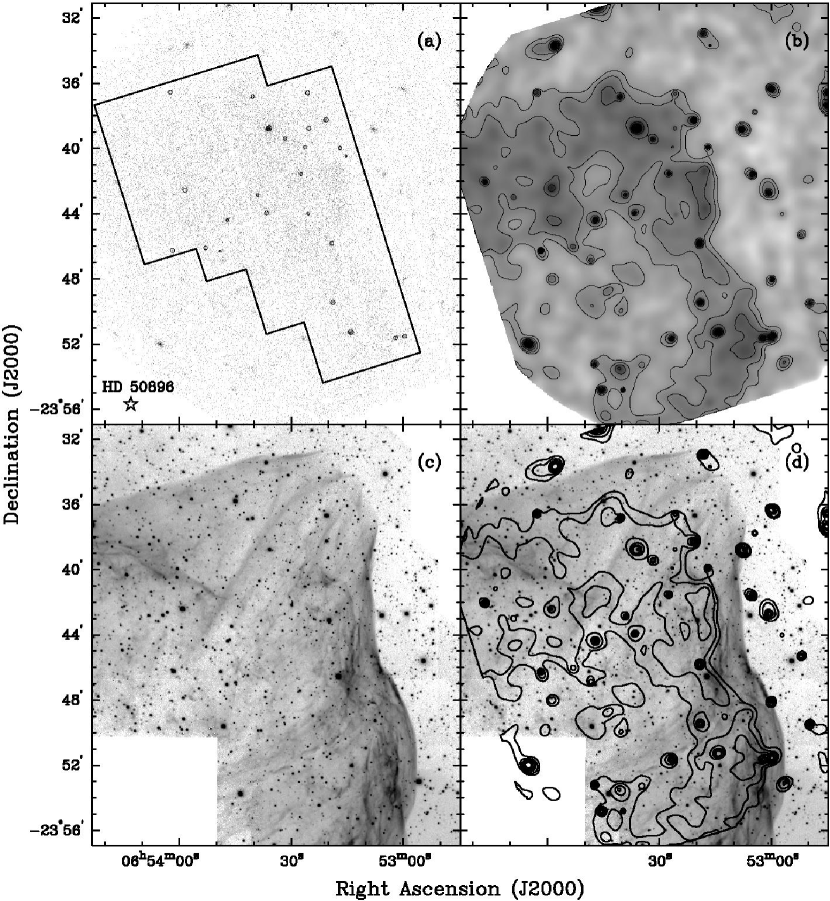
We have observed only the bright northwest quadrant of S 308 because the field-of-view of the EPIC cameras is smaller than the angular extent of the bubble. To produce an X-ray image of S 308, we first extract images in the 0.25–1.15 keV energy band from the EPIC/pn and EPIC/MOS observations individually, then mosaic these three images together to increase the S/N ratio and to reduce the null exposure in the gaps between CCDs. This energy band includes all photons detected from S 308, as shown later in §4. The images are sampled with a pixel size of 2″, which is adequate for the resolution of EPIC cameras. The mosaicked raw EPIC image is presented in Fig. 1a. This image is adaptively smoothed with Gaussian profiles of FWHM ranging from 2″ to 50″, and divided by a normalized exposure map to remove the telescope and instrument sensitivity variations across the field. The resultant image is presented in grey scale with contours in Fig. 1b.
Diffuse X-ray emission from S 308 is clearly detected, and a limb-brightened morphology is seen. To compare the distribution of diffuse X-ray emission to the cool nebular shell, we present an [O III] 5007 line image of S 308 from Gruendl et al. (2000) in Fig. 1c, and plot the X-ray contours extracted from the smoothed EPIC image over the [O III] image in Fig. 1d. The diffuse X-ray emission is completely interior to the optical shell. An apparent gap exists between the outer edge of the diffuse X-ray emission and the outer rim of the optical shell. Close inspection shows bright optical filaments delineating the brightest X-ray-emitting regions. It is not clear whether the gap between the outer edge of the X-ray and optical emission regions is caused by a lack of X-ray emission or additional absorption from the nebular shell.
The optical shell of S 308 shows a protrusion in the northwest corner, suggesting a blowout. This is a very mild case of blowout because its X-ray edge recedes the farthest from the optical shell edge, unlike the superbubble N44’s blowout where the diffuse X-ray emission extends beyond the optical shell (Chu et al., 1993).
4 Physical Properties of the Hot Gas in S 308
The physical properties of the hot gas in S 308 can be determined by modeling the observed X-ray spectrum. We have extracted spectra from the event files of the three EPIC cameras separately, using a source aperture outlined in Fig. 1a, and a background aperture exterior to S 308 but with a similar area, 210 arcmin2. Small regions encompassing X-ray point sources are excised from the source and background apertures. For illustration, regions around the point sources within the source aperture are marked in Fig. 1a. The background-subtracted, vignetting-corrected spectra binned by a constant channel width of 15 eV are displayed in Fig. 2. The EPIC/pn and EPIC/MOS spectra show similar shapes, but the EPIC/pn camera is more sensitive and has detected a larger number of counts, 7,900 150 cnts. We have thus concentrated on the EPIC/pn spectrum for further analysis and discussion.
The EPIC/pn spectrum of S 308 is very soft, peaking at the He-like triplet of N VI at 0.42–0.43 keV and declining sharply toward higher energies. Above 0.7 keV, the spectrum shows only possibly weak emission at 0.92 keV, corresponding to the He-like triplet of Ne IX; no emission is detected beyond 1.0 keV. The presence of line features suggests thermal plasma emission; therefore, we have used the MEKAL optically-thin plasma emission model (Kaastra & Mewe, 1993; Liedahl et al., 1995) to simulate the X-ray spectrum of S 308. The observed spectrum is simulated by passing the MEKAL model spectrum through an interstellar absorption with cross-sections from Balucińska-Church & McCammon (1992) and convolving it with the EPIC/pn response matrices. The simulated spectra are compared to the observed spectrum in the 0.3–2.0 keV range. The best-fit model, judged by the statistics, gives the plasma temperature, volume emission measure, and foreground absorption.
The input parameters for the spectral fitting include the temperature and abundances of the emitting plasma, and the column density and abundances of the foreground absorbing medium. It is impractical to allow all these parameters to vary freely in the spectral fits because the spectral resolution is limited and the number of photons detected is modest. We have therefore used independently determined information to constrain the model parameters and fix them whenever possible. First, we adopt the solar abundances for the foreground absorbing material, since S 308 is at a distance of kpc.111Several distances to HD 50896 have been reported, ranging from 0.6+0.4-0.2 kpc measured by Hipparcos (Perryman et al., 1997) to 1.8 kpc determined from interstellar absorption lines (Howarth & Schmutz, 1995). We have critically examined the data from the latter work and conclude that the interstellar absorption convincingly demonstrates that HD 50896 cannot be closer than 1 kpc, ruling out the near distance by Hipparcos. The systemic velocity of S 308, derived from the average velocity near the nebular center, and the average velocities of the neighboring H II regions S 303 and S 304 are all near = km s-1 (Chu et al., 1982). The kinematic distance estimated from this radial velocity and the Galactic rotation is kpc. The photometric distance to HD 50896 is kpc (van der Hucht, 2001). Combining the latter three distances, we decide to adopt a distance of kpc to HD 50896. Next we consider the abundances of the X-ray-emitting plasma. While the hot gas contains shocked fast stellar wind, its mass may be dominated by nebular material evaporated across the conduction front or ablated by the fast stellar wind (Weaver et al., 1977; Pittard et al., 2001a, b). Thus, we start the spectral fits using the nebular abundances of S 308. For He, O, N, and Ne, we adopt the abundances determined from optical spectrophotometry by Esteban et al. (1992). For Mg and Fe, we assume that their abundances relative to the solar values are tied to that of O. The C abundance of the nebula is unknown, although the N/C abundance ratio of the fast wind has been determined to be 14 within a factor of 3 uncertainty (Hillier, 1988). We adopt a 0.1 solar abundance for C, which is somewhat arbitrary but compatible with the stellar wind abundances. The final abundances of C, N, O, Ne, Mg, and Fe we have adopted for the MEKAL model are 0.1, 1.6, 0.13, 0.22, 0.13, and 0.13 times the solar values (Anders & Grevesse, 1989), respectively.
Using the above nebular abundances for single-temperature MEKAL models, it is possible to reproduce the bulk spectral shape with a plasma temperature of keV (or K). To improve the spectral fits and to search for the possible existence of hotter gas expected from a shocked fast wind, we have also fit the observed spectrum with two temperature components. Only a small improvement is achieved, as the reduced of the single-temperature and two-temperature best fits are = 1.12 and 1.02, respectively. The best-fit single-temperature model and the low-temperature component of the best-fit two-temperature model are virtually indistinguishable from each other; thus only the best-fit two-temperature MEKAL model is overplotted on the EPIC/pn spectrum in Fig. 3. The absorption column density is 1.11021 cm-2; the temperatures, normalization factors, observed fluxes, and unabsorbed fluxes of these two temperature components are summarized in Table 1. The low temperature component has an accurate temperature and dominates the X-ray emission, while the high temperature component is not well constrained in temperature because it is weak and contributes only 6% of the observed flux, or 1.5% of the unabsorbed flux.
We have also tried spectral fits using MEKAL models with two temperature components and freely varying abundances, and find that the EPIC/pn spectrum can be reasonably well described by temperature components at keV and keV with N, O, and C abundances at 5.6, 0.37, and 0.3 times solar values, respectively. These abundances are 3–4 times as high, but the N/C ratio (18 times the solar value) and the temperatures of the two thermal components are similar to those of our best-fit model with fixed nebular abundances. Furthermore, both fixed abundance and freely varying abundance model fits show that the low-temperature component dominates the observed X-ray flux. For a K plasma with collisional ionization equilibrium, N and C exist mainly in He-like ions, and thus the N/C abundance ratio can be constrained by the relative strengths of N VI lines at 0.43 keV and C V lines at 0.3 keV, or the spectral shape below 0.5 keV. The absolute abundances, on the other hand, are not well constrained because the spectral resolution does not allow unambiguous separation of line emission and bremsstrahlung emission. Therefore, we conclude that the diffuse X-ray emission of S 308 originates mostly from N-enriched gas at a temperature of K. This temperature is noticeably lower than the plasma temperatures observed in planetary nebulae or superbubbles (Chu et al., 2001; Guerrero, Gruendl, & Chu, 2002; Kastner et al., 2000, 2001; Dunne et al., 2003; Townsley et al., 2003).
Finally, we have compared our EPIC/pn spectrum of S 308 to Wrigge’s (1999) best-fit model for the ROSAT PSPC spectrum. Wrigge’s model consists of two components at temperatures of K and K, with the high-temperature component contributing about 1/3 of the total X-ray flux. Our EPIC/pn spectrum clearly rules out the presence of this high-temperature component, which may be caused by a combination of a low S/N in the PSPC data and contaminations from the numerous point sources projected within the boundary of S 308. These point sources are resolved by the XMM-Newton EPIC cameras but not the ROSAT PSPC detector.
5 Discussion
5.1 Dynamical Parameters of the S 308 Bubble
S 308 is a bubble blown by the WN4 star HD 50896 (Johnson & Hogg, 1965) in a circumstellar medium that was ejected by its progenitor during the RSG phase (Esteban et al., 1992). At a distance of kpc, its 20′ radius corresponds to pc. The nebular shell of S 308 is photoionized, but additional shock heating is present as the nebular [O III]5007/H ratios are as high as 20 (Esteban et al., 1992). The presence of shocks is also evidenced in the nebular morphology at the shell rim where the [O III] emission leads the H emission by 16–20′′ (Gruendl et al., 2000). The S 308 shell resides inside an H I cavity evacuated by the stellar wind of HD 50896’s main-sequence progenitor, with the optical nebulae S 303 and S 304 (Fig. 1a of Chu et al., 1982) as part of the fossil swept-up interstellar shell (Arnal & Cappa, 1996). The overall nebular structure and environment of S 308 agree well with the expectations of García-Segura et al.’s (1996) models for WR bubbles.
Assuming that the RSG progenitor had a constant mass loss rate and a constant wind velocity , the circumstellar medium of HD 50896 would have a radial density profile . Assuming further that the WR star has a constant mass loss rate and a constant terminal wind velocity , the bubble expansion velocity will be constant with
| (1) |
(García-Segura & Mac Low, 1995). For a shell expansion velocity of km s-1 (Chu et al., 1982) and a radius of pc, the dynamic age of S 308 is thus yr. The terminal velocity of HD 50896’s fast stellar wind has been well measured to be = 1,720 km s-1 (Prinja et al., 1990). The mass loss rate of HD 50896’s fast wind has been determined by Nugis et al. (1998) from IR and radio continuum measurements assuming a smooth wind or a clumped wind for a distance of 1.8 kpc. With the distance adjusted from 1.8 kpc to kpc, the smooth-wind and clumping-corrected mass loss rates of HD 50896 are M⊙ yr-1 and M⊙ yr-1, respectively. If we assume that the high electron temperature measured in the nebular shell, K (Esteban et al., 1992), is caused by shock heating, then the shock velocity has to be 30 km s-1. The RSG wind velocity can be approximated by the difference between the shell expansion velocity and the shock velocity, thus 30 km s-1; from Eq. (1) we then find the RSG mass loss rate to be M⊙ yr-1 for the case of smooth fast wind, or M⊙ yr-1 for the case of clumped fast wind.
The nebular shell of S 308 has a sharp rim, indicating that it is still surrounded by RSG wind material; however, the RSG wind material must not extend much further in radius, as a breakout has already occurred at the northwestern part of the shell. The unperturbed RSG wind material just exterior to the nebular shell was ejected at least years ago. As the fast WR wind started yr ago, the RSG wind lasted yr, and the total RSG mass loss would be M⊙ and M⊙ for the cases of smooth and clumped fast winds, respectively. Evidently, the former value is unrealistically large for a normal massive star; thus the total RSG mass loss confirms Nugis et al.’s (1998) suggestion that the clumping-corrected mass loss rates of WR stars are more accurate. Therefore, we will use only the clumping-corrected mass loss rate for the rest of the discussion. The physical parameters of the RSG progenitor and the nebular shell derived above are summarized in Table 2. Note that the velocity, mass loss rate, and total amount of mass loss of the RSG wind derived from bubble dynamics are all well within the canonical ranges of these parameters, and therefore provide a very satisfactory consistency check for the bubble dynamics.
5.2 The Hot Interior of S 308
The XMM-Newton observations of S 308 show an X-ray spectrum dominated by emission from a N-enriched medium at a temperature of K, with less than 6% of the observed flux contributed by hotter gas. This dominant temperature is almost two orders of magnitude lower than the post-shock temperature of the 1,720 km s-1 fast stellar wind, K, for a H/He ratio of 0.2 in the WR wind (Nugis et al., 1998). The cooling time scale for such hot gas is much longer than the dynamic age of the bubble; therefore, the observed low plasma temperature indicates that cool nebular material has been mixed into the shocked WR wind to lower the temperature. This mixing is supported by the limb-brightened X-ray morphology of S 308.
Two known mechanisms can mix nebular material with the hot gas: mass evaporation due to thermal conduction and mass loading due to dynamic ablation. The former mechanism has been incorporated into bubble models of Weaver et al. (1977) and Pittard et al. (2001a), and the latter mechanism has been used by Pittard et al. (2001b). To determine whether evaporation or ablation is responsible for the mixing in S 308, we need to know whether the WR wind is shocked and where the shock front is. In the bubble model of Weaver et al. (1977), the fast stellar wind encounters an inner, stagnation shock and the shocked stellar wind provides the thermal pressure to drive the expansion of the nebular shell. Thermal conduction at the interface between the hot interior gas and the cool nebular shell evaporates nebular material into the hot interior, but the bulk of the shocked fast wind remains hot and occupies most of the volume in the bubble interior. We may estimate the X-ray emission expected from the “uncontaminated” shocked stellar wind of HD 50896 and compare it to the observed diffuse X-ray emission from S 308. The WR wind of HD 50896 has injected M⊙ into the bubble interior during the lifetime of the bubble. If the shocked fast wind is uniformly distributed within the bubble interior (the worst-case scenario for emissivity and detectability), the electron density would be cm-3, for a H/He ratio of 0.2. The total volume emission measure of this shocked wind at K can be scaled to determine its expected normalization factor (see Table 1 for the definition of the normalization factor) for the aperture with which our EPIC spectrum was extracted; we find an expected normalization factor to be cm-5. Compared with the two temperature components from the best spectral fit listed in Table 1, the normalization factor expected for the X-ray emission from the uncontaminated shocked wind is fortuitously close to that of the component. If the hot shocked wind occupies only a fraction of the total volume, the expected normalization factor will be higher and would have been detected by our XMM-Newton observation if its useful exposure time was not shortened by a high background. Deeper X-ray observations are needed to place more stringent limits on the existence or absence of the shocked stellar wind at K.
We have used the best-fit spectral model to determine the unabsorbed X-ray flux from S 308, ergs cm-2 s-1 within the 210 arcmin2 aperture in the 0.25–1.5 keV energy band. This X-ray flux can be scaled to the entire area covered by the bubble to estimate the total X-ray luminosity. As the observed aperture contains the brightest patch of diffuse X-ray emission within S 308, the X-ray luminosity of S 308 should be ergs s-1. The rms electron density of the X-ray-emitting gas in S 308 can be determined from the normalization factor given in Table 1, cm-3, where is the volume filling factor of the hot gas. For = 0.5, the rms cm-3 and the total mass of the hot gas is M⊙; while for = 0.1, the rms cm-3 and the total mass of the hot gas is M⊙. As the limb-brightened morphology of the diffuse X-ray emission indicates a thick shell structure, the filling factor must be closer to 0.5 than 0.1. Therefore, the hot gas mass is much larger than the total WR wind mass that has been injected into the bubble interior, M⊙, suggesting that nebular material contributes to the hot gas mass and justifying the fixed nebular abundances we used for the spectral fits in §4.
Our present XMM-Newton observations do not detect enough photons to warrant a spatially resolved spectral analysis of S 308. Future deeper observations are needed to determine the radial temperature structure of the X-ray emitting gas. A complete mapping of S 308 is also needed to determine whether the varying morphology of the optical shell rim coincides with spatial and physical variations in the adjacent hot, X-ray emitting gas in the bubble interior.
5.3 Interface between the Hot Interior and the Cool Shell
UV observations in conjunction with X-ray observations of S 308 allow us to probe the interface between the hot gas in the bubble interior and the cool gas in the swept-up shell. High-resolution UV spectra of HD 50896 have detected a nebular N V absorption line component associated with the approaching side of the S 308 shell, and its large column density suggests an overabundance in nitrogen (Boroson et al., 1997). As the ionization potential of N IV is 77.5 eV, N V must be produced by collisional ionization in gas at temperatures of a few K, which is expected at the interface between the hot interior gas and the cool nebular shell of a bubble. The detection of N V absorption from the S 308 shell has provided the strongest evidence of the existence of an interface layer.
Our XMM-Newton X-ray image of S 308 reveals the relative location of the hot interior gas and the cool nebular shell (see Fig. 1d). The projected outer edge of the diffuse X-ray emission is offset from the projected outer edge of the [O III] emission by 90′′ to over 200′′, corresponding to 0.5 – 1.7 pc. As the [O III] rim depicts the outer shock associated with the swept-up shell advancing into the unperturbed RSG wind, this “gap” contains the swept-up shell and the interface layer where the temperature drops radially from 106 K to 104 K. The large angular size of this gap makes it the most promising site where an interface layer may be spatially resolved and studied in detail. Future long-slit high-dispersion spectra of the H + [N II] lines are needed to determine kinematically the exact width of the swept-up shell. We have been awarded Far Ultraviolet Spectroscopic Explorer (FUSE) observations of the O VI emission for three positions in S 308. While these FUSE observations of O VI emission may reveal the existence of K gas at the interface, the relatively large aperture () provides only modest spatial resolution. Future high-resolution, long-slit Hubble Space Telescope STIS UV spectra of the N V and C IV emission lines at the gap are needed to probe the temperature structure in the interface layer. Only through the analysis of these detailed multi-wavelength observations can we finally learn empirically how fast stellar winds interact with the ambient medium and test the various theoretical models of bubbles.
6 Summary and Conclusions
We have obtained XMM-Newton EPIC observations of the northwest quadrant of the circumstellar bubble S 308 blown by the WN4 star HD 50896. Diffuse X-ray emission is unambiguously detected, showing a limb-brightened morphology with a clear gap extending from the outer edge of the diffuse X-ray emission to the outer rim of the nebular shell. The X-ray spectrum of the diffuse emission is very soft, and is well fitted by an optically thin plasma model for a plasma at temperatures of K. For such a low temperature, the N/C abundance ratio is well constrained by the spectral shape below 0.5 keV; spectral fits with freely varying abundances and fixed nebular abundances show consistently that the N/C ratio of the hot gas in S 308 is 15–20 times the solar value. A hotter component may exist, but its temperature is not well constrained, K, and contributes less than 6% of the observed X-ray flux.
We have applied García-Segura & Mac Low’s (1995) analytical model for a WR bubble blown in the progenitor’s RSG wind to S 308, using observed bubble dynamics and stellar wind parameters, and derived the masses lost by HD 50896 via the RSG wind and the WR wind. We have also used the X-ray data to determine the mass of the X-ray-emitting gas in the bubble interior. The results are summarized in Table 2. It can be seen that the mass in the hot gas is indeed much larger than the total mass injected by the WR wind, indicating that the hot gas is dominated by the nebular material mixed into the bubble interior. It is not clear whether the mixing is through conductive evaporation or dynamic ablation. Deep X-ray observations are needed to detect hotter gas and to resolve the temperature structure in the bubble interior. Spatially resolved UV spectroscopic observations of the interface between the X-ray-emitting gas and the cool nebular gas are also needed to probe the physical mechanisms that mix the nebular material into the hot interior.
References
- Anders & Grevesse (1989) Anders, E., & Grevesse, N. 1989, Geochim. Cosmochim. Acta, 53, 197
- Arnal & Cappa (1996) Arnal, E. M., & Cappa, C. E. 1996, MNRAS, 279, 788
- Balucińska-Church & McCammon (1992) Balucińska-Church, M., & McCammon, D. 1992, ApJ, 400, 699
- Bochkarev (1988) Bochkarev, N. G. 1988, Nature, 332, 518
- Boroson et al. (1997) Boroson, B., McCray, R., Clark, C. O., Slavin, J., Mac Low, M., Chu, Y., & Van Buren, D. 1997, ApJ, 478, 638 [Erratum: 1997, ApJ, 485, 436]
- Chu et al. (2001) Chu, Y.-H., Guerrero, M. A., Gruendl, R. A., Williams, R. M., & Kaler, J. B. 2001, ApJ, 553, L69
- Chu et al. (1993) Chu, Y.-H., Mac Low, M. M., García-Segura, G., Wakker, B., & Kennicutt, R. C. 1993, ApJ, 414, 213
- Chu et al. (1982) Chu, Y.-H., Gull, T. R., Treffers, R. R., Kwitter, K. B., & Troland, T. H.1982, ApJ, 254, 562
- Dahlem (1999) Dahlem, M. 1999, XMM Users’ Handbook
- Dunne et al. (2003) Dunne, B. C., Chu, Y.-H., Chen, C.-H. R., Lowry, J. D., Townsley, L., Gruendl, R. A., Guerrero, M. A., & Rosado, M. 2003, ApJ, 590, 306
- Esteban et al. (1992) Esteban, C., Vílchez, J. M., Smith, L. J., & Clegg, R. E. S. 1992, A&A, 259, 629
- García-Segura et al. (1996) García-Segura, G., Langer, N., & Mac Low, M.-M. 1996, A&A, 316, 133
- García-Segura & Mac Low (1995) García-Segura, G., & Mac Low, M. 1995, ApJ, 455, 145
- Gruendl et al. (2000) Gruendl, R. A., Chu, Y.-H., Dunne, B. C., & Points, S. D. 2000, AJ, 120, 2670
- Guerrero, Gruendl, & Chu (2002) Guerrero, M. A., Gruendl, R. A., & Chu, Y.-H. 2002, A&A, 387, L1
- Hillier (1988) Hillier, D. J. 1988, ApJ, 327, 822
- Howarth & Phillips (1986) Howarth, I. D., & Phillips, A. P. 1986, MNRAS, 222, 809
- Howarth & Schmutz (1995) Howarth, I. D. & Schmutz, W. 1995, A&A, 294, 529
- Johnson & Hogg (1965) Johnson, H. M., & Hogg, D. E. 1965, ApJ, 142, 1033
- Kaastra & Mewe (1993) Kaastra, J. S., & Mewe, R. 1993, Legacy, 3, 16, HEASARC, NASA
- Kastner et al. (2000) Kastner, J. H., Soker, N., Vrtilek, S. D., & Dgani, R. 2000, ApJ, 545, L57
- Kastner et al. (2001) Kastner, J. H., Vrtilek, S. D., & Soker, N. 2001, ApJ, 550, L189
- Liedahl et al. (1995) Liedahl, D. A., Osterheld, A. L., & Goldstein, W. H. 1995, ApJ, 438, L115
- Nugis et al. (1998) Nugis, T., Crowther, P. A., & Willis, A. J. 1998, A&A, 333, 956
- Perryman et al. (1997) Perryman, M. A. C. et al. 1997, A&A, 323, L49
- Pittard et al. (2001a) Pittard, J. M., Dyson, J. E., & Hartquist, T. W. 2001a, A&A, 367, 1000
- Pittard et al. (2001b) Pittard, J. M., Hartquist, T. W., & Dyson, J. E., 2001b, A&A, 373, 1043
- Prinja et al. (1990) Prinja, R. K., Barlow, M. J., & Howarth, I. D. 1990, ApJ, 361, 607
- Strüder et al. (2001) Strüder, L. et al. 2001, A&A, 365, 18
- Townsley et al. (2003) Townsley, L. K., Feigelson, E. D., Montmerle, T., Broos, P. S., Chu, Y.-H., Garmire, G. P. 2003, ApJ, 593, 874
- van der Hucht (2001) van der Hucht, K. A. 2001, New Astronomy Review, 45, 135
- Weaver et al. (1977) Weaver, R., McCray, R., Castor, J., Shapiro, P., & Moore, R. 1977, ApJ, 218, 377
- Wrigge (1999) Wrigge, M. 1999, A&A, 343, 599
- Wrigge et al. (1998) Wrigge, M., Chu, Y.-H., Magnier, E. A., & Kamata, Y. 1998, Lecture Notes in Physics, v.506, Berlin Springer Verlag, 506, 425
- Wrigge et al. (2003) Wrigge, M., Chu, Y.-H., Magnier, E. A., & Wendker, H. J. 2003, ApJ, submitted
- Wrigge et al. (1994) Wrigge, M., Wendker, H. J., & Wisotzki, L. 1994, A&A, 286, 219


| Components | aa =, where is the distance, is the electron density, and is the volume in cgs units. | |||
|---|---|---|---|---|
| (keV) | (cm-5) | (ergs cm-2 s-1) | (ergs cm-2 s-1) | |
| 0.094 0.009 | ||||
| Parameter | Value | Unit | Reference |
|---|---|---|---|
| Distance | kpc | ||
| Radius | pc | ||
| Expansion velocity () | km s-1 | Chu et al. (1982) | |
| Dynamic age | yr | ||
| Central star | HD 50896 | van der Hucht (2001) | |
| Spectral type | WN4 | van der Hucht (2001) | |
| Mass loss rate () | M⊙ yr-1 | Nugis et al. (1998)aaThis is their clumping-corrected mass loss rate with the distance adjusted from their 1.8 kpc to our kpc. | |
| Terminal wind velocity () | 1,720 | km s-1 | Prinja et al. (1990) |
| RSG mass loss rate () | M⊙ yr-1 | ||
| RSG wind velocity () | 30 | km s-1 | |
| Total RSG wind mass | M⊙ | ||
| Total WR wind mass | M⊙ | ||
| of the X-ray-emitting gas: | |||
| () | cm-3 | ||
| () | cm-3 | ||
| Mass of the X-ray emitting gas: | |||
| () | M⊙ | ||
| () | M⊙ |