The dark matter content of lensing galaxies at 1.5
Abstract
Many gravitationally lensed quasars exhibit flux ratio “anomalies” that cannot be explained under the hypothesis that the lensing potential is smooth on scales smaller than one kpc. Micro-lensing by stars is a natural source of granularity in the lens potential. The character of the expected fluctuations due to micro-lensing depends sensitively on the relative surface densities of micro-lenses (stars) and smoothly distributed (dark) matter. Observations of flux ratios may therefore be used to infer the ratio of stellar to dark matter along the line of sight – typically at impact parameters 1.5 times the half light radius. Several recently discovered systems have anomalies that would seem to be explained by micro-lensing only by demanding that 70-90% of the matter along the line of sight be smoothly distributed.
Massachusetts Institute of Technology, 77 Massachusetts Avenue, Cambridge MA 02139, USA
Universität Potsdam, Institut für Physik, Am Neuen Palais 10, 14469 Potsdam, Germany
1. The Problem
Schneider (this volume) discusses the flux ratio anomalies observed in gravitationally lensed quasars and their interpretation as the consequence of substructure within the intervening galaxy. The problem is illustrated by two quadruple systems: the archetype, PG1115+080 (Weymann et al. 1980), and one recently discovered, SDSS0924+0219 (Inada et al. 2003). The image configurations are nearly identical, so it is no surprise that models based on the image positions predict nearly identical flux ratios. But as seen in Figure 1, the observed flux ratios are dramatically different. In particular the and images in PG1115 are much more nearly equal in brightness than the corresponding pair, and , in SDSS0924.
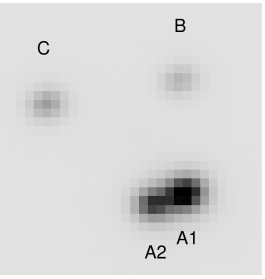
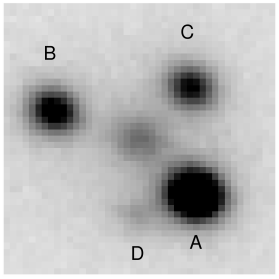
Metcalf and Zhao (2002) have argued that the two closest images in PG1115 ought to be yet more nearly equal than they are. One may well wonder whether the fluxes in any quadruple system have the expected ratios.
2. Solution A: Micro-lensing
Within months of the discovery of the first gravitational lens, Chang and Refsdal (1979) suggested that the observed flux ratios might be different from those predicted assuming smooth galaxy potentials owing to the granularity introduced by individual stars within the galaxy. There is evidence for such micro-lensing in the temporal behavior of lensed systems, most spectacularly in the quadruple system Q2237+0305 (e.g. Woźniak et al. 2002), but also in HE1104-1805 (Schechter et al. 2003) and, with somewhat less certainty, in another handful of systems (Wambsganss 2001). Indeed Vanderriest et al. (1986) report that in the early 1980s, the bright components in PG1115 were more nearly equal than they are in Figure 1, as Metcalf and Zhao’s models would predict.
But while stars might explain observed flux ratio anomalies in a quasar’s optical continuum, they cannot explain anomalies in its radio continuum. A micro-lens will cause brightness fluctuations only if its Einstein ring is larger than the lensed source. Radio continuum emission is thought to arise from regions very much larger than the typical stellar Einstein ring. The system CLASS 1555+375 (Marlow et al. 1999) is a radio analog of PG1115, with its two close images differing by a factor of two in flux. Something else is needed.
3. Solution B: Milli-lensing
Mao and Schneider (1998), Metcalf and Madau (2001), Chiba (2002), and Dalal and Kochanek (2002) invoke substructure with masses of order to explain radio anomalies. Such substructure would have to comprise a few percent of the mass along the line of sight. While globular clusters and dwarf galaxies occur too infrequently, N-body simulations (Moore et al. 1999; Kravtsov et al. 1999) indicate that galaxies ought to contain dark matter mini-halos capable of producing such milli-lensing (cf. Wambsganss and Paczyński 1992). Mao (this volume) discusses at length this interpretation of the radio anomalies.
4. Working Hypothesis: Micro-lensing

Flux ratio anomalies in the optical continuum may be due either to micro-lensing or milli-lensing. One might discriminate between the two by comparing optical fluxes with radio fluxes, but most quasars are radio quiet. Fortunately their are alternatives. Agol et al. (1999) have used mid-IR fluxes, which are also thought to arise from a relatively large region, instead of radio fluxes. More recently Wisotzki et al. (2003) have used broad emission line region (BLR) fluxes, which again are thought to arise from a much larger region than the Einstein rings of stars. For the quadruple system HE0435-1223, Wisotzki et al. find that the BLR fluxes fit a smooth model for the system a factor of four better than the continuum fluxes. As part of an HST study of just this effect (GO-9854), a similar result has been found for the system RXJ0911+0551. Without such measurements we cannot rule out milli-lensing as the source of the optical flux ratio anomaly in any given system. We shall nonetheless proceed on the working hypothesis that most (though certainly not all) of what we observe is due to micro-lensing.
5. Quantitative Micro-lensing
The positions of the four images of a quadruply lensed system yield macro-models (e.g. Keeton 2001) for the potential of the lensing galaxy. At each image position, the macro-models predict a well constrained dimensionless mass surface density, , and a shear, , that measures the differential stretching of the image. A predicted magnification for each image is straightforwardly computed from and . The largest source of error in the magnifications arises from the uncertainties in the radial profile of the lensing galaxy.
The lens’ surface mass density may not be perfectly smooth – it can be clumpy on scales small compared to the separation between images. If the surface density is clumpy on scales greater than or equal to the size of the emitting region of the quasar, the local values of and in the vicinity of the image (and therefore governing its actual magnification) will differ from those computed from the macro-model.
Consistent with our working hypothesis, we assume that a fraction of the surface density is in stars and that the remainder is in a smooth, presumably non-baryonic component. The stellar component is taken to be randomly distributed, and its statistical effects upon the magnification of images can be computed using a variety of techniques (e.g. Paczyński 1986; Wambsganss 1992; Witt 1993).
In Figure 2 we show results from simulations of a close pair of images with model parameters appropriate to the anomalous pair in SDSS0924. The smooth predictions would have the two images equally bright. The top two panels show the expected magnitude distribution assuming that 100% of surface density is in stars. The bottom two panels show the expected distributions for a stellar fraction of 20%. In all cases we have assumed a point source.
While the two images have rather similar probability distributions assuming 100% stars, they are very different assuming 20% stars. What distinguishes the two is the parity of the images. The image on the left, formed at a minimum of the light time, has positive parity. The image on the right, a saddlepoint of the travel time, has negative parity. Crude explanations of the different behaviors are given by Schechter and Wambsganss (2002) and by Granot, Schechter and Wambsganss (2003).
The probability of a given magnitude difference is obtained by shifting the panel on the left with respect to the panel on the right, taking the product of the two probabilities, and integrating over all magnitudes. A difference as large as 2.5 magnitudes is much more likely for the bottom two panels than for the top two, but only if the saddlepoint is fainter than the minimum (as it is).
6. Measuring the Stellar Fraction
The different behaviors of the images in a quadruple system as one varies the stellar fraction suggest a scheme for measuring the stellar mass fraction along the line of sight. Measure the fluxes, wait for the source to move or the stars to reconfigure, measure again, and accumulate magnification statistics for the four images. These may then be compared with predicted histograms for the four images under various assumptions about the stellar fraction. Kochanek (2003) has done something along these lines for the system Q2237+0305. But this system is unique in having a short timescale for change; for most quadruples the timescale for significant change is of order ten years.

Alternatively, one can obtain single epoch snapshots of a large number of systems. For each system, one calculates (by extension of the method described above) the probability of the observed flux ratios assuming some specific stellar fraction. One identifies the product of those probabilities with the likelihood of that stellar fraction.
We have carried out this second test for a sample of eleven quadruple systems with well measured optical continuum fluxes. The results are presented in Figure 3. The dot-dashed line shows the result of straightforward application of the method, with the likelihood peaking at a stellar fraction of 5%. This seems unlikely, since the stellar fraction at the position of the images, calculated using the observed surface brightness profiles of the lensing galaxies and assuming a “reasonable” mass-to-light ratio would put 20% of the mass in stars.
But we took our quasars to be very nearly point sources. Had we taken the angular size of the quasar’s continuum emitting region to be comparable to the Einstein ring of an intervening star, we would expect smaller fluctuations. As the fluctuations are largest toward the middle of the range of stellar fractions plotted (Schechter and Wambsganss 2002), this drives the peak toward the center of the figure. We have plotted results for a very simple extended model, taking 50% of the optical flux to come from a pointlike source and 50% from a source very much larger than the stellar Einstein rings. The results, plotted as a solid line in Figure 3, are more in line with our expectations, and would seem to exclude the possibility that all of the surface density is in the form of stars.
The likelihoods calculated for individual objects are quite broad. As seen from the dashed line in Figure 3, it is largely because of SDSS0924 that a 100% stellar fraction is ruled out. If the large flux ratio anomaly observed in its optical continuum is not seen the emission line flux ratios, this system, by itself, presents strong evidence for a smooth dark matter component.
References
Agol, E. et al. 2000, ApJ, 545, 657
Chang, K. & Refsdal, S. 1979, Nature, 282, 561
Chiba, M. 2002, ApJ, 565, 17
Dalal, N. & Kochanek, C. 2002, ApJ, 572, 25
Granot, J., Schechter, P. L. & Wambsganss, J. 2003, ApJ, 583, 575
Inada, N. et al. 2003, preprint, astro-ph/0304377
Kravtsov, A. et al. 1999, ApJ, 522, 82
Keeton, C. R. 2001, preprint, astro-ph/0102340
Kochanek, C. S. 2003, preprint, astro-ph/0307422
Mao, S. & Schneider, P. 1998 MNRAS, 295, 587
Marlow, D. R. et al. 1999, AJ, 118, 654
Metcalf, R. B. & Madau, P. 2001, ApJ, 563, 9
Metcalf, R. B. & Zhao, H. 2002, ApJ, 567, L5
Paczyński, B. 1986 ApJ301, 503
Moore B. et al. 1999, ApJ, 524, L19
Schechter, P. L. & Wambsganss, J. 2002, ApJ, 580, 685
Schechter, P. L. et al. 2003, ApJ, 584, 657
Vanderriest, C. et al. 1986 A&A, 158, L5
Wambsganss, J. 1992, ApJ, 386, 19
Wambsganss, J. 2001, PASA, 18, 207
Wambsganss, J. & Paczyński, B. 1992, ApJ, 397, L1
Weymann, R. J. et al. 1980, Nature, 285, 641
Wisotzki, L. et al. 2003, preprint, astro-ph/0307147
Witt, H. J. 1993, ApJ, 403, 530
Woźniak, P. R. et al. 2002 ApJ, 540, L65