Star Cluster Formation and Evolution in the Dwarf Starburst Galaxy NGC 1569
Abstract
We analyse multi-wavelength Hubble Space Telescope (HST) observations of a large number of star clusters in the nearby (post-) starburst dwarf galaxy NGC 1569. Their spectral energy distributions (SEDs) cover at least the wavelength range from U to I in equivalent HST filters, in most cases supplemented by near-infrared data. Using our most up-to-date evolutionary synthesis models of the Göttingen galev code we determine ages, metallicities, extinction values and masses for each individual cluster robustly and independently. We confirm the youth of most of these objects. The majority were formed in a very intense starburst starting around 25 Myr ago. While there are two prominent “super star clusters” present in this galaxy, with masses of , almost all remaining clusters are significantly less massive than an average Milky Way globular cluster, and are generally consistent with open cluster-type objects. We determine the cluster mass function from individual cluster masses derived by scaling the model SEDs of known mass to the observed cluster SEDs for each individual cluster. We find signs of a change in the cluster mass function as the burst proceeds, which we attribute to the special conditions of star cluster formation in this starburst dwarf galaxy environment.
keywords:
Hii regions – galaxies: evolution – galaxies: individual: NGC 1569 – galaxies: starburst – galaxies: star clusters1 Introduction
The dwarf starburst galaxy NGC 1569 (Arp 210, VII Zw 16, UGC 03056) has attracted attention for almost 30 years, starting with the observations by Hodge (1974) and de Vaucouleurs et al. (1974). Huge filamentary features are seen in the outskirts of the galaxy, like the so-called “H arm”, as well as bubbles and super-bubbles in all parts of the galaxy’s main body (e.g. Waller 1991, Heckman et al. 1995). This bubble structure has a complicated velocity structure (Tomita et al. 1994) and is accompanied by signs of galactic superwinds and outflows (Heckman et al. 1995, Della Ceca 1996), caused by the massive energy input from collective supernova (SN) explosions associated with the starburst. Whether the superwinds are strong enough to remove a significant amount of material from the gravitational potential of NGC 1569 is still being debated (this would predominantly remove the high-metallicity SN ejecta, see e.g. Della Ceca 1996, Martin et al. 2002). Signs of recent star formation are seen along the bubble walls, which is thought to be strong evidence for stochastic self-propagating star formation (e.g., Gerola & Seiden 1978, Seiden et al. 1984).
The properties of the two “super star clusters” (SSCs), usually called “A” and “B” (nomenclature from Arp & Sandage 1985), have been studied in great detail. First described by Arp & Sandage (1985), a significant effort was spent on characterising the properties of these clusters. Spectroscopic mass estimates () were derived by Ho & Filippenko (1996) and Gilbert & Graham (2001). Cluster “A” was resolved into a double cluster with different stellar content in each of the components (de Marchi et al. 1997, Buckalew et al. 2000 and Maoz et al. 2001, but see González Delgado et al. 1997 and Hunter et al. 2000 [“H00”]). To date the age estimates of various groups agree fairly well, suggesting an age of cluster “A” of around 7 Myr (with probably a small age difference between the two subclusters) and of around 1020 Myr for cluster “B” (H00, Origlia et al. 2001, Maoz et al. 2001).
However, our knowledge of the remaining clusters is very limited. Only H00 have investigated a larger sample of star clusters in NGC 1569, but concentrate their parameter studies on the SSCs. Hence only comparisons for photometric performance can be made for the other clusters. Only the age of cluster “no. 30” (age 30 Myr) is presented elsewhere (Origlia et al. 2001, nomenclature from H00).
This paper is part of an ongoing study, in which we will evaluate the impact of the environment on the star cluster populations of galaxies with ongoing or recent star cluster formation. While NGC 1569 is a gas-rich starburst dwarf galaxy (Israel 1988), other environments, such as interacting galaxies of various types and at various stages of interaction, will be studied with the same methods in a homogeneous way.
2 Observations and data preparation
The data were retrieved from the Hubble Space Telescope (HST) data archives, using the ESO/ST-ECF “ASTROVIRTEL” interface, and automatically calibrated using the standard OPUS pipeline (On-the-fly Reprocessing), using the most up-to-date calibration files available. A list of the retrieved WFPC2 and NICMOS data is provided in Table 1. The original observations were taken in January 1996, October 1998 and February 1998 for PID 6111, 6423 and 7881, respectively.
| Filter | Exposure time | Centrea | PIDb | ORIENTc |
|---|---|---|---|---|
| (sec) | (∘) | |||
| F336W | 2400 | PC | 6423 | 86.172 |
| F380W | 260 | PC | 6111 | 170.066 |
| 16600 | PC | 6111 | 170.066 | |
| F439W | 240 | PC | 6111 | 169.883 |
| 16700 | PC | 6111 | 169.883 | |
| F555W | 220 | PC | 6111 | 169.714 |
| 16500 | PC | 6111 | 169.714 | |
| 50, 2140 | PC | 6423 | 86.172 | |
| 2300 | PC | 6423 | 86.172 | |
| F814W | 50, 2100 | PC | 6423 | 86.172 |
| 300 | PC | 6423 | 86.172 | |
| F110W | 10511.95 | NIC2 | 7881 | 139.691 |
| F160W | 10511.95 | NIC2 | 7881 | 139.691 |
Notes: a – Location of the galactic centre; b – HST programme identifier; c – Orientation of the images (taken from the image header), measured North through East with respect to the V3 axis (i.e., the X=Y diagonal of the WF3 CCD ).
Since the retrieved images are from three different proposals, the centerings on the chip, and the orientations vary.
First, we divided the images into groups of the same passband/programme combination. The images were checked for saturation effects, and the groups were subdivided into subgroups with saturation and without saturation of the brightest sources.
The images of each subgroup were combined, using the imalign and crreject/cosmicrays tasks in iraf 111The Image Reduction and Analysis Facility (IRAF) is distributed by the National Optical Astronomy Observatories, which is operated by the Association of Universities for Research in Astronomy, Inc., under cooperative agreement with the (U.S.) National Science Foundation. stsdas, the Space Telescope Science Data Analysis System, contains tasks complementary to the existing iraf tasks. We used Version 2.3 (June 2001) for the data reduction performed in this paper.. The subgroups were then rotated, their pixel sizes matched, aligned and trimmed using the appropriate iraf routines.
The final fields-of-view (FoVs) are: 577 577 PC pixels (2654 2654) for the small FoV (which includes NICMOS coverage), and 777 787 PC pixels (3574 3620) for the larger FoV common only to the WFPC2 observations. These FoVs correspond to areas of 283 283 pc and 381 386 pc, respectively, at an adopted distance for NGC 1569 of 2.2 Mpc (see e.g. Israel 1988)
2.1 Source selection
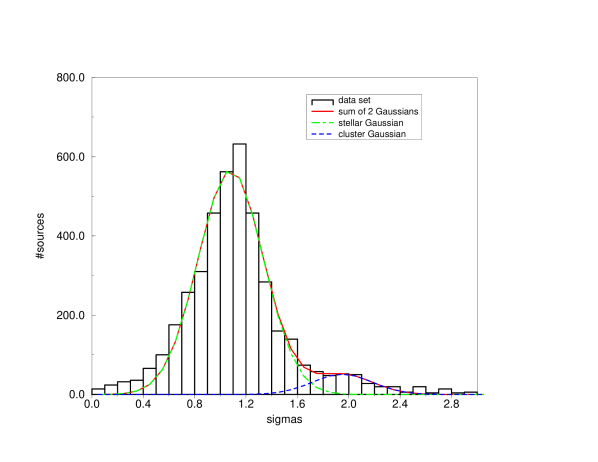
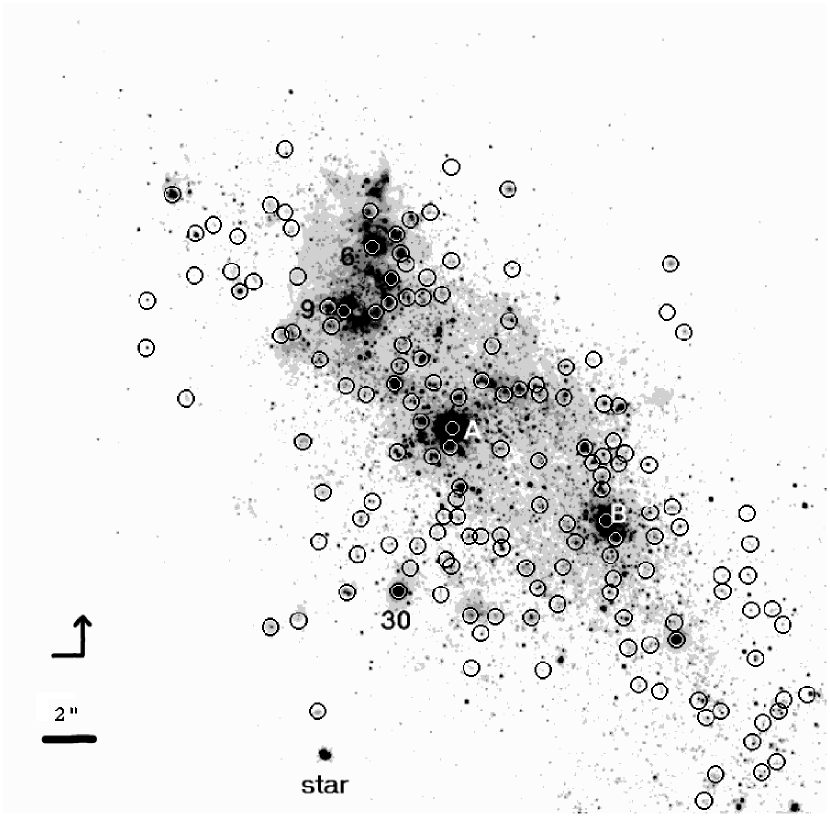
Objects were selected using a version of daofind (Stetson 1987), running under idl. Subsequently, the source sizes were estimated by fitting Gaussian profiles to the sources’ intensity distributions. “Point-like sources” may contain bright stars in NGC 1569 as well as foreground stars in the Galaxy. At least one obvious foreground star is visible in the lower right-hand corner of Fig. 2. Sources with 1.7 pixels (equivalent to 0.83 pc at the distance of NGC 1569) were rejected as being point-like sources. This limit was chosen after an analysis of the distribution of Gaussian ’s, shown in Fig. 1. A sum of two Gaussians was fitted to this distribution, one representing point-like sources and the other cluster-like (hence significantly extended) sources. The rejection limit at = 1.7 pixels was chosen conservatively to get a clean cluster sample. As pointed out by Whitmore et al. (1999) a broadening of the (intrinsic) point-spread function (PSF) might occur at deep exposures due to jitter and breathing effects. Additional broadening might be caused by crowding of star clusters, although this seems to be a minor issue in NGC 1569 where the star clusters are usually well separated (see Fig. 2), and during the alignment and combination of large numbers of single images. These effects are most likely responsible for the pronounced peak around 1.2 pixels, hence 0.4 pixel larger than the corresponding value for a pure WFPC2 PSF. This procedure also removes blends of bright stars and clusters from our sample, for which accurate cluster photometry would be impossible.
We believe that this method gives reliable results, since we are only interested in relative size estimates and we measure the sizes of the clusters in a homogeneous way.
An initial list of cluster candidates was created by cross-correlating the source lists from “saturated” F555W and F814W (comparable to V-band and I-band) images. Subsequently, additional bright sources from the other passbands were added.
Finally, all candidate clusters were examined visually. Spurious detections, remaining cosmic rays covering more than a single pixel and obvious remaining single bright stars or blends of single stars and clusters were rejected in this step.
The number of star clusters resulting from this procedure was 168 in the small FoV, and 179 in the larger FoV.
2.2 Photometric calibration
The coordinates from the source lists obtained in the previous section were used as the centres for aperture photometry, based on daophot routines adapted for idl, in all passbands. Standard apertures of 5 pixel source aperture and 58 pixel sky annuli were adopted, corresponding to 2.45 pc and 2.453.9 pc at the distance to NGC 1569 of 2.2 Mpc. Visual inspection allowed us to adjust these standard apertures where necessary (for almost half of the clusters, the apertures and sky annuli needed to be increased), to include a maximum fraction of the source flux and to avoid unrelated features in both the source aperture and the sky annulus. After performing the aperture photometry, magnitudes from saturated sources were replaced by the correct values from the unsaturated images.
The full data tables containing the integrated photometry and analysis results of all clusters are available, at http://alpha.uni-sw.gwdg.de/panders/data/NGC1569/.
Note that, in order to determine model magnitudes from our model spectra (see Sect. 3.1), we adopt the full filter response functions, including the red leak in F336W. Therefore, we need not attempt to correct for the red leak of the F336W filter. In general, the impact of the red leak is negligible for spectra dominated by early-type stars such as a starburst spectrum (e.g. Eskridge et al. 2003, de Grijs et al. 2003a). In addition, any ambiguity originating from the red leak is resolved by our spectral energy distribution (SED) analysis tool, which takes into account the whole SED.
From the 47 clusters of H00, only 17 are matched in our source list. Roughly a dozen of the H00 clusters lie outside of our final FoVs from the combined HST data, and hence are not included in this work. Another 9 H00 clusters are in the close vicinities of larger clusters, and are therefore rejected by our selection criteria; the sizes of most of these clusters, as estimated by H00, are close to our lower size limit of 1.7 pixel. In addition, the source selection criteria are not described in detail by H00, and hence comparison is difficult or impossible. By comparing the photometry of the clusters in common, after correction for the different distance moduli and extinction values considered, we find the H00 values to be brighter, in general, than ours, which can be attributed to different apertures used for the photometry (mostly larger in the case of H00), see Fig. 3. H00 attempted to extract the contribution of nebular emission from their science images, in particular of H emission, using appropriate narrow-band filters to estimate the approximate H line intensity and its continuum level. However, further details are not given in their paper. This makes comparison difficult, but since we account for nebular emission in our models the parameter analysis is not affected. The error bars in Fig. 3 are calculated from the photometric errors in H00 and from our work. In general, the median photometric errors for our clusters are of the order of 0.05 mag except for the F336W filter where they are around 0.1 mag. The photometric errors considered in this paper include Poissonian noise in the background and in the source flux itself, and variations in the background level.
Only in a few cases the correlation of brighter clusters with larger source annuli in the H00 sample does not hold. The SSCs are surrounded by smaller substructures and superimposed on generally high background levels, where reliable aperture photometry is difficult, in terms of both source and background fluxes. In such cases, the results are very sensitive to the exact positions and sizes of the source and background annuli.
We will now discuss the few true “outliers” in Fig. 3 in more detail. H00 cluster “no. 9” lies close to another bright source (probably a bright star), hence contamination of the source flux of the cluster by the other source is likely.
Cluster “no. 6” is located in a region with very strong gas emission (and is a strong emitter itself because of its young age; we determine an age of 4 Myr), according to the false-colour image including H emission of H00 (their Fig. 2). This gas emission might lead to misassignment of flux to either the source or the background flux.
These differences in the integrated cluster photometry between the H00 values and ours reflect the advantages of a visual inspection of each cluster in the complicated environments associated with ongoing starbursts, compared to automated cluster photometry. Non-cluster features, such as crowding or extended gas emission, are taken into account more reliably.
In Anders et al. (2003) we show that SEDs of young clusters exhibit a “hook” near the B band (see also Fig. 6). Tracing this hook is of the highest importance for the determination of accurate cluster parameters. The deep observations in F380W and the additional F336W observations are vital for tracing this hook. In addition, having near-infrared (NIR) data available further improves the analysis. For the majority of our clusters we have NIR data at hand. Hence, the observations available to us for NGC 1569 are ideally suited to produce accurate cluster parameters.

2.3 Sample completeness
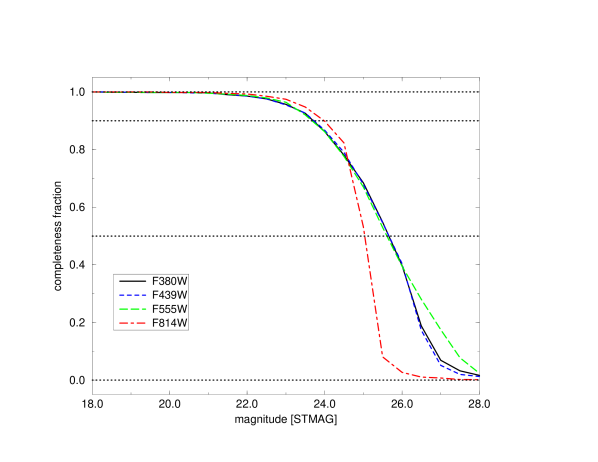
The completeness of the exposures was determined by adding artificial sources of known brightness to the saturated science images, and subsequent source identification. This analysis was performed using the appropriate iraf and idl tasks in a similar way as for the source selection of the real clusters. By cross-correlating the list of retrieved objects with the input artificial sources, the fraction of recovered artificial sources was determined. The results for the small FoV are shown in Fig. 4. The completeness limits for the large FoV are similar.
These completeness curves were corrected for the effects of blending or superposition of multiple randomly placed artificial PSFs as well as for the superposition of artificial PSFs on top of genuine objects. For the analysis in this paper, completeness limits at 90 per cent will be considered.
3 Parameters of the young clusters
3.1 Cluster analysis algorithm
We applied our maximum-likelihood algorithm to the magnitudes of the cluster candidates found in Section 2.2. This algorithm and several tests of it are described in Anders et al. (2003). Only a summary of the method is given here.
We use the evolutionary synthesis models of our galev code, described in detail in Schulz et al. (2002), with important additions regarding the treatment of gaseous emission in the early stages of cluster evolution presented in Anders & Fritze – v. Alvensleben (2003). We also calculate model magnitudes with internal dust extinction, by adopting the starburst extinction law of Calzetti et al. (2000), assuming a foreground screen geometry. Our extinction estimates are therefore, strictly speaking, lower limits. Galactic extinction is taken into account by dereddening the observations using the appropriate Galactic extinction values from Schlegel et al. (1998).
Our models are based on stellar isochrones from the Padova group which include the thermally-pulsing AGB-phase shown to be vital to correctly predict the colours of clusters with ages between 200 Myr and 1 Gyr (see Schulz et al. 2002). Throughout the paper we adopt a Salpeter initial mass function (IMF) with lower mass limit = 0.15 and upper mass limit 50-70 , determined by the upper mass limit of the Padova isochrones ( = 50 for the highest metallicity Z=0.05, 70 for the lower metallicities). Adopting a different IMF, however, affects the derived (absolute) masses of the clusters, but the effect on the other parameters, and on the relative mass distribution, is negligible. The mass offset by assuming a different IMF can easily be derived analytically. The spectral library used is given in Lejeune et al. (1997, 1998). The emission line coefficients for low metallicities are taken from Izotov et al. (1994, 1997, 1998), and from Stasińska (1984) for metallicities 0.008. The Lyman-continuum photon output was calculated by Schaerer & de Koter (1997), and recently confirmed by Smith et al. (2002), see Anders & Fritze - v. Alvensleben (2003) for details.
Our models assume a well-populated IMF, which is an over-simplified assumption for systems with small numbers of bright stars, as shown e.g. by Cerviño et al. (2002) and Cerviño & Valls-Gabaud (2003). Small-number statistics and stochastic effects for bright stars, such as Wolf-Rayet stars or supergiants, introduce additional model magnitude dispersions, which scale inversely with the mass of the cluster. However, no complete study for all magnitudes and input parameters has yet been performed.
We construct SEDs from these models with an age resolution of 4 Myr for ages from 4 Myr up to 2.36 Gyr, and with 20 Myr resolution for older ages (up to a maximum age of 14 Gyr). The extinction resolution is E(BV) = 0.05 mag, for E(BV) in the range of 0.01.0 mag. The adopted metallicities are [Fe/H]=1.7, 0.7, 0.4, 0.0, 0.4, as given by the Padova isochrones used (for a general description of the stellar models see Bertelli et al. 1994 and Girardi et al. 2000; for details about the isochrones in our models see Schulz et al. 2002).
When comparing our model SEDs with the observed SEDs we first determine the mass of the cluster by shifting the model SED onto the observed SED. This shift is equivalent to scaling the model’s mass to the cluster mass.
Each of the models is now assigned a certain probability to be the most appropriate one, determined by a likelihood estimator of the form , where . Clusters with unusually large “best” are rejected, since this is an indication of calibration errors, features not included in the models (such as Wolf-Rayet star dominated spectra, objects younger than 4 Myr etc.) or problems due to the limited parameter resolutions. The lower cut-off is set to a total probability = , corresponding to a . The total probability per cluster is then normalised.
Subsequently, the model with the highest probability is chosen as the “best-fitting model”. Models with decreasing probabilities are summed up until reaching 68.26 per cent total probability (= 1 confidence interval) to estimate the uncertainties of the best-fitting model. These uncertainties are in fact upper limits, since their determination does not take into account effects like the existence of several “solution islands” for one cluster (such as e.g. the age-metallicity degeneracy, see Section 3.2.3), and discretisation in parameter space.
Several passband combinations (containing at least 4 passbands) were used for the analysis, to minimise the impact of statistical effects on the errors and calibration errors. A minimum of 4 passbands is required to determine the 4 free parameters age, metallicity, extinction and mass independently (see also Anders et al. 2003, de Grijs et al. 2003a). We caution that these passband combinations must not be biased to contain mainly short-wavelength filters or mainly long-wavelength filters. Coverage of the entire optical wavelength range, if possible with the addition of ultra-violet (UV) and NIR data, is most preferable (de Grijs et al. 2003a). We select the passband combinations starting with all available filters, and then rejecting passbands starting with the shallowest exposures and exposures not covering the entire combined FoV.
Only clusters with observational errors 0.2 mag in all passbands of a particular combination were included to minimise the uncertainties in the results. For each combination, the best-fitting models and the associated parameter uncertainties were determined. For a certain cluster all best-fitting models (and the associated uncertainties), originating from the different passband combinations, were compared. For each of these best-fitting models the product of the relative uncertainties () was calculated (the superscripts indicate the upper limits (+) and the lower limits (-), respectively) The relative uncertainty of the extinction was not taken into account, since the lower extinction limit is often zero. For each cluster, the data set with the lowest value of this product was adopted as the most representative set of parameters (and parameter uncertainties). In cases where the analysis converged to a single model, a generic uncertainty of 30 per cent was assumed for all parameters in linear space, corresponding to an uncertainty of dex in logarithmic parameter space. See also de Grijs et al. (2003a,b) for an application of this algorithm to NGC 3310 and NGC 6745, and Anders et al. (2003) for a theoretical analysis of its reliability.
The figures presented in this paper are based on the overall best values.
3.2 Parameter distributions
In total, we identified and analysed 144 clusters in the small FoV, and 157 clusters in the large FoV. All of these clusters meet the minimum error criterion in at least one passband combination, while 24/22 additional clusters (small FoV/large FoV) were rejected by this criterion. Every accepted cluster was matched with representative single stellar population models by our algorithm.
We mainly used 3 passband combinations for the analysis: all 7 passbands (“7mag”), the combination of F380W, F439W, F555W, F814W, and F160W (“UBVIH”) and the most restricted combination of F380W, F439W, F555W, and F814W (“UBVI”). In the small FoV we managed to match 62 clusters using 7mag; 24 additional clusters were matched using UBVIH (since either their F336W or their F110W magnitudes had errors larger than 0.2 mag). The remaining 58 clusters in the final sample for the small FoV could only be analysed without NIR information. These latter clusters are mostly concentrated towards the corners of this FoV, where due to the rotation applied to the NICMOS images there is no NIR information available. To summarise, if NIR information is available, passband combinations including the NIR filter NICMOS F160W give the best results in almost all cases, based on their relative uncertainty product.
For the small FoV we checked the uncertainties inherent to the analysis routine. We find median uncertainties of 1 step in metallicity (as a reminder, the metallicities used are [Fe/H]=1.7, 0.7, 0.4, 0.0, 0.4), 0.1 mag in extinction E(B-V), a factor of 3 in age (corresponding to a logarithmic uncertainty of 0.5), and a mass uncertainty of a factor of 2.3 (corresponding to a logarithmic uncertainty of 0.35). This is in good agreement with theoretical tests of our algorithm (see Anders et al. 2003 for more details). We have chosen the bin sizes in the following figures based on these uncertainty estimates.
3.2.1 Parameter distributions of the entire sample in the small FoV
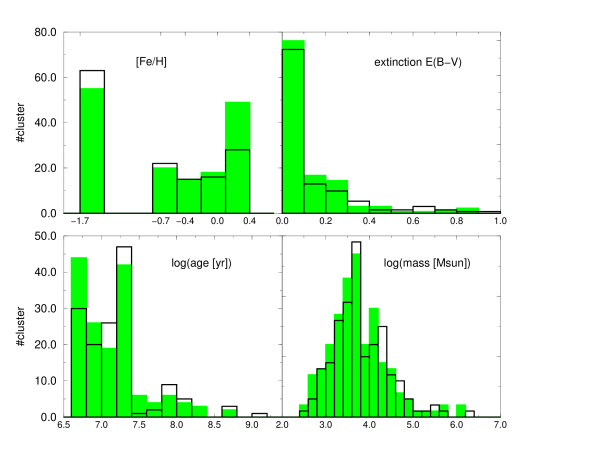
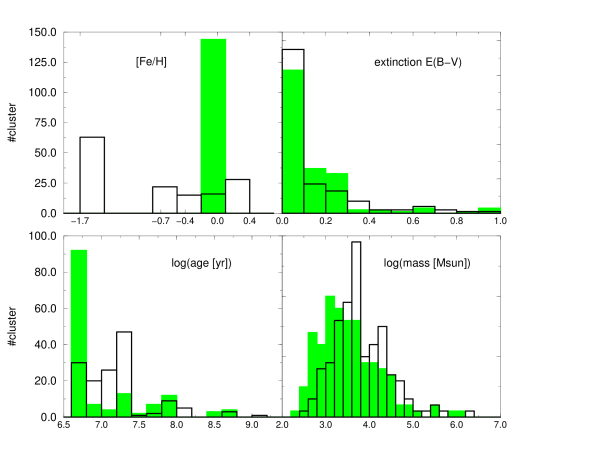
In Fig. 5 the derived parameter distributions of the clusters in the small FoV are shown (open histograms).
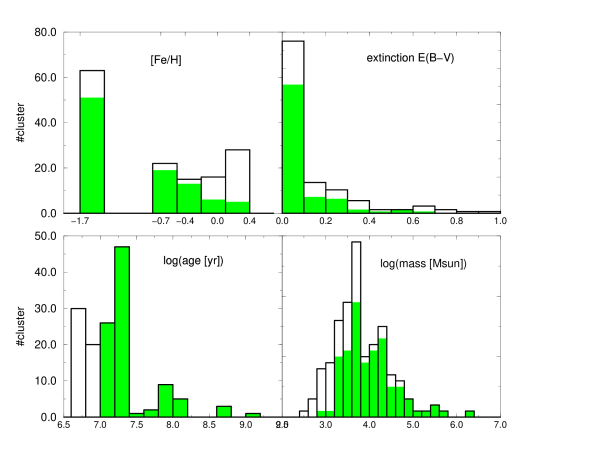

The metallicity distribution (Fig. 5, [Fe/H]) is dominated by significantly subsolar-abundance clusters. The high-metallicity part is dominated by the youngest clusters (ages 8 Myr), as can be seen from a comparison with the shaded histograms. We attribute this to the age-metallicity degeneracy. To further quantify the associated effects we analysed the fractions of clusters without NIR data (and hence less reliable parameters, especially the metallicity is fixed most effectively using NIR data) in certain age and metallicity bins. We found the youngest ages (at 4 Myr 63 per cent, at 8 Myr 50 per cent) and the highest metallicities (for Z=0.02=Z⊙ 56 per cent, for Z=0.05 68 per cent) to be dominated by clusters for which no NIR photometry with uncertainties 0.2 mag was available. In the other bins, the average fraction of clusters without NIR data is around 30 per cent.
Almost all clusters were produced in the last 25 Myr in a very intense burst. Only 21 clusters (15 per cent) are older. This is consistent with the existing evidence regarding the ages of the SSCs, and the dynamical age of certain morphological features like arcs and superbubbles (de Vaucouleurs et al. 1974, Waller 1991, Tomita et al. 1994, Heckman et al. 1995). While these morphological features are thought to be evidence for self-propagating star-formation, our age determination does not provide further proof of this scenario, since no spatial concentration of clusters at any given age is observed.
In Figure 6 we present a number of model SEDs for the low-metallicity environment of NGC 1569 and the young ages typical for its star clusters. With typical observational errors of 0.05-0.1 mag these SEDs are clearly distinguishable. The UV range is crucial for this distinction, in agreement with our theoretical analysis in Anders et al. (2003). The deep observations of NGC 1569 in the F380W filter (approximately equivalent to the U band) are vital for the accuracy of our results.
Colour-magnitude diagram analyses yield more extended starburst histories for NGC 1569 starting up to 150 Myr ago, and ending around 510 Myr ago, with ongoing low-level star formation for the last 1.5 Gyr (Vallenari et al. 1996, Greggio et al. 1998, Aloisi et al. 2001). Since such extended burst scenarios are not supported by our determinations of the cluster ages, we rather associate this with the low-level star cluster formation for clusters with log(age) 7.4 and the secondary peak of star cluster formation at around 100 Myr ago.
The extinction towards the NGC 1569 clusters is low: 73 per cent of the clusters have E(BV) 0.1. Only 10 clusters (7 per cent) have E(BV) 0.5, and all of these are young (ages 16 Myr, with most of them as young as 4 Myr).
The masses of the cluster candidates are low compared to Galactic globular clusters, which have a Gaussian shaped mass distribution with and (Ashman et al. 1995). In the case of the star cluster sample in NGC 1569 we are likely observing a system of open cluster-type objects rather than globular cluster progenitors. Only 4 objects have masses in excess of log(mass [])=5.47.
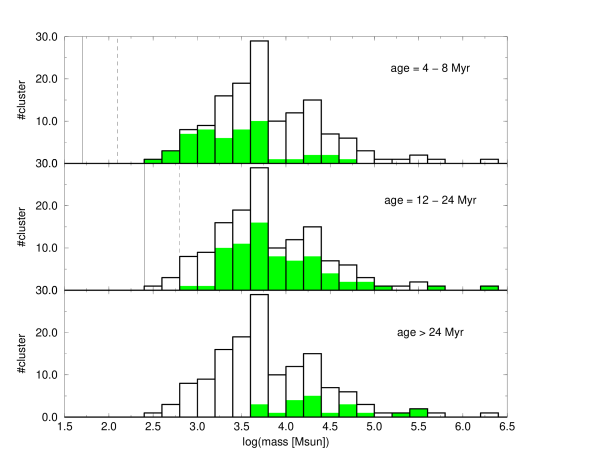
An even more remarkable result is shown in Fig. 7. There is significant evidence that the clusters formed at the onset of the burst are, on average, more massive than the clusters formed more recently. The vertical solid lines in the top two panels indicate the completeness limits for ages of 4 Myr and 24 Myr, respectively. The dashed lines indicate completeness if one assumes an additional drop in completeness of a yet another 1.0 mag due to the visual examination, because of a possible bias to reject preferentially fainter clusters. We would require an additional drop of 1 mag to explain the decrease at log(mass) 3.2 in the second age bin’s shaded histogram. Alternatively, this drop might be caused by disruption of the lowest-mass clusters on time-scales as short as 25 Myr.
To investigate the significance of this change in mass function we display, in Fig. 8, a subset of clusters with age estimates that are entirely within the respective age bins. The right-hand panels show the most extreme configuration allowed by the 1 uncertainties of our mass estimates, where we assume that all clusters in the younger age bin have masses at the upper limit of the 1 mass uncertainty, and all clusters in the older age bin have masses at the lower limit of the 1 mass uncertainty range. An excess of clusters with log(mass) 3.8 is still clearly visible. Quantitatively, this excess is significant at roughly the 10 level and cannot be explained even by worst-case Poisson-noise scenarios.
While the behaviour at the low-mass end remains debatable due to incompleteness effects, the excess of clusters with log(mass) 3.8 in the intermediate age bin is significant. We will discuss a number of possible explanations for this excess in Section 5.

3.2.2 The “well-known” clusters
Since most information in the literature is available for the clusters “A”, “B” and “no. 30”, we compare our determinations for these clusters to those found in the literature in Table 2. The masses are taken from Ho & Filippenko (1996) (“HF96”) and Gilbert & Graham (2001) (“GG01”). The ages are from H00 and Origlia et al. (2001).
The ages of the two SSCs determined in this work agree very well with those from the literature. The agreement is not as good for cluster “no. 30” (our determination indicates a significantly older age than the literature value), but since no uncertainties are given in the literature, a direct comparison is difficult. However, since cluster “no. 30” is located at some distance from the bar of the galaxy, where the vast majority of star clusters is concentrated, a formation earlier than the major burst is not unlikely.
We determine higher masses than inferred from kinematic studies. Three reasons are possible:
-
1.
We systematically determine ages that are too old, and due to the rapid changes in the mass-to-light (M/L) ratio at these early stages the resulting masses are too high. This scenario is not supported by our age uncertainties.
-
2.
We adopted an incorrect stellar IMF. If the low-mass slope of the IMF is shallower than Salpeter (see e.g. Kroupa et al. 1993), our mass estimates need to be reduced by a factor of roughly 2 (see de Grijs et al. 2003b).
-
3.
The masses calculated from the measured velocity dispersions are underestimated.
The kinematic masses of GG01 are about a factor of 2 smaller than ours, which is most likely within the uncertainties inherent to both methods (e.g. including the uncertainty in the IMF, evolutionary synthesis uncertainties, parameter uncertainties originating from the observation-model comparison, and uncertainties in the kinematic masses). A mass of was derived by HF96 for SSC A. However, they did not take into account the substructure of this cluster, nor its impact on the velocity dispersion. They also assumed a different distance modulus, and a fixed sigma to correct for the impact of red supergiants, rather than measuring it from the autocorrelation function, as done by GG01 (although HF96 claim to give a lower mass limit only). Nevertheless, both studies assume complete virialisation of the clusters, which is likely not the case for clusters as massive and as young as these two SSCs (hence the dynamical mass estimate is likely an underestimate). A cluster’s half-mass relaxation time is given by , with the number of stars in the cluster, its radius in pc and the median mass of a star in the cluster. The radii are taken from de Marchi et al. (1997): 1.6 pc for SSC A1, 1.8 pc for SSC A2/B. We assume that the half-light radius approximates the half-mass radius for young clusters (cf. de Grijs et al. 2002a), a median mass of a star in the cluster is 0.3 M⊙ (for a well-populated IMF ranging from 0.15 to 70 [upper mass limit given by Padova isochrones for low metallicity]), masses are adopted from GG01 ( for A1, for A2 and for B), numbers of stars in the clusters are calculated from the total cluster mass and the characteristic stellar mass. These values result in half-mass relaxation times of 250-400 Myr, well in excess of the expected ages of these clusters by more than a factor of 20. However, this relaxation model does not account for effects of mass segregation (for observational evidence of significant ab initio mass segregation in a sample of young LMC clusters see de Grijs et al. 2002b), or radial dependences of the relaxation time-scales. Hence uncertainties are large. Our data do not allow to discriminate between these sources of uncertainties.
The best-fitting metallicity for NGC 1569 derived from CMD analyses is (Greggio 1998, Aloisi 2001, both using Padova tracks). This agrees well with spectroscopic abundance measurements by Kobulnicky & Skillman (1997) and Devost et al. (1997). Both teams measure abundances of around 12 + [O/H] = 8.2, corresponding to [Fe/H] = 0.7. We find both SSC B and no. 30 best matched by models with [Fe/H] = 0.4, and hence comparable to the literature values cited within the uncertainties associated with the methods. SSC A is best matched by a model with the lowest metallicity available ([Fe/H] = 1.7). This might reflect the uncertain character of this star cluster, which may consist of two subclusters (de Marchi 1997), but certainly contains two very distinct populations (González Delgado et al. 1997, de Marchi et al. 1997, H00, Maoz 2001): Wolf-Rayet stars and red supergiants. Hence a simple single stellar population model is probably not appropriate for this cluster. In addition, Wolf-Rayet stars are not specifically marked in the Padova isochrones, and the treatment of red supergiants by the Padova group differs from that of e.g. the Geneva group. The treatment of these stars is not yet beyond debate.
| cluster | Average | Uncertainties | Best values | Uncertainties |
|---|---|---|---|---|
| Literature | Literature | This work | This work | |
| age [Myr] | ||||
| SSC Aa | 7 | 420 | 12 | 816 |
| SSC B | 15 | 1030 | 12 | 1228 |
| No. 30 | 30 | 92 | 28112 | |
| cluster | HF96 | GG01 | Best values | Uncertainties |
| This work | This work | |||
| mass | ||||
| SSC Aa | ||||
| SSC B | ||||
| No. 30 |
Notes: a Analysis in this work converged to 1 model only; 30 per cent uncertainties are assumed. b Sum of both subcomponents.
3.2.3 Comparison with other subsamples and the age-metallicity degeneracy
Figure 9 compares the parameter distributions of clusters in the small FoV with the ones from the large FoV. The major difference between these two FoVs is not just the spatial coverage, but – more importantly – for all clusters in the large FoV the NIR information is either unavailable or omitted.
While the extinction and log(mass) distributions are fairly similar, the metallicity and age distributions show a significant shift. The clusters in the large FoV seem to have, on average, higher metallicity and younger ages. While these parameters are expected to correlate, a closer inspection of the data reveals a different situation. Comparing the same clusters in both the small and the large FoVs shows that of the clusters classified as having super-solar metallicity in the large FoV only 48 per cent are classified as solar/super-solar in the small FoV. Instead, some 33 per cent of them were originally classified as having the lowest possible metallicity [Fe/H] = 1.7. In addition, of the 28 clusters in the small FoV’s super-solar metallicity bin, 19 (68 per cent) have no NIR information available (due to the rotated NICMOS FoV). Single stellar population models run close (and partly intersect each other) in colour evolution for different metallicities at early phases. As widespread super-solar abundances seem fairly implausible in this kind of dwarf galaxy, we strongly suspect these results to be a clear sign of the age-metallicity degeneracy. This degeneracy can only be broken by using NIR observations, in addition to UV-optical data, in particular to constrain the metallicity of the clusters properly. From this comparison we strongly recommend the use of NIR facilities for multi-band photometry to determine reliable cluster parameters from broad-band photometry, at least for clusters as young as in our sample.
3.2.4 Investigating certain metallicity range restrictions
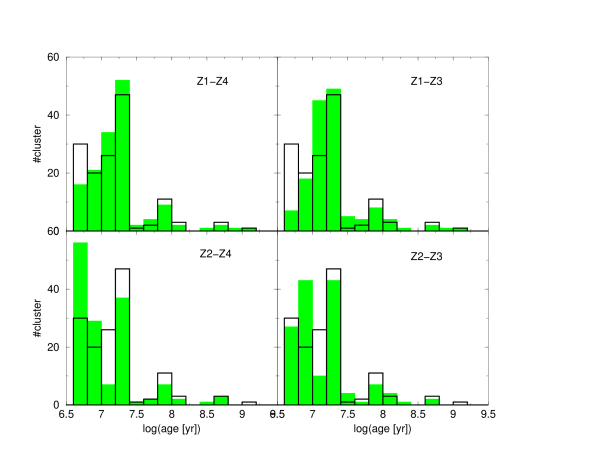
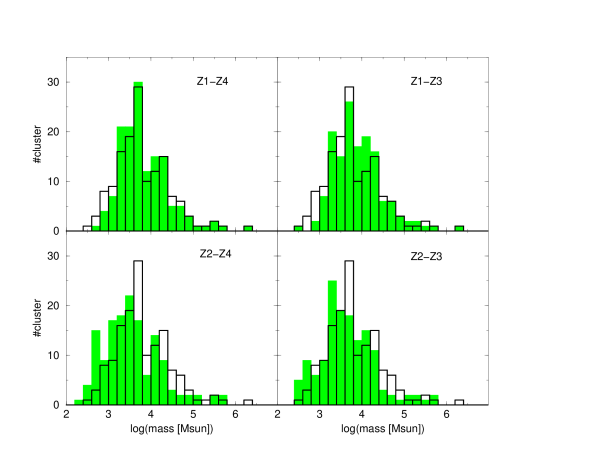
To evaluate the robustness of our determinations, we performed cluster analysis with restricted metallicity ranges. The results for the log(age) and log(mass) distributions are shown in Fig. 10. While the rejection of the super-solar/solar metallicity range is justified physically (since large numbers of high-abundance clusters are not expected in a dwarf galaxy environment, such as in NGC 1569), the rejection of the lowest metallicity is a more theoretical exercise (since subsolar metallicity ranges cannot be omitted a priori).
These tests confirm the general properties obtained without restrictions in metallicity space, proving the robustness of our analysis method. The extinction (not shown) and log(mass) distributions are very similar, with only minor changes. The log(age) distributions confirm the onset of the major burst 24 Myr ago, and a minor burst around 100 Myr ago. The detailed structure of the major burst, however, depends on the metallicities allowed. Rejection of high metallicities leads to a depopulation of the youngest age bins. This is related to the study of the impact of the availability of NIR data on the derived parameters (Section 3.2.1). Rejection of the lowest metallicity leads to a distribution skewed to younger ages, to balance the mean higher metallicity.
The importance of robust, independent metallicity determinations can also be seen from Fig. 11, which shows the parameter distributions for the clusters in the small FoV, assuming solar metallicity (shaded histograms). The open histograms are the distributions from the same sample without such restrictions, for comparison. Major changes are visible in the log(age) (a clear shift towards younger ages for the metallicity-restricted values) and log(mass) distributions (towards lower masses, which is a consequence of the younger ages, in conjunction with the associated rapidly changing M/L ratios).
To summarise, we have analysed a large sample of star clusters in NGC 1569 by comparing the observed cluster SEDs with an extensive grid of model SEDs to determine the cluster ages, metallicities, internal extinction values and masses in a robust and homogeneous way. We have presented the best-fitting values for the clusters, and compared them to the results with restricted parameter spaces or wavelength coverage. We conclude that we can determine ages (and hence the star cluster formation history; bursty, with a major peak starting 25 Myr ago, and a minor peak around 100 Myr ago), masses (similar to open cluster-type objects), extinction values (the average internal extinction is found to be low) and metallicities (significantly sub-solar; however, the impact of the age-metallicity degeneracy is clearly seen, especially for clusters without NIR data) robustly, with well-understood uncertainties.
4 Cluster disruption vs. fading
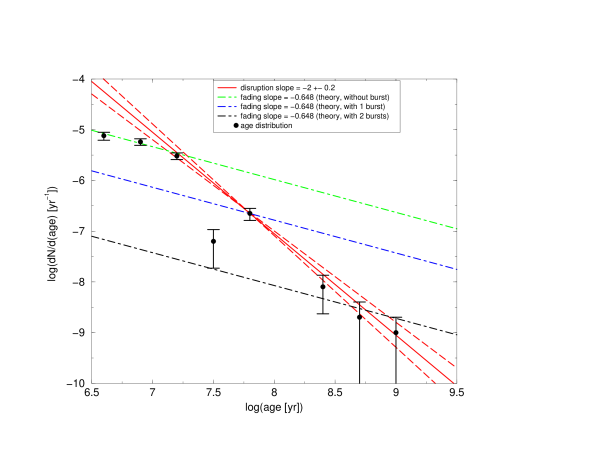
We applied the method of Boutloukos & Lamers (2003) regarding cluster detectability limited by fading due to stellar evolution and cluster disruption to our cluster sample from the small FoV. The results are shown in Figs. 12 and 13. Since the total number of clusters is small, statistics are relatively poor, but consistent.
Figure 12 shows the number of clusters formed per year, as a function of log(age). The fading lines are based on the slope given by Boutloukos & Lamers (2003) for the V-band (slope = 0.648) and are shifted vertically to best match the data. The disruption line is a fit to the data points with log(age) 7.2 (with slope = 2 0.2).
Since the Boutloukos & Lamers (2003) method is based on the assumption of a constant cluster formation rate, which is not valid in our case, the interpretation of this figure is ambiguous:
-
1.
As a fading part (short-dashed line, for log(age) 7.2) and a disruption part (solid line), without any burst (which is unrealistic, compared to Fig. 5).
-
2.
With enhanced cluster formation in the recent past, which is only affected by fading (upper dot-dashed line) and offset from the low-level cluster formation fading line (middle dot-dashed line, for log(age) 7.5), with subsequent cluster disruption (solid line).
-
3.
With fading only, but with 2 bursts (upper dot-dashed line [log(age) 7.2] and middle dot-dashed line [log(age) 7.8]) and low-level cluster formation (lower dot-dashed line).
We treat the burst as a temporarily constant cluster formation rate (Boutloukos & Lamers 2003; de Grijs, Bastian & Lamers 2003), shifting the theoretical fading lines to fit our data in the respective age intervals.
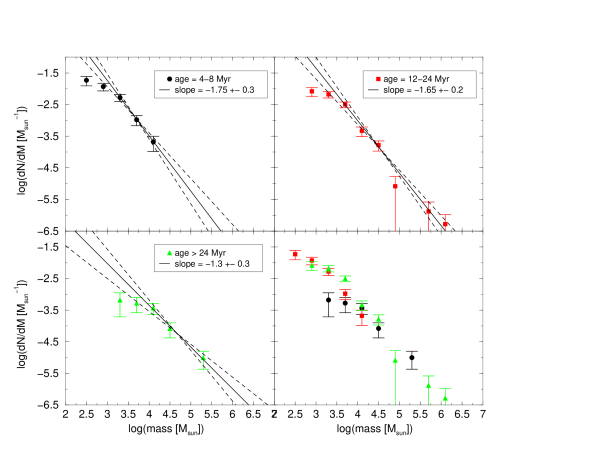
Figure 13 shows the number of clusters formed per for 3 age bins. Due to small-number statistics the slope determinations are fairly uncertain, but comparable. The average slope, however, is shallower than expected (we find 1.6, other studies find slopes around 2, see de Grijs et al. 2003b for a comparative compilation), but this might again be caused by the small-number statistics. Since the slopes for all age bins are comparable, we conclude that cluster disruption cannot yet have played a significant role, not even for the oldest clusters, which seems plausible in a low-density environment such as in NGC 1569. The lowest masses in each bin are clearly affected by incompleteness effects. The errors included in Fig. 13 are derived from Poissonian statistics in the respective mass bins.
5 The physical requirements for star cluster formation
In Section 3.2.1 we observed a change in the mass function towards lower masses as the burst of star cluster formation proceeded. We performed a number of tests, to check whether this result (as shown in Fig. 7) is physically true or whether it might be only due to small-number statistics. First we counted the clusters in the mass bins log(mass)=3.23.8 and log(mass)3.8, subdivided into the age bins age=48 Myr and age=1224 Myr (as a reminder, we only have an age resolution of 4 Myr). We find 24 clusters in the younger+less massive bin, 7 clusters in the younger+more massive bin, 37 clusters in the older+less massive bin, and 34 clusters in the older+more massive bin. If we assume the younger bins to be correct, we can estimate from the older+more massive bin what we expect for the older+less massive bin: we would expect 117 clusters to be in the older+less massive bin, which is roughly 13 away from the observed value, if one assumes purely Poissonian statistics. Secondly, we performed a KS-test to estimate the probability that the mass functions in both age bins are drawn from the same distribution. We find a probability of only 10 per cent if we adopt a lower mass cut-off at log(mass)=3.2 (to account for completeness effects), and a probability of only 14 per cent if we adopt a lower mass cut-off at log(mass)=3.5 (further reducing the completeness limit), hence both distributions are significantly different. Both tests show the significance of our results. There are several possible reasons for this change in the mass function with time.
One reason might be a relation between cluster masses and the available gas reservoir and the possible exhaustion of the gas reservoir by the first generation of star clusters in the burst, leaving only a small amount of gas available for the star clusters formed more recently. While this seems plausible, there is still a large amount of gas available. Israel (1988) estimated the amount of gas left in the galaxy to be mass(Hi) = and mass(H2) = , while the total mass of the galaxy is estimated to be mass(total) = . Hence NGC 1569 is not gas-poor. It might still be a matter of the distribution of gas, and of the gas density. Taylor et al. (1999) studied the distribution of CO (and hence H2) in the centre of NGC 1569. They concluded that while there is a sufficient amount of H2 (mass(H2) ), this mass is distributed over an area 200 pc across, and hence not dense enough to form new clusters. The observed giant molecular clouds (GMCs), on the other hand, are not massive enough to form new SSCs assuming any reasonable overall star formation efficiency. It is noteworthy that the observed GMCs are not in the vicinity of the SSCs, but close to observed Hii regions, and hence near the most actively star-forming regions. The Hi maps of Stil & Israel (2002) also indicate a depression of (neutral) gas near the SSCs (see also Greve et al. 2002), and a clumpy higher-density ridge (with intensity peaks East and West of the SSCs, 15″away from the SSCs, and thus just outside our FoV) along the galaxy’s major axis, together with extended diffuse emission. The total amount of Hi gas is estimated to be , but spread across a large area.
As suggested by the observations of Stil & Israel (1998), the starburst in NGC 1569 might be triggered by the passage of a nearby Hi cloud (projected distance 5 kpc) with mass = . There seems to be an Hi ridge connecting NGC 1569 to this companion (Stil & Israel 1998, their fig. 3), supporting a scenario in which the Hi cloud passed close to NGC 1569 in the recent past, on time-scales equivalent to the burst duration, i.e. of the order of few tens of Myr. The ram pressure compression of the interstellar medium (ISM) during the approach of the companion, and the absence of this compression during the time after perigalacticum, is another possible explanation for the change in the mass functions with time. This explanation is supported by observational (e.g. de Grijs et al. 2001, 2003b) and theoretical evidence (Ashman & Zepf 2001, Elmegreen 2002) of enhanced average star cluster masses and star formation efficiencies caused by interaction-induced ram pressure.
A final possible, and in our opinion most likely, origin might be the strong radiation field caused by the large number of newly formed massive stars in the beginning of the burst and the follow-up energy input into the ISM by SNe. Waller (1991) and Origlia et al. (1998) estimate the number of SNe during the burst to be of order 200025,000 SNe/Myr. This might not only cause an unusually high dust temperature (34 K; e.g. Hunter et al. 1989, Lisenfeld et al. 2002) and the powering of the galaxy’s strong thermal X-ray halo and bipolar outflow (Heckman et al. 1995, Della Ceca et al. 1996, Martin et al. 2002), but it might also prevent the assembly of larger molecular clouds due to heating of the ISM and pressure by UV photons and SN ejecta, since the collapse time-scale of a Jeans-instable cloud increases with its mass. Observed GMCs are likely to have collapsed while shock fronts, caused by the outflow of material, passed through high-density warm material (shock-cooling, see Taylor et al. 1999), and therefore driven by conditions not available in all regions of the galaxy.
6 Summary
We interpret multi-colour HST data of star clusters in the dwarf (post-)starburst galaxy NGC 1569 with dedicated evolutionary synthesis models and a robust analysis method to determine ages, metallicities, internal extinction values and masses of individual clusters independently. We conclude that we are observing a mainly young, recently formed, perhaps partially still forming, star cluster system, which mainly consists of objects considerably less massive than average globular clusters in the Milky Way. The extinction within NGC 1569 towards the clusters is found to be low, the metallicity distribution wide-spread, which is thought to be at least partially due to the age-metallicity degeneracy. These results are consistent with previous studies, but enlarge the sample of star clusters analysed in NGC 1569 by a factor of 4.
We confirm the bursty character of star cluster formation in NGC 1569, with a major burst starting some 25 Myr ago, possibly triggered by a passing Hi cloud, and approximately continuous, low-level star cluster formation at earlier times. We detect a significant lack of high-mass clusters formed at the end of the burst, compared to clusters formed earlier in the burst. While the reason for this is still unclear, we consider three possibilities (or any interplay of them):
-
1.
the absence of a sufficient amount of gas, or gas density, to form new (massive) star clusters;
-
2.
the ram pressure caused by the companion Hi cloud is apparent predominantly during the companion’s approach, and not during its recession;
-
3.
the heating of the ISM due to a strong radiation field and SN ejecta originating from the clusters formed in the beginning of the burst, preventing the assembly of massive molecular clouds by photo-ionisation and turbulence.
We believe all three scenarios to be of relevance, but attribute the highest importance to the latter one.
From a technical point of view we conclude that:
-
1.
The commonly used procedure to assume a generic metallicity (and extinction) for all clusters is dangerous, since this affects the resulting age (and mass) distributions significantly.
-
2.
With only optical passbands available the age-metallicity degeneracy largely precludes the determination of reliable ages and masses. While it is partially possible to correct for this, it introduces additional uncertainties. A more reliable way is by using additional NIR observations.
In the near future we will apply our methods to different star-forming environments, such as interacting galaxies of various types and in various stages of interaction. This will improve our understanding of the impact of the environment on the formation, evolution and disruption processes of recently formed star clusters, and their relation with old star clusters, like the well-studied globular clusters in the Milky Way.
7 Acknowledgments
This paper is based on archival observations with the NASA/ESA Hubble Space Telescope, obtained at the Space Telescope Science Institute, which is operated by the Association of Universities for Research in Astronomy (AURA), Inc., under NASA contract NAS 5-26555. This paper is also partially based on ASTROVIRTEL research support, a project funded by the European Commission under 5FP Contract HPRI-CT-1999-00081. This research has made use of NASA’s Astrophysics Data System Abstract Service. This research has also made use of the NASA/IPAC Extragalactic Database (NED) which is operated by the Jet Propulsion Laboratory, California Institute of Technology, under contract with the National Aeronautics and Space Administration. PA is partially funded by DFG grant Fr 911/11-1. PA also acknowledges partial funding from the Marie Curie Fellowship programme EARASTARGAL “The Evolution of Stars and Galaxies”, funded by the European Commission under 5FP contract HPMT-CT-2000-00132. We would like to thank Henny Lamers for many fruitful discussions and the hospitality of the University of Utrecht, as well as the anonymous referee for many useful suggestions.
References
- [] Aloisi A., Clampin M., Diolaiti E., Greggio L., Leitherer C., Nota A., Origlia L., Parmeggiani G., Tosi M., 2001, AJ, 121, 1425
- [] Anders P., Fritze – v. Alvensleben U., 2003, A&A, 401, 1063
- [] Anders P., Bissantz N., Fritze – v. Alvensleben U., de Grijs R., 2003, MNRAS, submitted
- [] Arp H., Sandage A., 1985, AJ, 90, 1163
- [] Ashman K. M., Conti A., Zepf S. E., 1995, AJ, 110, 1164
- [] Ashman K. M., Zepf S. E., 2001, AJ, 122, 1888
- [] Bertelli G., Bressan A., Chiosi C., Fagotto F., Nasi E., 1994, A&AS, 106, 275
- [] Boutloukos S. G., Lamers H. J. G. L. M., 2003, MNRAS, 338, 717
- [] Buckalew B. A., Dufour R. J., Shopbell P. L., Walter D. K., 2000, AJ, 120, 2402
- [] Calzetti D., Armus L., Bohlin R. C., Kinney A. L., Koornneef J., Storchi-Bergmann T., 2000, ApJ, 533, 682
- [] Cerviño M., Valls-Gabaud D., Luridiana V., Mas-Hesse J. M., 2002, A&A, 381, 51
- [] Cerviño M., Valls-Gabaud D., 2003, MNRAS, 338, 481
- [] Della Ceca R., Griffiths R. E., Heckman T. M., MacKenty J. W., 1996, ApJ, 469, 662
- [] Devost D., Roy J.-R., Drissen L., 1997, ApJ, 482, 765
- [] Elmegreen B. G., 2002, ApJ, 577, 206
- [] Eskridge P. B., Frogel, J. A., Taylor, V. A. et al., 2003, ApJ, 586, 923
- [] Gerola H., Seiden P. E., 1978, ApJ, 223, 129
- [] Gilbert A. M., Graham J. R., D., 2001, in Geisler D., Grebel E.K., Minniti D., eds, Proc. IAU Symp. 207, Extragalactic Star Clusters. Astron. Soc. Pac., San Francisco, p. 471 (GG01)
- [] Girardi L., Bressan A., Bertelli G., Chiosi C., 2000, A&AS, 141, 371
- [] González Delgado R. M., Leitherer C., Heckman T., Cerviño M., 1997, ApJ, 483, 705
- [] Greggio L., Tosi M., Clampin M., de Marchi G., Leitherer C., Nota A., Sirianni M., 1998, ApJ, 504, 725
- [] de Grijs R., Fritze – v. Alvensleben U., Anders P., Gallagher III J. S., Bastian N., Taylor V. A., Windhorst R. A., 2003a, MNRAS, 342, 259
- [] de Grijs R., Anders P., Bastian N., Lynds R., Lamers H.J.G.L.M., O’Neil Jr. E.J., 2003b, MNRAS, 343, 1285
- [] de Grijs R., Bastian N., Lamers H.J.G.L.M., 2003c, MNRAS, 340, 197
- [] de Grijs R., Gilmore G. F., Johnson R. A., Mackey A. D., 2002a, MNRAS, 331, 245
- [] de Grijs R., Gilmore G.F., Mackey A.D., Wilkinson M.I., Beaulieu S.F., Johnson R.A., Santiago B.X., 2002b, MNRAS, 337, 597
- [] de Grijs R., O’Connell R. W., Gallagher III J. S., 2001, AJ, 121, 768
- [] Greve A., Tarchi A., Hüttemeister S., de Grijs R., van der Hulst J.M., Garrington S.T., Neininger N., 2002, A&A, 381, 825
- [] Heckman T. M., Dahlem M., Lehnert M. D., Fabbiano G., Gilmore D., Waller W. H., 1995, ApJ, 448, 98
- [] Ho L. C., Filippenko A. V., 1996, ApJ, 466, L83 (HF96)
- [] Hodge P. W., 1974, ApJ, 191, L21
- [] Hunter D. A., Thronson Jr. H. A., Casey S., Harper D. A., 1989, ApJ, 341, 697
- [] Hunter D. A., O’Connell R. W., Gallagher III J. S., Smecker-Hane T. A., 2000, AJ, 120, 2383 (H00)
- [] Israel F. P., 1988, A&A, 194, 24
- [] Izotov Y. I., Thuan T. X., Lipovetsky V. A., 1994, ApJ 435, 647
- [] Izotov Y. I., Thuan T. X., Lipovetsky V. A., 1997, ApJS 108, 1
- [] Izotov Y. I., Thuan T. X., 1998, ApJ 500, 188
- [] Kobulnicky H. A., Skillman E. D., 1997, ApJ, 489, 636
- [] Kroupa P., Tout C. A., Gilmore G., 1993, MNRAS, 262, 545
- [] Lejeune T., Cuisinier F., Buser R., 1997, A&AS 125, 229
- [] Lejeune T., Cuisinier F., Buser R., 1998, A&AS 130, 65
- [] Lisenfeld U., Israel F. P., Stil J. M., Sievers A., 2002, A&A, 382, 860
- [] Maoz D., Ho L. C., Sternberg A., 2001, ApJ, 554, L139
- [] de Marchi G., Clampin M., Greggio L., Leitherer C., Nota A., Tosi M., 1997, ApJ, 479, L27
- [] Martin C. L., Kobulnicky H. A., Heckman T. M., 2002, ApJ, 574, 663
- [] Origlia L., Leitherer C., Aloisi A., Greggio L., Tosi M., 2001, AJ, 122, 815
- [] Schaerer D., de Koter A., 1997, A&A 322, 598
- [] Schlegel D. J., Finkbeiner D. P., Davis M., 1998, ApJ, 500, 525
- [] Schulz J., Fritze – v. Alvensleben U., M ller C. S., Fricke K. J., 2002, A&A, 392, 1
- [] Seiden P.E., Schulman L.S., Elmegreen B.G., 1984, ApJ, 282, 95
- [] Smith L. J., Norris R. P. F., Crowther P. A., 2002, MNRAS ,337, 1309
- [] Stasińska G., 1984, A&AS, 55, 15
- [] Stetson P. B., 1987, PASP, 99, 191
- [] Stil J. M., Israel F. P., 1998, A&A, 337, 64
- [] Stil J. M., Israel F. P., 2002, A&A, 392, 473
- [] Taylor C. L., Hüttemeister S., Klein U., Greve A., 1999, A&A, 349, 424
- [] Tomita A., Ohta K., Saito M., 1994, PASJ, 46, 335
- [] Vallenari A., Bomans D. J., 1996, A&A, 313, 713
- [] de Vaucouleurs G., de Vaucouleurs A., Pence W., 1974, ApJ, 194, L119
- [] Waller W. H., 1991, ApJ, 370, 144
- [] Whitmore B. C., Zhang Q., Leitherer C., Fall S. M., Schweizer F., Miller B. W., 1999, AJ, 118, 1551